Car Ownership Hits Affordability Limit; Nearly 4 in 10 Americans Say It’s a Financial Stretch
Owning a car has long been less of a choice and more of a necessity for most Americans, but the affordability of it is becoming questionable for many.
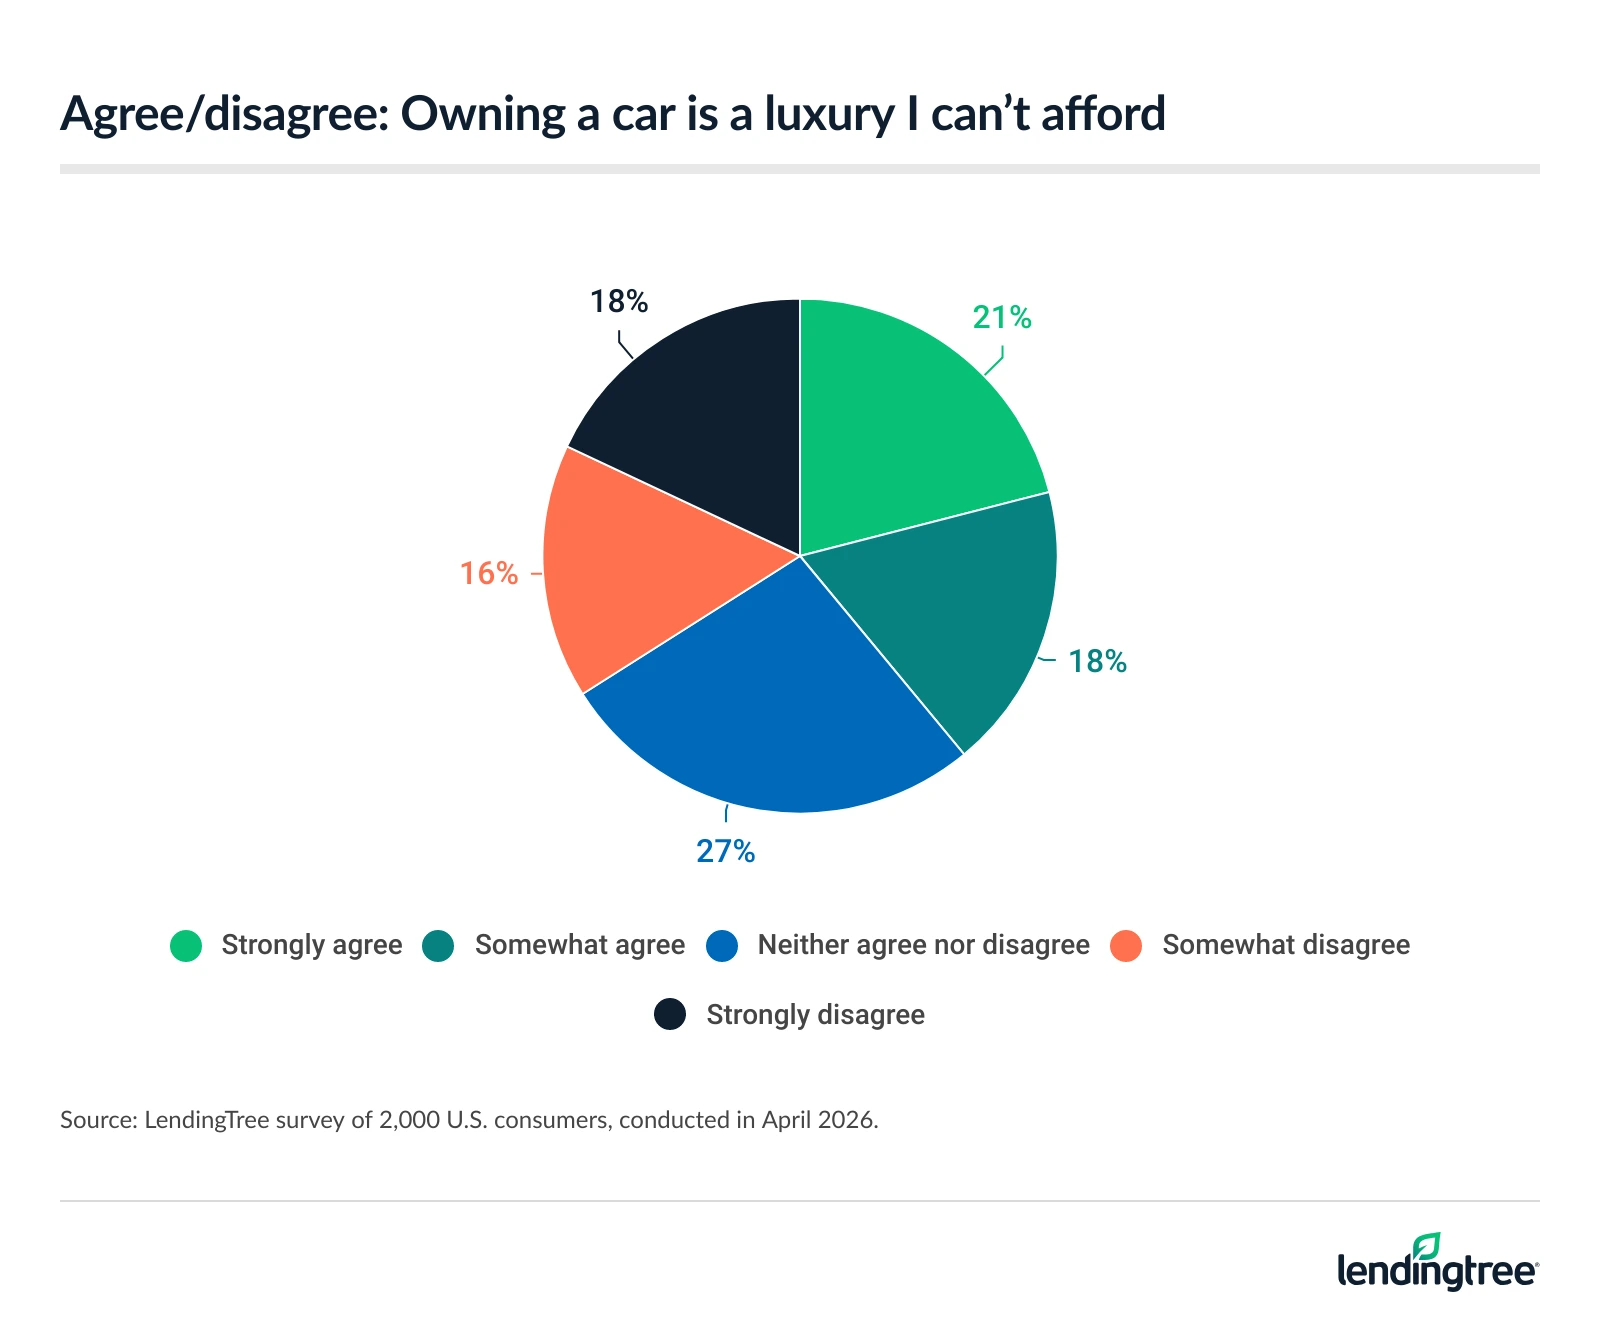
As vehicle prices and insurance premiums climb, the cost of car ownership is consuming a growing share of household budgets, pushing many to a financial breaking point. A separate LendingTree survey found that owning a car is a luxury 39% of Americans can’t afford.
Here’s what you need to know.
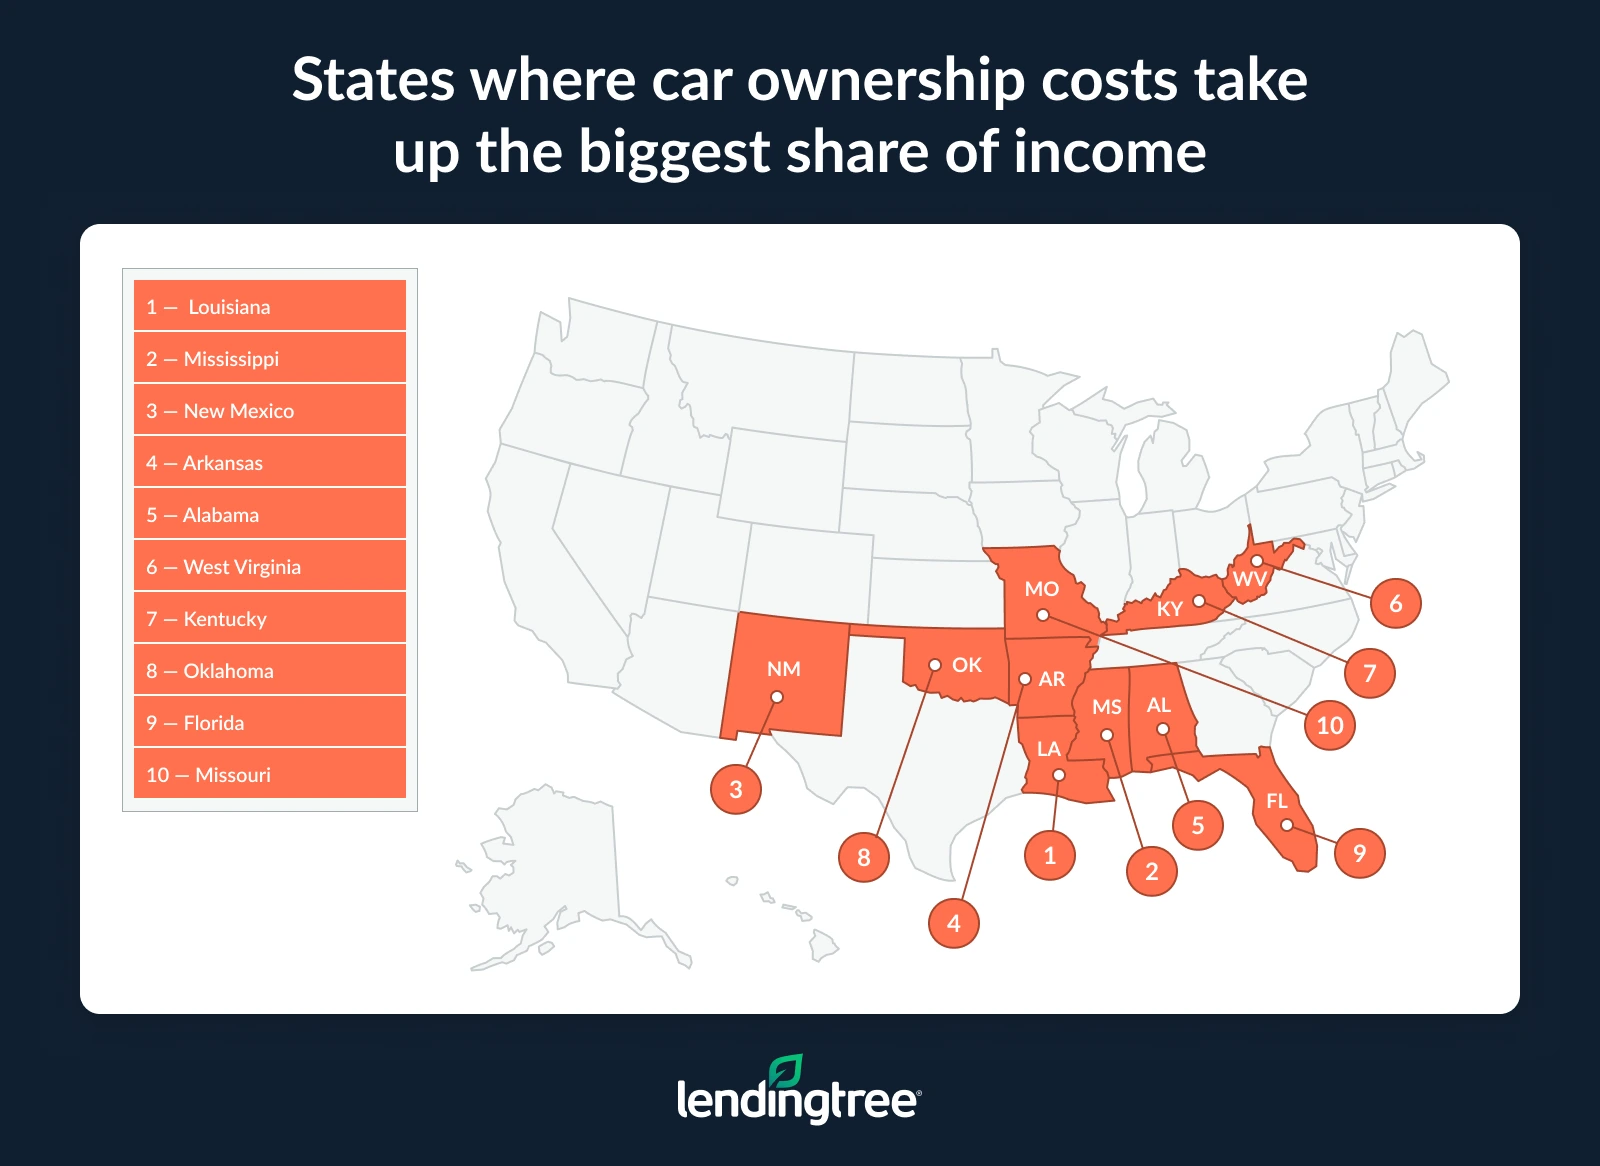
- Car ownership is hitting the affordability limit for many households. Americans with active auto loans spend an average of 15.0% of their income on car costs — $12,841 annually against a median household income of $85,759 — matching the threshold for being transportation cost-burdened. The strain is highest in Louisiana (23.2%), Mississippi (21.5%) and New Mexico (19.8%).
- Rising fixed costs, especially loan payments and insurance, are driving the burden. Loan payments average $7,275 annually, far more than insurance ($2,277), gas ($2,105) or maintenance ($1,184). Insurance costs have surged 37.5% since 2021, outpacing income growth (23.9%) and other vehicle expenses.
- Americans are divided on affordability, but many feel priced out personally. Equal shares say car ownership is still reasonably affordable (39%) and a financial stretch (39%). At the same time, 39% say owning a car is a luxury they can’t afford.
- Costs are affecting both daily budgets and financial resilience. Purchase price (30%) and monthly payments (20%) are the toughest expenses to manage, while 42% report at least frequent stress about car costs. When faced with a $1,000 repair, many would turn to savings (28%), but others would rely on credit and carry a balance (17%) or delay the repair (13%).
Car ownership is hitting the affordability limit for many households
Owning a car has always come with costs, but those costs have reached a tipping point for many households. Americans with active auto loans spend an average of 15.0% of their income on car-related expenses, putting $12,841 annually toward car costs against a median household income of $85,759.
That matches the benchmark that experts use to define being transportation cost-burdened. According to the U.S. Department of Transportation, households that spend more than 15% of their income on transportation meet this threshold.
The strain is highest in Louisiana, where auto loan holders put $14,894 of their $64,199 median household income toward car costs — or 23.2%. Mississippi (21.5%) follows, with auto loan holders putting $13,378 of their $62,242 median household income toward car costs. New Mexico (19.8%) rounds out the top three.
Matt Schulz, LendingTree chief consumer finance analyst and author of “Ask Questions, Save Money, Make More: How to Take Control of Your Financial Life,” says that means a lot of people are really stretching their finances to afford the vehicle they drive.
“One long-held rule of thumb is that a monthly auto payment shouldn’t exceed 10% of monthly income, and that your overall auto-related expenses shouldn’t top 20% of your income,” he says. “That so many people are topping that 20% threshold with their car payment alone is definitely troubling.”
In total, consumers with active car loans in 26 states are considered transportation cost-burdened.
At the other end of the list, Massachusetts auto loan holders allocate the smallest share of their income toward car costs, at 10.6%. This translates to $11,745 of the median household income of $110,350 going toward car costs. New Hampshire (10.9%) and the District of Columbia (11.4%) follow.
Full rankings: Where car ownership costs take up the biggest share of income among active auto loan holders
| Rank | State | Insurance rate | Avg. car payment | Gas | Repair costs | Total costs | Median household income | % of household income |
|---|---|---|---|---|---|---|---|---|
| 1 | Louisiana | $4,006 | $7,788 | $2,220 | $880 | $14,894 | $64,199 | 23.2% |
| 2 | Mississippi | $2,107 | $7,680 | $2,744 | $847 | $13,378 | $62,242 | 21.5% |
| 3 | New Mexico | $2,363 | $7,788 | $2,646 | $1,318 | $14,115 | $71,388 | 19.8% |
| 4 | Arkansas | $2,772 | $7,404 | $1,779 | $843 | $12,798 | $65,378 | 19.6% |
| 5 | Alabama | $2,117 | $7,488 | $2,701 | $858 | $13,164 | $70,171 | 18.8% |
| 6 | West Virginia | $1,706 | $7,188 | $2,167 | $890 | $11,951 | $64,001 | 18.7% |
| 7 | Kentucky | $2,238 | $6,912 | $2,593 | $886 | $12,628 | $67,925 | 18.6% |
| 8 | Oklahoma | $2,285 | $7,296 | $2,291 | $851 | $12,722 | $69,633 | 18.3% |
| 9 | Florida | $3,411 | $7,908 | $2,221 | $1,005 | $14,546 | $81,830 | 17.8% |
| 10 | Missouri | $2,559 | $7,008 | $2,547 | $1,121 | $13,235 | $75,360 | 17.6% |
| 11 | Arizona | $3,820 | $7,548 | $2,046 | $1,447 | $14,860 | $85,779 | 17.3% |
| 12 | Wyoming | $1,323 | $7,812 | $3,085 | $1,313 | $13,533 | $79,511 | 17.0% |
| 13 | Texas | $2,636 | $8,376 | $2,188 | $940 | $14,139 | $83,921 | 16.8% |
| 13 | Nevada | $2,783 | $7,860 | $2,247 | $1,452 | $14,341 | $85,408 | 16.8% |
| 15 | Montana | $2,366 | $7,272 | $2,261 | $1,346 | $13,245 | $79,309 | 16.7% |
| 16 | Georgia | $2,696 | $7,992 | $2,110 | $935 | $13,733 | $84,205 | 16.3% |
| 16 | Tennessee | $1,943 | $7,356 | $2,165 | $886 | $12,350 | $75,790 | 16.3% |
| 16 | Kansas | $2,391 | $7,116 | $2,342 | $1,092 | $12,941 | $79,492 | 16.3% |
| 19 | Indiana | $1,704 | $6,804 | $2,613 | $1,148 | $12,269 | $75,750 | 16.2% |
| 20 | South Carolina | $1,947 | $7,296 | $2,082 | $907 | $12,233 | $76,161 | 16.1% |
| 21 | Michigan | $2,461 | $6,720 | $1,837 | $1,191 | $12,208 | $76,202 | 16.0% |
| 22 | North Dakota | $1,944 | $7,464 | $2,259 | $1,098 | $12,766 | $81,973 | 15.6% |
| 23 | Ohio | $1,678 | $6,852 | $1,889 | $1,155 | $11,574 | $76,016 | 15.2% |
| 24 | Iowa | $2,016 | $7,008 | $1,897 | $1,072 | $11,992 | $79,478 | 15.1% |
| 24 | North Carolina | $1,212 | $7,320 | $2,281 | $912 | $11,725 | $77,854 | 15.1% |
| 24 | Nebraska | $2,251 | $6,816 | $1,967 | $1,099 | $12,133 | $80,399 | 15.1% |
| 27 | South Dakota | $1,998 | $6,996 | $2,027 | $1,071 | $12,092 | $80,931 | 14.9% |
| 28 | Wisconsin | $1,867 | $6,768 | $2,150 | $1,161 | $11,947 | $81,570 | 14.6% |
| 28 | New York | $2,610 | $7,416 | $1,475 | $1,683 | $13,183 | $90,341 | 14.6% |
| 30 | Idaho | $1,630 | $7,104 | $2,259 | $1,347 | $12,340 | $85,442 | 14.4% |
| 30 | Pennsylvania | $2,130 | $6,828 | $1,587 | $1,191 | $11,735 | $81,630 | 14.4% |
| 32 | Illinois | $2,115 | $7,236 | $1,900 | $1,298 | $12,549 | $87,594 | 14.3% |
| 33 | Maine | $1,246 | $6,780 | $2,068 | $1,138 | $11,231 | $80,469 | 14.0% |
| 33 | Oregon | $2,146 | $6,708 | $2,161 | $1,512 | $12,528 | $89,709 | 14.0% |
| 35 | Delaware | $2,946 | $7,164 | $1,598 | $972 | $12,680 | $92,145 | 13.8% |
| 36 | Rhode Island | $2,898 | $6,456 | $1,450 | $1,237 | $12,042 | $87,903 | 13.7% |
| 37 | Colorado | $3,289 | $7,344 | $1,768 | $1,475 | $13,876 | $102,229 | 13.6% |
| 37 | California | $2,383 | $7,788 | $2,533 | $1,621 | $14,325 | $105,425 | 13.6% |
| 39 | Minnesota | $2,256 | $6,912 | $1,914 | $1,222 | $12,304 | $91,706 | 13.4% |
| 40 | Vermont | $1,345 | $6,804 | $2,247 | $1,146 | $11,542 | $87,088 | 13.3% |
| 41 | Alaska | $1,862 | $7,920 | $1,739 | $1,530 | $13,051 | $100,705 | 13.0% |
| 41 | Washington | $2,616 | $7,392 | $1,981 | $1,569 | $13,558 | $104,625 | 13.0% |
| 43 | Utah | $2,220 | $6,972 | $2,426 | $1,405 | $13,023 | $101,750 | 12.8% |
| 44 | Virginia | $1,719 | $7,356 | $2,155 | $985 | $12,214 | $96,941 | 12.6% |
| 45 | New Jersey | $3,188 | $7,500 | $1,681 | $1,339 | $13,708 | $109,788 | 12.5% |
| 45 | Connecticut | $2,712 | $6,912 | $1,762 | $1,245 | $12,630 | $101,109 | 12.5% |
| 47 | Hawaii | $1,563 | $7,716 | $2,304 | $1,610 | $13,193 | $106,052 | 12.4% |
| 48 | Maryland | $2,536 | $7,740 | $1,985 | $1,052 | $13,314 | $108,326 | 12.3% |
| 49 | District of Columbia | $2,886 | $7,416 | $1,322 | $1,580 | $13,205 | $115,486 | 11.4% |
| 50 | New Hampshire | $1,531 | $6,840 | $1,844 | $1,203 | $11,418 | $105,038 | 10.9% |
| 51 | Massachusetts | $1,710 | $6,900 | $1,823 | $1,312 | $11,745 | $110,350 | 10.6% |
Loan payments, rising insurance are squeezing budgets the most
Why is car ownership so costly? Loan payments are the driving force, averaging $7,275 annually. That’s followed by insurance ($2,277), gas ($2,105) and maintenance ($1,184).
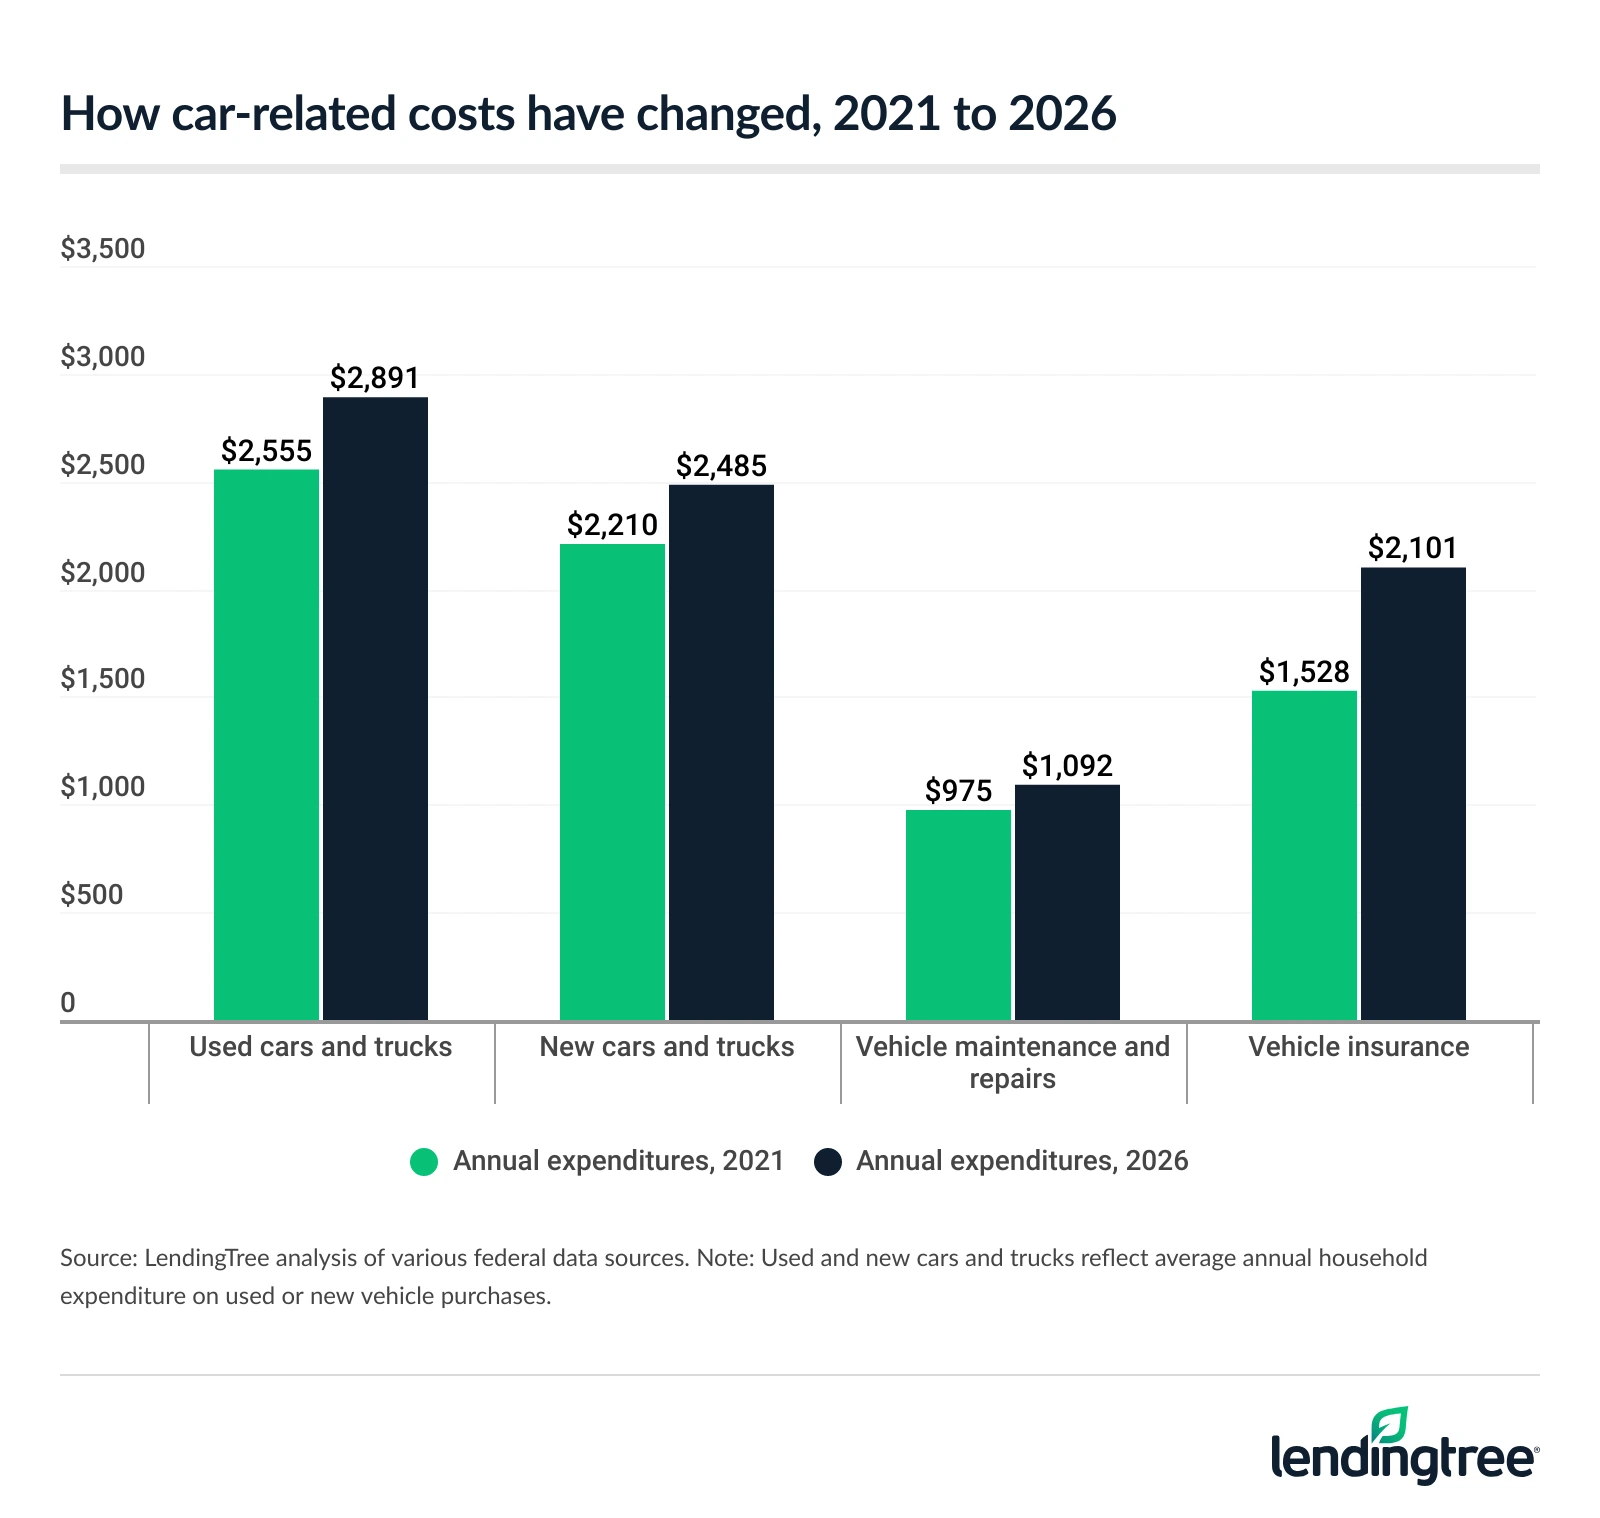
To make matters worse for car owners, auto insurance costs have risen 37.5% since 2021, far outpacing the rising costs of other vehicle expenses, as well as income growth.
For comparison, new and used vehicle purchase prices have risen 12.4% and 13.1%, respectively, while the cost of vehicle maintenance has gone up 12.0%. Meanwhile, household income rose 23.9% over the same period.
With that in mind, Schulz says that insurance costs are just as important as getting a good interest rate on your auto loan.
“Rising insurance costs are quietly making already-expensive car loans even harder to afford,” he says. “That’s because they push up the true monthly cost of ownership well beyond the loan payment itself, turning a loan that looks manageable on paper into a big challenge.”
There are ways to prevent this problem from arising, though.
“To avoid that, borrowers should factor insurance into their car budget from the very beginning, compare insurers as aggressively as they shop for loans, consider increasing deductibles if they have the savings to support it and maybe even look at less-expensive vehicles that are cheaper to insure,” Schulz says.
Opinions on affordability are divided, but sticker shock is real
Turning to our survey of 2,000 U.S. consumers, opinions on car affordability are split down the middle. Equal shares say car ownership is still reasonably affordable (39%) and a financial stretch (39%). Meanwhile, another 39% say owning a car is a luxury they can’t afford.
Unsurprisingly, perspective shifts with income. More than half (51%) of those earning $100,000 or more say car ownership is reasonably affordable, while 50% of those earning less than $30,000 say they can’t personally afford owning a car. And over the next 12 months, 35% believe owning a car will become less affordable for a household like theirs, while 23% believe it will become more affordable. Another 42% believe it will stay the same.
When it comes to the annual income needed to own a car, 42% believe it’s less than $50,000. Meanwhile, 39% say $50,000 to $99,999, and 19% think a six-figure salary is necessary.
With opinions split, Schulz says it’s important to determine affordability for yourself.
“Crunch the numbers yourself long before you ever set foot in a dealership,” he says. “Car affordability calculators like the one we have at LendingTree are an essential part of this process. They allow you to manipulate monthly payments, down payments, interest rates and more to get a real feel for how pricey a car you can afford on paper.”
Those results are not all you should take into consideration, though, Schulz says. “Of course, it’s also important to gauge your own comfort levels with the costs. Just because an online calculator says you can afford it doesn’t mean that you can or that you’d sleep soundly knowing that you did it.”
Despite affordability challenges, 61% of overall respondents say they personally own or lease a car — a figure that climbs to 78% among baby boomers (ages 62 to 80) and drops to 39% of those earning less than $30,000.
However, not everyone wants to be a car owner. In fact, 49% of Americans say that if they could reliably get where they needed without owning a car, they probably wouldn’t want one. Meanwhile, 46% of car owners have at least considered going without a car to reduce expenses, with 17% having already reduced their car use.
Financial stress of car ownership goes beyond the purchase price
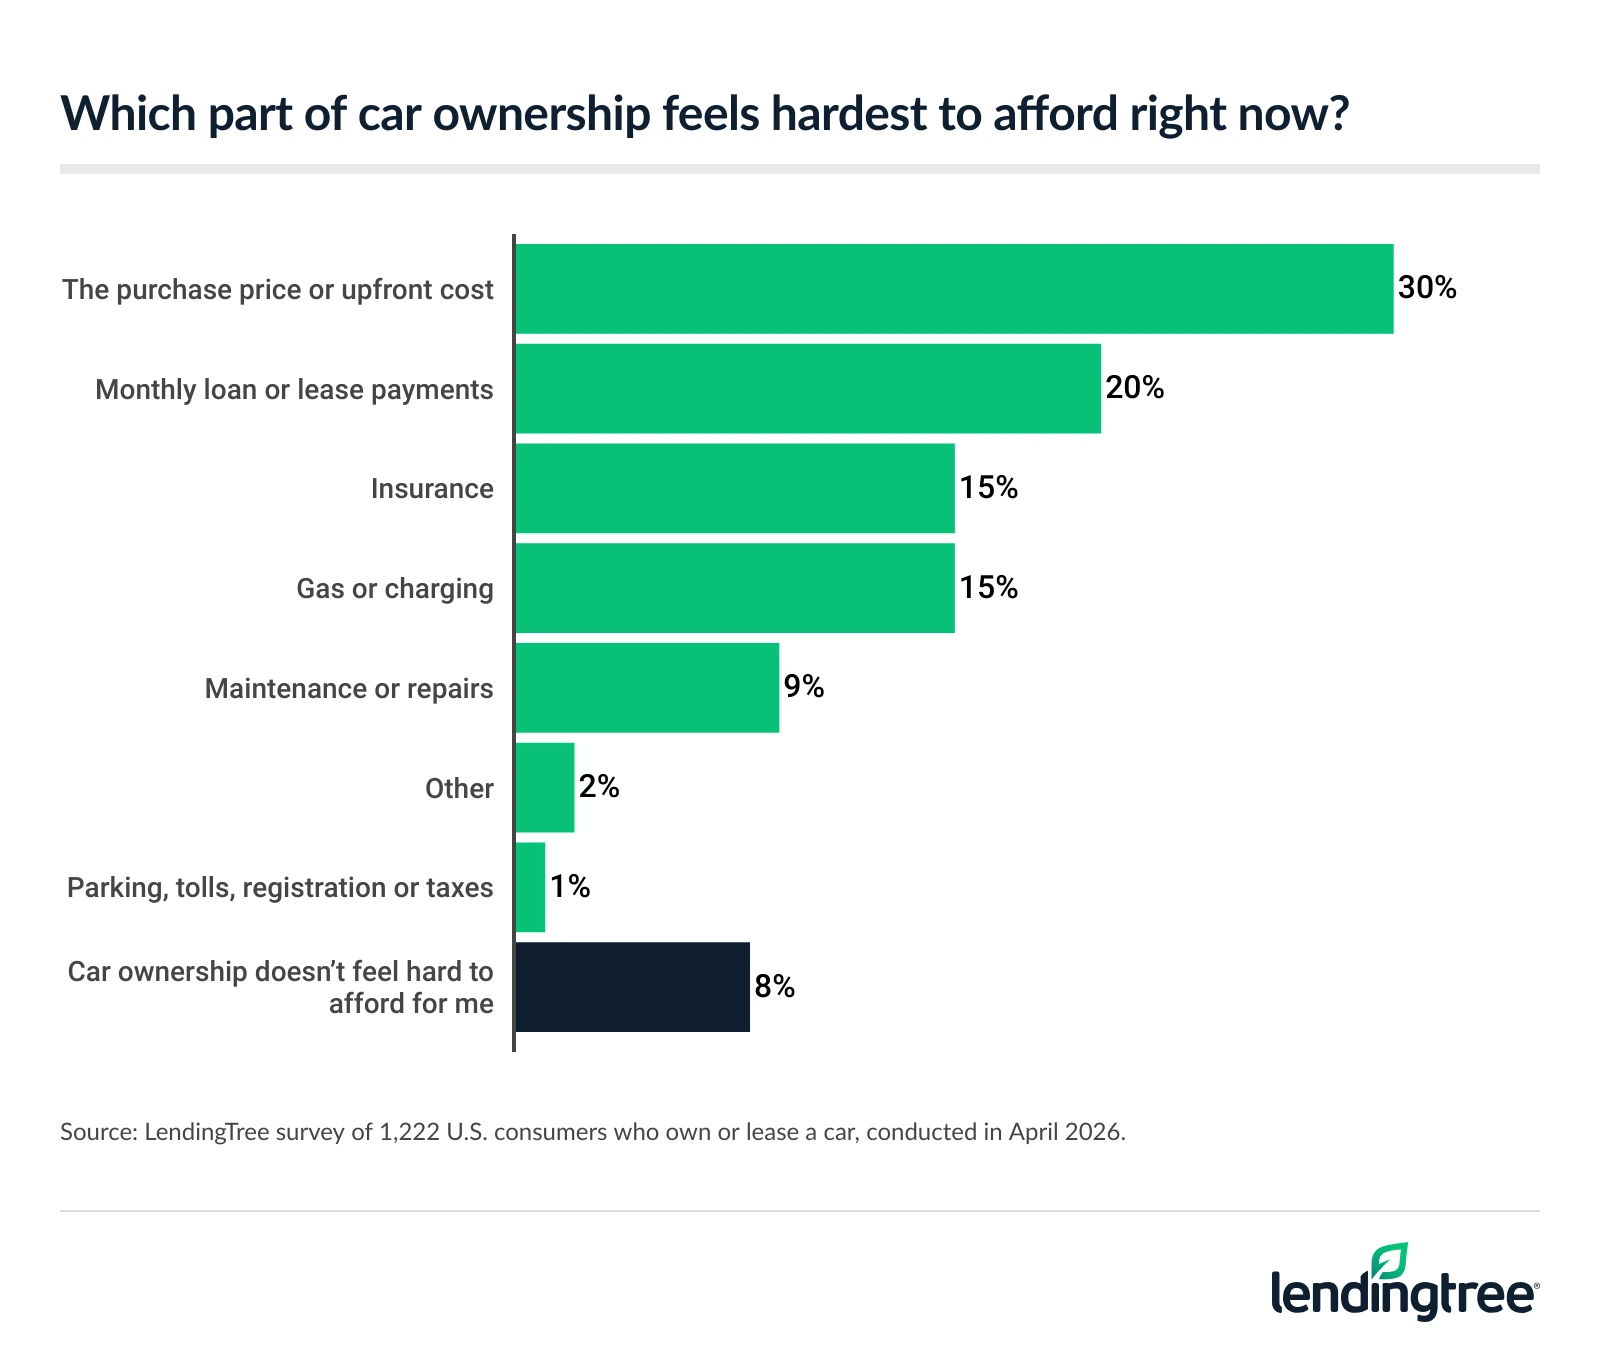
Car expenses are squeezing Americans at every stage. But when it comes to the hardest costs to manage, purchase price (30%) tops the list among car owners or lessees, followed by monthly payments (20%).
With purchase price and monthly payments such a crucial pain point, Schulz says consumers need to consider their approach in the dealership.
“Setting a firm total budget rather than just a monthly payment goal, shopping lenders in advance and being willing to consider used or less expensive models can dramatically reduce both upfront and long-term costs,” he says. “During the loan process, small differences in interest rates or loan terms can add up to thousands, so it pays to compare offers and avoid stretching the loan just to lower the payment.”
Those costs can have an impact beyond budgets. Among those who own or lease a car, 42% report at least frequent stress about car costs.
That pressure is altering behavior. While 49% say they haven’t made changes due to costs, 51% say they have. The most common change is delaying a purchase at 21%, a figure that rises to 27% among Gen Zers (ages 18 to 29). Following that, 16% report choosing a less expensive car than what they originally wanted, 13% say they kept their original car longer than they planned and 12% chose not to buy a new car at all.
The strain becomes even more evident when an unexpected expense hits. Faced with a $1,000 bill, 28% say they would use savings — but 17% would rely on credit cards and carry the balance, and 13% say they would delay the repair because they couldn’t afford it right away.
Affording a car today: Top expert tips
While car costs are climbing, there are ways to keep them more manageable. Here are our top tips for navigating car ownership today without breaking your budget:
- In today’s market, the smartest move is to think broadly about car ownership instead of just focusing on the sticker price. “That means factoring in insurance, interest and maintenance and making sure the total cost fits comfortably within your broader financial goals,” Schulz says. “If a vehicle is going to strain your budget or limit your ability to save, it’s probably too expensive, no matter what the monthly payment looks like.”
- Don’t overlook the power of your credit score. The interest rate you qualify for can make a significant difference in your total cost of ownership over the life of a loan, so it’s worth checking your credit and taking steps to improve it if needed. Even small improvements in your rate can save you hundreds of dollars.
- Perhaps the most important step of all is shopping around. “It sounds simple, but it can impact almost every aspect of car ownership from the sticker price and the interest rate to your insurance and even where you get your car’s maintenance done,” he says. “All these things are expensive, but the costs for all these things can be kept down, to varying degrees, if you’re willing to shop around.”
Methodology
LendingTree analyzed the total annual cost of car ownership across all 50 states and the District of Columbia, calculating auto insurance, loan payment, fuel and maintenance expenses.
Total costs were calculated at the state level and compared against the median household income to determine the share of income required. Income figures were adjusted to 2026 dollars using personal income data from the U.S. Bureau of Economic Analysis (BEA), accessed via Federal Reserve Economic Data (FRED). Individual cost components were adjusted to 2026 dollars using category-specific U.S. Bureau of Labor Statistics (BLS) consumer price index (CPI) changes where applicable, primarily for maintenance and repair costs, by applying the percentage change from 2024 to 2026 to baseline expenditure data.
To assess affordability, LendingTree applied a 15% transportation cost threshold based on U.S. Department of Transportation guidance. Households spending more than 15% of income on transportation costs are considered transportation cost-burdened under this framework.
LendingTree uses insurance rate data from Quadrant Information Services based on publicly sourced insurance company filings. Rates reflect a full coverage policy for a 30-year-old driver with good credit and a clean driving record who drives a 2018 Honda Civic EX. Rates were collected Jan. 8, 2026, and averaged by state for comparison purposes. Full coverage policies include:
- Bodily injury liability: $50,000 per person and $100,000 per accident
- Property damage liability: $50,000
- Uninsured and underinsured motorist bodily injury: $50,000 per person and $100,000 per accident
- Personal injury protection (PIP) or medical payments: Minimum limits, where required by state law
- Collision: $500 deductible
- Comprehensive: $500 deductible
Loan payment estimates are based on anonymized LendingTree user data from the fourth quarter of 2025. Researchers analyzed active auto loan accounts, including both new and used vehicles, and individual and joint accounts. For each user, one representative loan was selected as the tradeline with the largest current balance. Average monthly payments were calculated by state and multiplied by 12 to estimate annual loan costs.
Fuel costs were calculated using AAA data on average regular gas prices as of April 15, 2026. These prices were combined with Federal Highway Administration (FHWA) Highway Statistics Series 2024 data on vehicle miles traveled and licensed drivers. Researchers divided total miles traveled by the number of licensed drivers to estimate average annual miles driven per driver. That figure was divided by the Environmental Protection Agency (EPA) national average fuel efficiency of 27.2 miles per gallon and multiplied by gas prices to calculate annual fuel costs.
Maintenance and repair costs are based on BLS Consumer Expenditure Survey data at the regional level. These figures were adjusted to the state level using regional price parities (RPPs) and weighted by the share of households with at least one vehicle. Costs were then adjusted to 2026 dollars using category-specific CPI changes for motor vehicle maintenance and repair.
Median household income was sourced from the U.S. Census Bureau 2024 American Community Survey (ACS) with one-year estimates and adjusted to Q4 2025 dollars (the most recent available) using personal income data from the BEA via FRED.
LendingTree also analyzed FRED for vehicle purchases, insurance and repair expenses to measure changes from 2021 to 2026. Historical expenditure data was adjusted to 2026 dollars using category-specific price indexes where applicable.
Separately, LendingTree commissioned QuestionPro to conduct an online survey of 2,000 U.S. consumers ages 18 to 80 from April 2 to 6, 2026. The survey was administered using a nonprobability-based sample, and quotas were used to ensure the sample base represented the overall population. Researchers reviewed all responses for quality control.
We defined generations as the following ages in 2026:
- Generation Z: 18 to 29
- Millennials: 30 to 45
- Generation X: 46 to 61
- Baby boomers: 62 to 80
Get auto loan offers from up to 5 lenders in minutes