Young Entrepreneurs Remain Rare: Fewer Than 6% of Employer Firms Are Owned by Under-35s
Of the 5.9 million U.S. businesses that employ at least one person beyond the owner, just 5.7% are owned by someone younger than 35.
That’s up slightly from our 2024 report, but it underscores how rare it is for young people to run businesses with employees. Our analysis also shows that young ownership of employer firms varies widely by industry and state.
Here’s more of what we found.
- A small share of employer firms are owned by people younger than 35, though that share has edged up. Just 5.7% of owners of employer firms are under 35, according to our analysis, up from 5.3% in our previous report. This highlights how uncommon Gen Z and younger millennial ownership remains.
- Wyoming has the highest share of employer-firm owners under 35, while West Virginia has the lowest. Among the 46 states for which there’s sufficient data, Wyoming leads at 8.8%, followed by Idaho (7.9%) and Utah (7.5%). At the other end, West Virginia has 3.7%, with Virginia and Louisiana next lowest at 4.1%.
- Younger business ownership rates vary significantly by industry. Information leads all sectors, with 8.8% of owners under 35, followed by arts, entertainment and recreation (7.8%), educational services (7.5%), and accommodation and food services (7.4%). By contrast, management of companies and enterprises has the lowest share at 2.0%.
- Ownership rates vary even more widely by race, but not by gender. Among employer firms owned by Native Hawaiians and other Pacific Islanders, 11.3% are owned by people under 35. That’s more than double the percentage seen in white-owned employer firms (5.5%) and far higher than shares among Black and Asian owners (both 7.4%). However, we saw virtually no gender gap in under-35 ownership rates.
The U.S. Census Bureau data we analyzed focuses on what it calls employer firms — businesses with at least one employee beyond the owner. The Census estimates there are 5.9 million of them nationwide.
This report doesn’t include one-person (nonemployer) businesses. Census data shows there were 30.4 million of these businesses in 2023, the most recent year available.
Note: We highlight 46 states because data was insufficient for the District of Columbia, Hawaii, New Hampshire, New Mexico and Vermont.
People under 35 own just a tiny percentage of employer firms
It’s rare for someone under 35 to own a business that employs other people. Our analysis found that just 5.7% of employer firms — about 1 in 16 — are owned by someone under 35. While that’s a small increase from 5.3% in our 2024 report, it remains far below the shares seen in older age groups.
Ownership rates rise steadily with age, peaking at 28.2% among those 55 to 64. The decline after 64 is modest, with 23.1% of employer firms owned by people 65 or older.
Employer-firm ownership highest among 45-to-64-year-olds
| Age | % among all employer firms |
|---|---|
| Under 25 | 0.4% |
| 25 to 34 | 5.3% |
| 35 to 44 | 18.0% |
| 45 to 54 | 25.0% |
| 55 to 64 | 28.2% |
| 65 or over | 23.1% |
Why the disparity between young and old entrepreneurs? Many factors likely play a role, but access to funding is a key one. Older Americans — especially those ages 45 to 64 — tend to have higher incomes and stronger credit profiles, making them less risky to lenders.
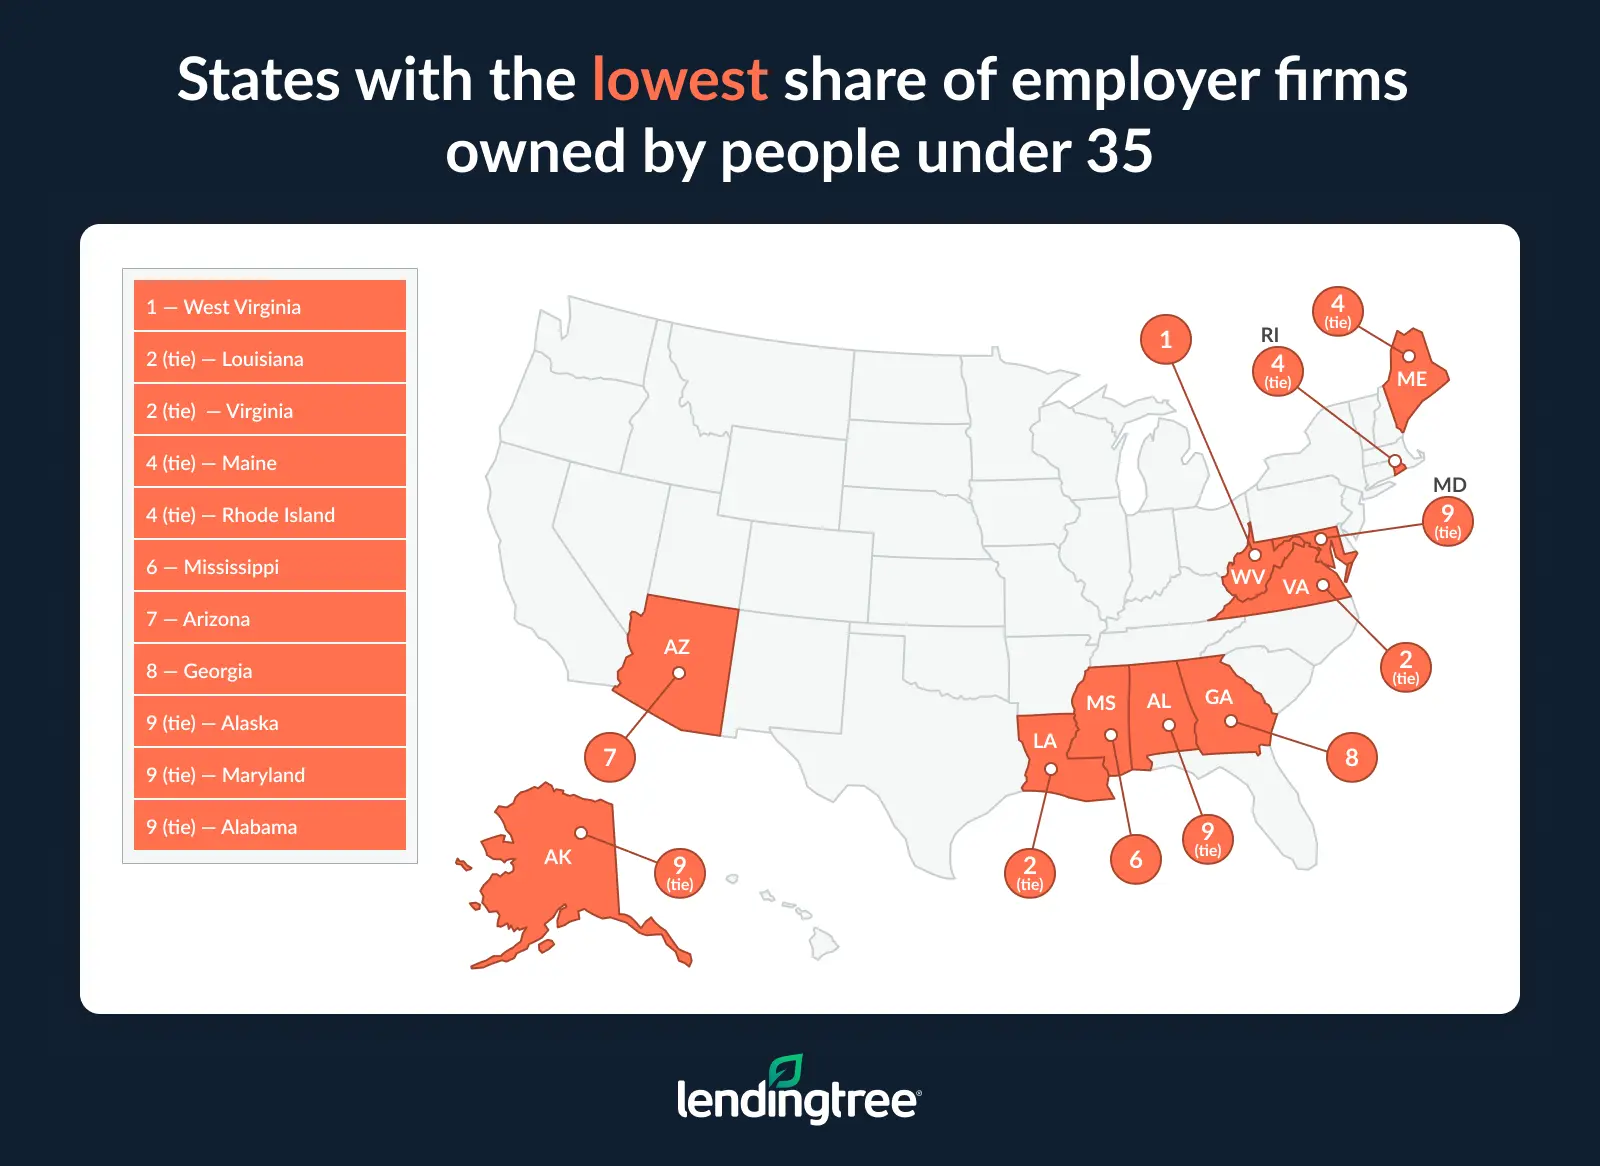
Wyoming has the highest share of employer-firm owners under 35, while West Virginia has the lowest
Among the 46 states with sufficient data, no state has a particularly high share of employer firms owned by people under 35. Still, the differences across states are notable.
Wyoming leads, with 8.8% of employer firms owned by someone under 35, followed by Idaho (7.9%) and Utah (7.5%). Only one top-10 state — Tennessee, tied for 10th — is east of the Mississippi River.
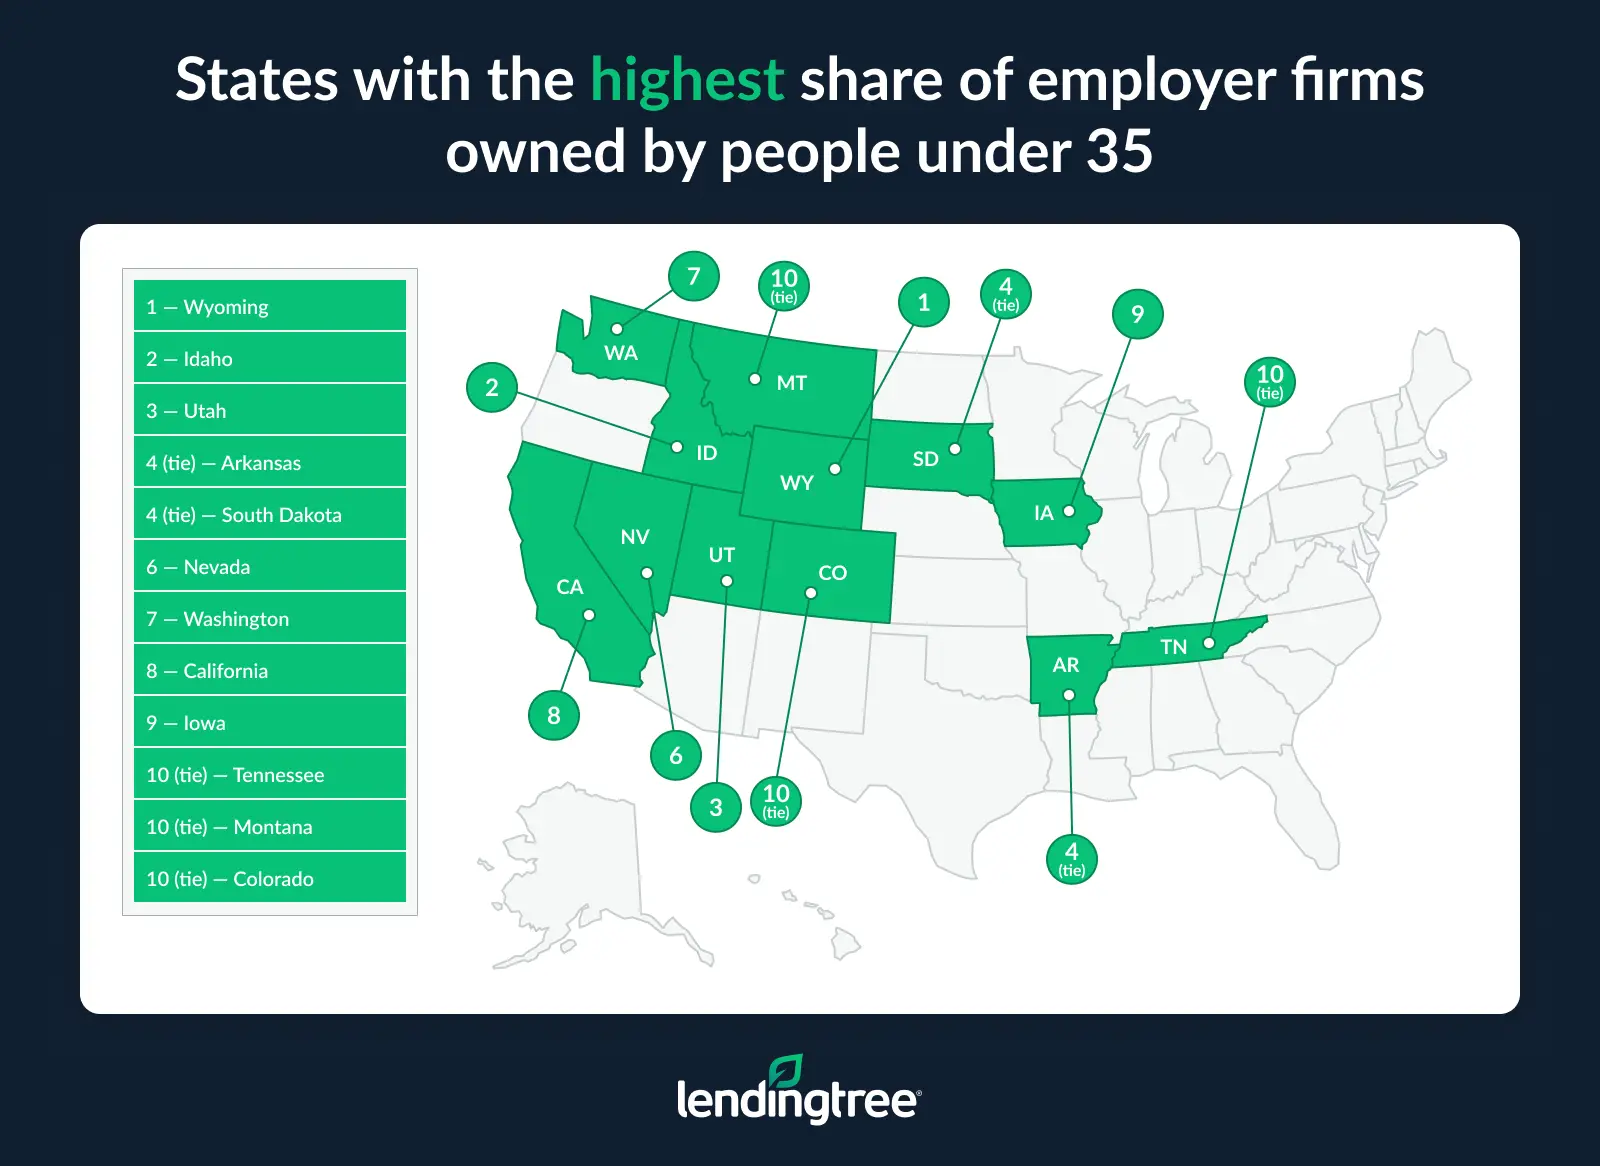
At the other end, West Virginia ranks last at 3.7%, with Louisiana and Virginia close behind at 4.1%. Seven states have shares at or below 4.4% — roughly half of Wyoming’s rate.
In stark contrast to the top of the list, the bottom end features mostly Southern or Northeastern states.
Percentage of employer firms owned by those under 35
| Rank | State | % |
|---|---|---|
| 1 | Wyoming | 8.8% |
| 2 | Idaho | 7.9% |
| 3 | Utah | 7.5% |
| 4 | Arkansas | 6.8% |
| 4 | South Dakota | 6.8% |
| 6 | Nevada | 6.7% |
| 7 | Washington | 6.5% |
| 8 | California | 6.3% |
| 9 | Iowa | 6.2% |
| 10 | Tennessee | 6.1% |
| 10 | Montana | 6.1% |
| 10 | Colorado | 6.1% |
| 13 | Indiana | 6.0% |
| 14 | Michigan | 5.9% |
| 14 | Oregon | 5.9% |
| 16 | South Carolina | 5.8% |
| 16 | New York | 5.8% |
| 16 | Delaware | 5.8% |
| 19 | Kansas | 5.7% |
| 19 | Minnesota | 5.7% |
| 21 | Florida | 5.6% |
| 21 | Pennsylvania | 5.6% |
| 21 | Ohio | 5.6% |
| 21 | Missouri | 5.6% |
| 25 | Wisconsin | 5.5% |
| 26 | North Dakota | 5.3% |
| 26 | Nebraska | 5.3% |
| 26 | Oklahoma | 5.3% |
| 26 | Texas | 5.3% |
| 30 | Kentucky | 5.2% |
| 31 | Connecticut | 5.1% |
| 31 | Massachusetts | 5.1% |
| 33 | Illinois | 4.9% |
| 33 | North Carolina | 4.9% |
| 35 | New Jersey | 4.8% |
| 36 | Alabama | 4.7% |
| 36 | Alaska | 4.7% |
| 36 | Maryland | 4.7% |
| 39 | Georgia | 4.6% |
| 40 | Arizona | 4.4% |
| 41 | Mississippi | 4.3% |
| 42 | Maine | 4.2% |
| 42 | Rhode Island | 4.2% |
| 44 | Louisiana | 4.1% |
| 44 | Virginia | 4.1% |
| 46 | West Virginia | 3.7% |
Younger business ownership rates vary significantly by industry
When broken down by industry, the pattern is similar: meaningful variation, but no sector where under-35 ownership is common.
The information sector leads, with 8.8% of firms owned by someone under 35. This includes businesses that create and distribute content as well as those providing the infrastructure that enables it. Arts, entertainment and recreation (7.8%), educational services (7.5%), and accommodation and food services (7.4%) follow.
At the low end, just 2.0% of firms in management of companies and enterprises are owned by someone under 35. This category includes holding companies and corporate headquarters.
Industries where ownership of employer firms by those under 35 is most common
| Industry | % in industry owned by under-35s |
|---|---|
| Information | 8.8% |
| Arts, entertainment and recreation | 7.8% |
| Educational services | 7.5% |
| Accommodation and food services | 7.4% |
| Other services (except public administration) | 7.3% |
| Administrative and support and waste management and remediation services | 7.1% |
| Transportation and warehousing | 7.0% |
| Agriculture, forestry, fishing and hunting | 6.5% |
| Construction | 6.3% |
| Retail trade | 5.9% |
| Health care and social assistance | 5.1% |
| Finance and insurance | 4.6% |
| Mining, quarrying, and oil and gas extraction | 4.5% |
| Real estate and rental and leasing | 4.3% |
| Manufacturing | 4.2% |
| Professional, scientific and technical services | 4.1% |
| Wholesale trade | 3.8% |
| Management of companies and enterprises | 2.0% |
Ownership rates vary widely by race, but not by gender
We also found significant differences in under-35 ownership by race and ethnicity. Among Native Hawaiian and other Pacific Islander-owned employer firms, 11.3% are owned by someone under 35 — the highest share of any group.
Among American Indian and Alaska Native-owned firms, the share is 9.3%. It’s 7.4% among both Black- and Asian-owned firms, compared with 5.5% among white-owned firms.
In addition, 9.9% of Hispanic- or Latino-owned employer firms are owned by someone under 35, compared with 5.3% of non-Hispanic- or Latino-owned firms.
By contrast, there’s virtually no gender gap: 5.7% of female-owned employer firms and 5.6% of male-owned employer firms are owned by someone under 35.
Employer-firm ownership by race, ethnicity and gender
| Race | % owned by under-35s |
| Native Hawaiian and other Pacific Islander | 11.3% |
| American Indian and Alaska Native | 9.3% |
| Asian | 7.4% |
| Black or African American | 7.4% |
| White | 5.5% |
| Ethnicity | % owned by under-35s |
| Hispanic or Latino | 9.9% |
| Not Hispanic or Latino | 5.3% |
| Gender | % owned by under-35s |
| Female | 5.7% |
| Male | 5.6% |
Tips for young entrepreneurs
The odds are stacked against any new business, regardless of the owner’s age. A recent LendingTree analysis of Bureau of Labor Statistics data found that 22.1% of businesses fail within their first year. That share rises to nearly half within five years and almost two-thirds within 10.
Clearly, there’s no magic formula for business success. However, there are some fundamental things you can do to improve your chances of survival.
- Get your personal credit in order. For aspiring entrepreneurs, your personal credit score matters more than you might realize. Make sure that you’re paying your bills on time every time, keeping your balances low and not applying for too much credit too often. It would also be wise to review your credit reports from the three major credit bureaus to make sure that they’re accurate. Mistakes on reports are more common than you might think — and can do real damage. That’s the last thing you need when you’re trying to start a business.
- Plan, plan, plan. It has never been easier to start a small business, but that doesn’t mean you don’t need to do your homework. Before you ever launch, make sure you have a business plan. You need to know your audience and what problem you’re trying to solve for them, understand your competitors, line up funding and so many other things. Of course, you won’t think of everything at first. Nobody does. Businesses are always evolving and changing. However, that initial plan can provide a foundation, focus and direction that’s invaluable for a small business, so don’t skip that step.
- Seek help. Many businesses, nonprofits and other organizations exist to help small businesses of all types thrive. Take advantage of them. There are agencies at every level of government, along with religious groups and other nonprofits in your area, that can make a huge difference, whether you’re looking for small business loans, marketing help, networking, training or help with virtually any other aspect of running a business. Googling “small business resources near me” can be a great place to start, but other helpful resources include:
Methodology
LendingTree analyzed data from the U.S. Census Bureau Annual Business Survey (ABS) to measure the share of owners of employer firms who are younger than 35.
We ranked states based on the share of entrepreneurs under 35. Data comes from the Census Bureau 2024 ABS (reflecting 2023 data).
We only had data for 46 states, as there wasn’t sufficient data for the District of Columbia, Hawaii, New Hampshire, New Mexico and Vermont.
Compare business loan offers