2026 Credit Card Debt Statistics


Americans have a record level of credit card debt — $1.263 trillion, to be exact.
This credit card debt statistics page tracks Americans’ credit card use each month. We update it regularly, examining how much debt consumers hold, how often they carry balances from month to month, how frequently they pay their credit card bills late and other key trends.
How much credit card debt do Americans have?
Americans’ total credit card balance is $1.263 trillion as of the second quarter of 2026, according to the latest consumer debt data from the Federal Reserve Bank of New York. That’s up from $1.242 trillion in Q1 2026, but still lower than Q4 2025’s $1.277 trillion, which marked the highest balance since the New York Fed began tracking the data in 1999.
It’s common for credit card debt to rise in the second quarter of the year. The last time card debt decreased in Q2 was in 2020, early in the pandemic. (Before that, it hadn’t happened since 2012.)
With this quarter’s increase, credit card balances have risen by $493 billion since Q1 2021, when credit card debt bottomed out at $770 billion during the pandemic. That’s a 64% increase. Americans’ credit card debt is $336 billion higher than the pre-pandemic record set in Q4 2019, when balances stood at $927 billion. (That’s a 36% increase.) Credit card balances have historically grown in the second, third and fourth quarters of the year, though future borrowing trends will depend on factors including interest rates, inflation and broader economic conditions.
Current balances are more than double the $478 billion recorded in Q1 1999, more than 25 years ago.
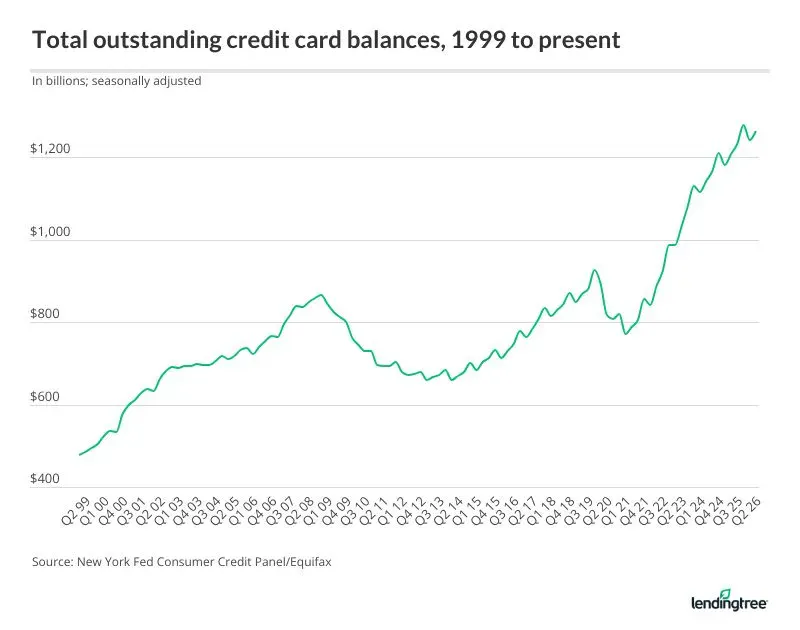
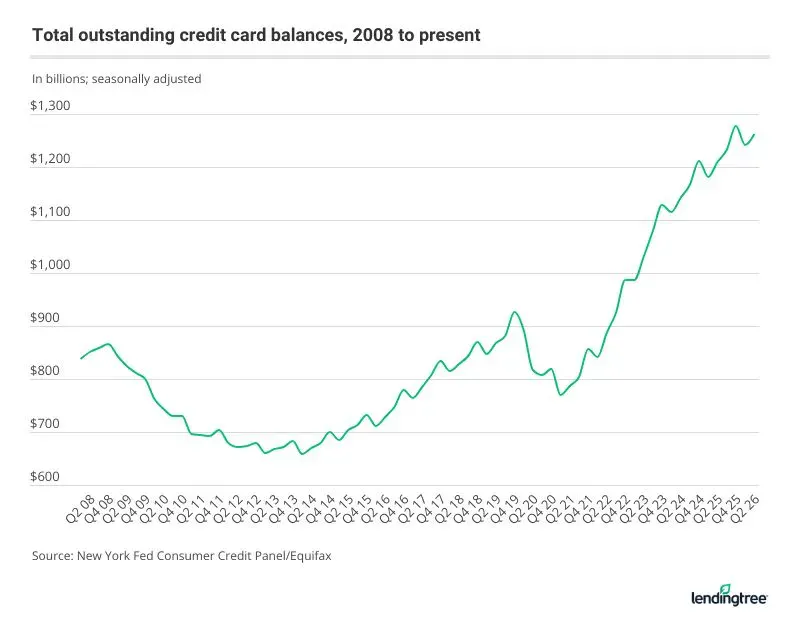
Credit card debt rose steadily until the Great Recession, then declined from $866 billion in Q4 2008 to $660 billion in Q1 2013 before resuming its upward trajectory.
When the pandemic took hold in 2020, credit card balances plunged again — from $927 billion in Q4 2019 to $770 billion in Q1 2021. Balances then rebounded sharply, beginning with a significant increase in Q4 2021 and reaching new highs in subsequent years.
Which states’ residents have the most credit card debt?
Credit cardholders in New Jersey have the highest average credit card debt of any state, according to LendingTree data, while those in West Virginia have the lowest.
| Rank | State | Avg. credit card debt, Q1 2026 | Avg. credit card debt, Q1 2025 | % difference, Q1 25 to Q1 26 |
|---|---|---|---|---|
| 1 | New Jersey | $9,733 | $9,346 | 4.1% |
| 2 | Connecticut | $9,645 | $9,172 | 5.2% |
| 3 | District of Columbia | $9,511 | $8,843 | 7.6% |
| 4 | California | $9,421 | $9,088 | 3.7% |
| 5 | Hawaii | $9,334 | $8,854 | 5.4% |
| 6 | Colorado | $9,319 | $8,597 | 8.4% |
| 7 | Maryland | $9,219 | $9,227 | -0.1% |
| 8 | Florida | $9,153 | $8,991 | 1.8% |
| 9 | Massachusetts | $8,888 | $9,124 | -2.6% |
| 10 | New York | $8,847 | $8,715 | 1.5% |
| 11 | New Hampshire | $8,589 | $8,374 | 2.6% |
| 12 | Alaska | $8,588 | $8,879 | -3.3% |
| 13 | Rhode Island | $8,451 | $8,243 | 2.5% |
| 14 | Nevada | $8,404 | $7,774 | 8.1% |
| 15 | Texas | $8,369 | $8,033 | 4.2% |
| 16 | Virginia | $8,298 | $8,129 | 2.1% |
| 17 | Washington | $8,258 | $8,043 | 2.7% |
| 18 | Georgia | $8,197 | $7,909 | 3.6% |
| 19 | Delaware | $8,163 | $7,697 | 6.1% |
| 20 | Illinois | $8,075 | $7,898 | 2.2% |
| 21 | Arizona | $7,963 | $7,991 | -0.4% |
| 22 | Vermont | $7,559 | $7,381 | 2.4% |
| 23 | Utah | $7,534 | $7,394 | 1.9% |
| 24 | Maine | $7,421 | $7,114 | 4.3% |
| 25 | Oregon | $7,392 | $7,450 | -0.8% |
| 26 | Minnesota | $7,177 | $7,147 | 0.4% |
| 27 | North Carolina | $7,130 | $7,048 | 1.2% |
| 28 | Idaho | $7,070 | $6,974 | 1.4% |
| 29 | Montana | $6,914 | $7,107 | -2.7% |
| 30 | South Dakota | $6,889 | $6,465 | 6.6% |
| 31 | South Carolina | $6,812 | $6,976 | -2.4% |
| 32 | Nebraska | $6,791 | $6,420 | 5.8% |
| 33 | Pennsylvania | $6,782 | $6,904 | -1.8% |
| 34 | Kansas | $6,691 | $6,617 | 1.1% |
| 35 | Wyoming | $6,636 | $6,579 | 0.9% |
| 36 | Ohio | $6,417 | $6,335 | 1.3% |
| 37 | North Dakota | $6,384 | $6,461 | -1.2% |
| 38 | Michigan | $6,376 | $6,967 | -8.5% |
| 39 | Missouri | $6,285 | $6,091 | 3.2% |
| 40 | Oklahoma | $6,224 | $6,391 | -2.6% |
| 41 | Iowa | $6,128 | $6,193 | -1.0% |
| 42 | Wisconsin | $5,980 | $6,096 | -1.9% |
| 43 | Indiana | $5,894 | $6,130 | -3.8% |
| 44 | New Mexico | $5,862 | $6,627 | -11.5% |
| 45 | Alabama | $5,729 | $5,685 | 0.8% |
| 46 | Arkansas | $5,704 | $5,194 | 9.8% |
| 47 | Tennessee | $5,539 | $5,624 | -1.5% |
| 48 | Kentucky | $5,297 | $5,214 | 1.6% |
| 49 | Louisiana | $5,266 | $5,300 | -0.6% |
| 50 | Mississippi | $5,005 | $5,187 | -3.5% |
| 51 | West Virginia | $4,847 | $5,700 | -15.0% |
LendingTree analysts reviewed anonymized credit report data from Q1 2026 for more than 400,000 LendingTree users to calculate these averages and rank states by debt. The analysis also used Q1 2025 data from more than 400,000 reports for comparison.
Overall, the national average card debt among Americans with any type of debt in Q1 2026 was $7,756, up 1.9% from $7,615 in Q1 2025. That includes debt from bank cards and retail credit cards.
Eight states had average balances of at least $9,000. New Jersey led at $9,733, ahead of Connecticut ($9,645), the District of Columbia ($9,511) and California ($9,421).
The seven states with the lowest balances are in the South. West Virginia’s average was $4,847, lower than Mississippi ($5,005), Louisiana ($5,266) and Kentucky ($5,297).
Arkansas had the fastest-growing card debt over the period analyzed. Its average card balance grew 9.8% from Q1 2025 to Q1 2026, rising from $5,194 to $5,704. Colorado (up 8.4% to $9,319) and Nevada (up 8.1% to $8,404) followed.
Meanwhile, West Virginia saw the largest year-over-year decrease in debt, with its residents’ average balance falling 15.0% from $5,700 to $4,847. New Mexico was the only other state with a double-digit decrease, down 11.5%, from $6,627 to $5,862. In all, 19 states saw credit card balances decrease over the past year. Michigan (down 8.5%) was the only other state to see a decrease of at least 4.0%.
What percentage of credit cardholders carry a balance?
Fewer than half of adult credit cardholders (45%) carried a balance for at least one month in the past year, according to a May 2026 Federal Reserve study using 2025 data.
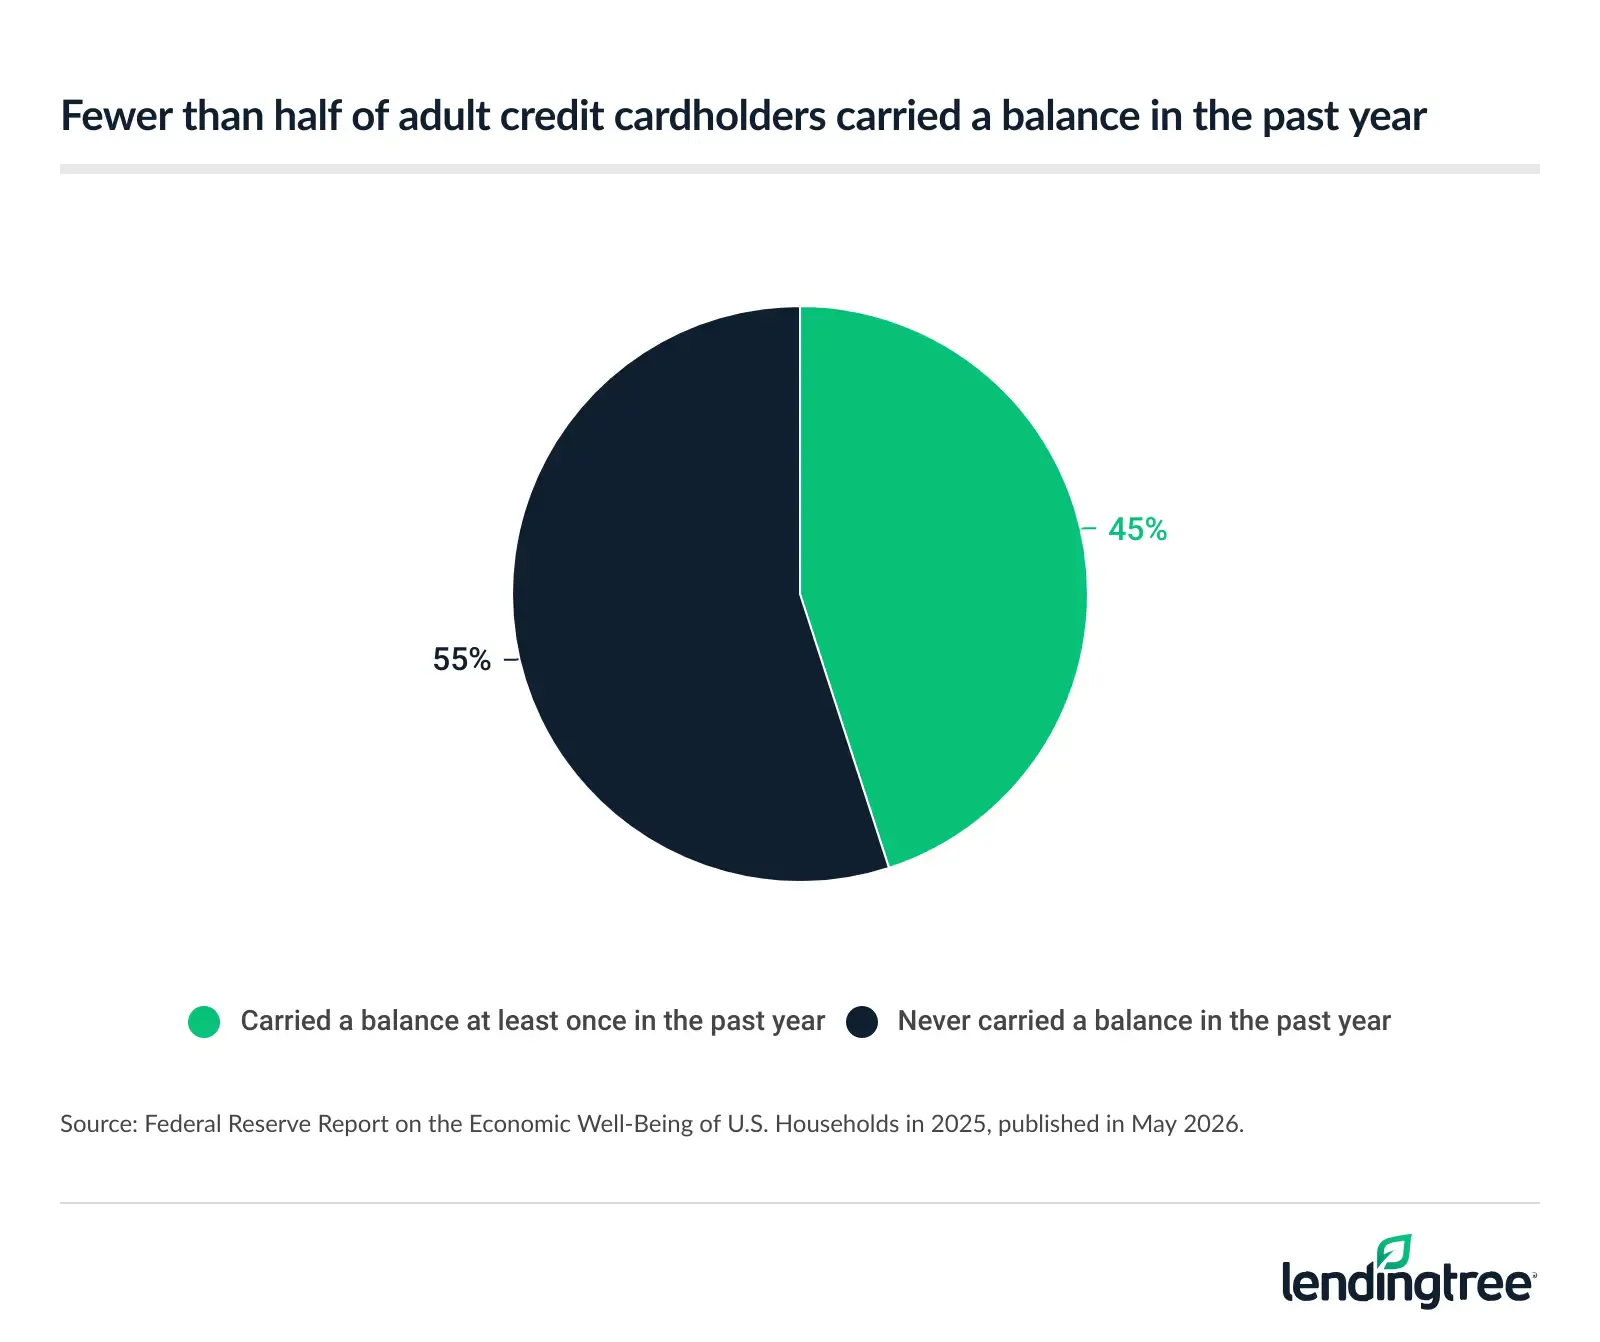
Paying a credit card balance in full each month is the most effective way to avoid interest charges and keep debt from accumulating. However, many consumers carry balances at least occasionally because of unexpected expenses, income disruptions or other financial pressures.
What’s the average interest rate on people’s credit cards? What about those who carry a balance? What about new credit card offers?
For all credit cards, the average APR in Q3 2026 was 21.19%.
For cards accruing interest, the average in Q3 2026 was 22.36%.
For new credit card offers, the average is 23.96%.
- Average APR, current card accounts: 21.19%
- Average APR, accounts that accrue interest: 22.36%
- Average APR, new credit card offers: 23.96%
The Federal Reserve’s G.19 consumer credit report showed that the average APR for cards accruing interest rose to 22.36% in Q3 2026, up from 22.15% in Q2 2026. Meanwhile, the average APR for all current credit card accounts climbed to 21.19% in Q3 2026, up from 20.94% in Q2 2026.
Consumers opening a new credit card account may face higher rates than the averages for existing accounts. The latest LendingTree data on credit card APRs shows that the average APR on a new credit card offer is 23.96%, with the average card offering an APR range of 20.32% to 27.59%. Actual rates vary based on factors including creditworthiness.
The average APR for new credit card offers rose for the third straight month and the fourth time in the past six months. (It had been unchanged in June and July.) The increase follows the Fed’s quarter-point rate hike in September, and rates could rise further if the Fed raises its benchmark rate again in the coming months.
That would be bad news for those with card debt. When the Fed raises or lowers rates, most credit card APRs in the U.S. move in the same direction by the same amount over the following few months. A Fed rate hike would likely lead to rising credit card interest rates heading into the holiday shopping season, an unwelcome change for Americans already contending with inflation and high interest rates.
Regardless of when the Fed acts next, consumers should expect credit card APRs to remain elevated by historical standards for the foreseeable future.
As the chart below shows, APRs can vary significantly by card type.
Average APRs by category
| Category | Min. APR | Max. APR | Avg. | Prior month |
|---|---|---|---|---|
| Avg. APR for all new credit card offers | 20.32% | 27.59% | 23.96% | 23.82% |
| 0% balance transfer credit cards | 17.73% | 26.99% | 22.36% | 22.18% |
| No-annual-fee credit cards | 19.71% | 27.12% | 23.41% | 23.30% |
| Rewards credit cards | 20.03% | 27.72% | 23.88% | 23.73% |
| Cash back credit cards | 20.42% | 27.64% | 24.03% | 23.84% |
| Travel rewards credit cards | 19.63% | 28.26% | 23.95% | 23.72% |
| Airline credit cards | 19.68% | 28.88% | 24.28% | 24.03% |
| Hotel credit cards | 19.64% | 28.61% | 24.12% | 23.89% |
| Low-interest credit cards | 12.75% | 19.11% | 15.93% | 16.41% |
| Grocery rewards credit cards | 19.91% | 27.89% | 23.90% | 23.83% |
| Gas rewards credit cards | 20.50% | 27.64% | 24.07% | 24.00% |
| Dining rewards credit cards | 19.54% | 27.92% | 23.73% | 23.49% |
| Student credit cards | 17.74% | 27.34% | 22.54% | 22.29% |
| Secured credit cards | 26.29% | 26.29% | 26.29% | 26.15% |
The most effective way to avoid credit card interest charges is to pay your card debt in full each month, but that’s often easier said than done.

How many Americans are currently delinquent with their credit card payments?
Just 2.85% of Americans’ outstanding credit card balances were at least 30 days delinquent in the second quarter of 2026.
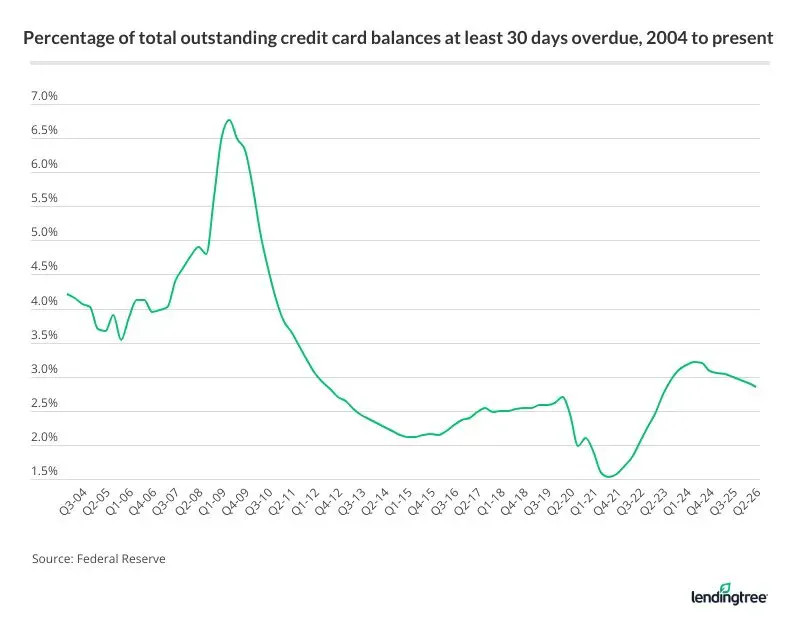
According to the most recent delinquency data from the Fed, the 30-day delinquency rate — the share of outstanding credit card balances that were at least 30 days past due — dipped to 2.85% in the second quarter of 2026, the eighth straight quarterly decrease.
Those declines followed a stretch of 11 consecutive quarterly increases, during which the delinquency rate climbed to its highest level since Q4 2011. However, delinquency rates are still below historic averages. The average delinquency rate since the Fed began tracking the data in 1991 is 3.69%, while the average since 2000 is 3.42%.
Current delinquency rates also remain well below Great Recession levels, when they peaked at nearly 7% in 2009 and stayed above 5% for almost two years.