Back-to-School Shopping Defies Inflation: Families Spend Nearly the Same as Before the Pandemic


A LendingTree analysis finds that families’ back-to-school spending has changed little over the past six years, despite broad price increases across the economy.
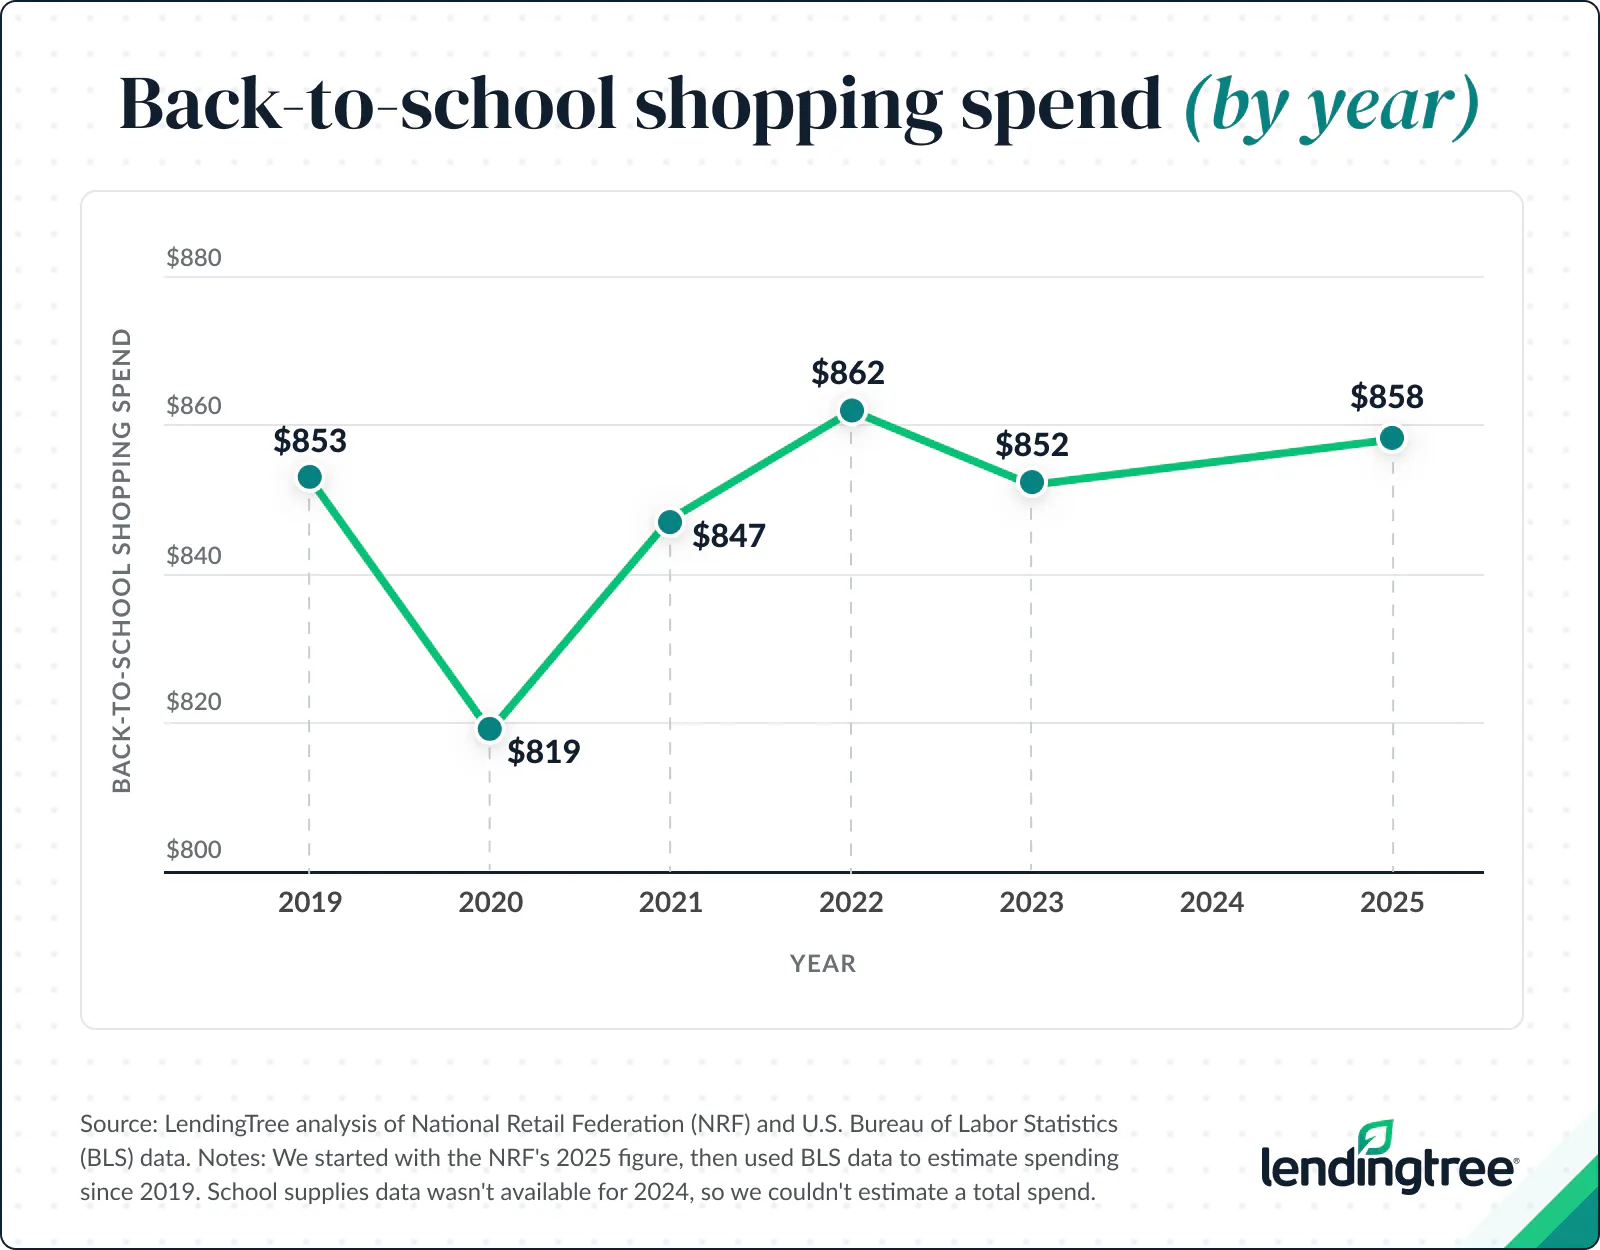
Families with children in elementary through high school spent $858 in 2025 on electronics, clothing/accessories, shoes and school supplies, up 0.6% from an estimated $853 in 2019.
Here’s a closer look at the data.
- K-12 back-to-school spending has remained largely unchanged from prepandemic levels. Families spent $858 on electronics, clothing/accessories, shoes and school supplies in 2025, up just 0.6% from an estimated $853 in 2019. Over the same period, inflation rose 26.3%.
- Lower electronics spending appears to be the main reason overall K-12 back-to-school spending has remained flat. Estimated spending on electronics fell from $338 in 2019 to $296 in 2025, while spending on clothing/accessories, shoes and school supplies increased. Prices for electronics commonly purchased for school — such as calculators and Chromebooks — have fallen 12.5% since 2019.
- Mississippi households face the highest back-to-school shopping burden. Households in the state are expected to spend an estimated 16.8% of their monthly income on back-to-school purchases. West Virginia (16.3%) and Louisiana (15.8%) rank second and third, respectively. Nationally, U.S. households are expected to spend 12.6% of their monthly income on school shopping.
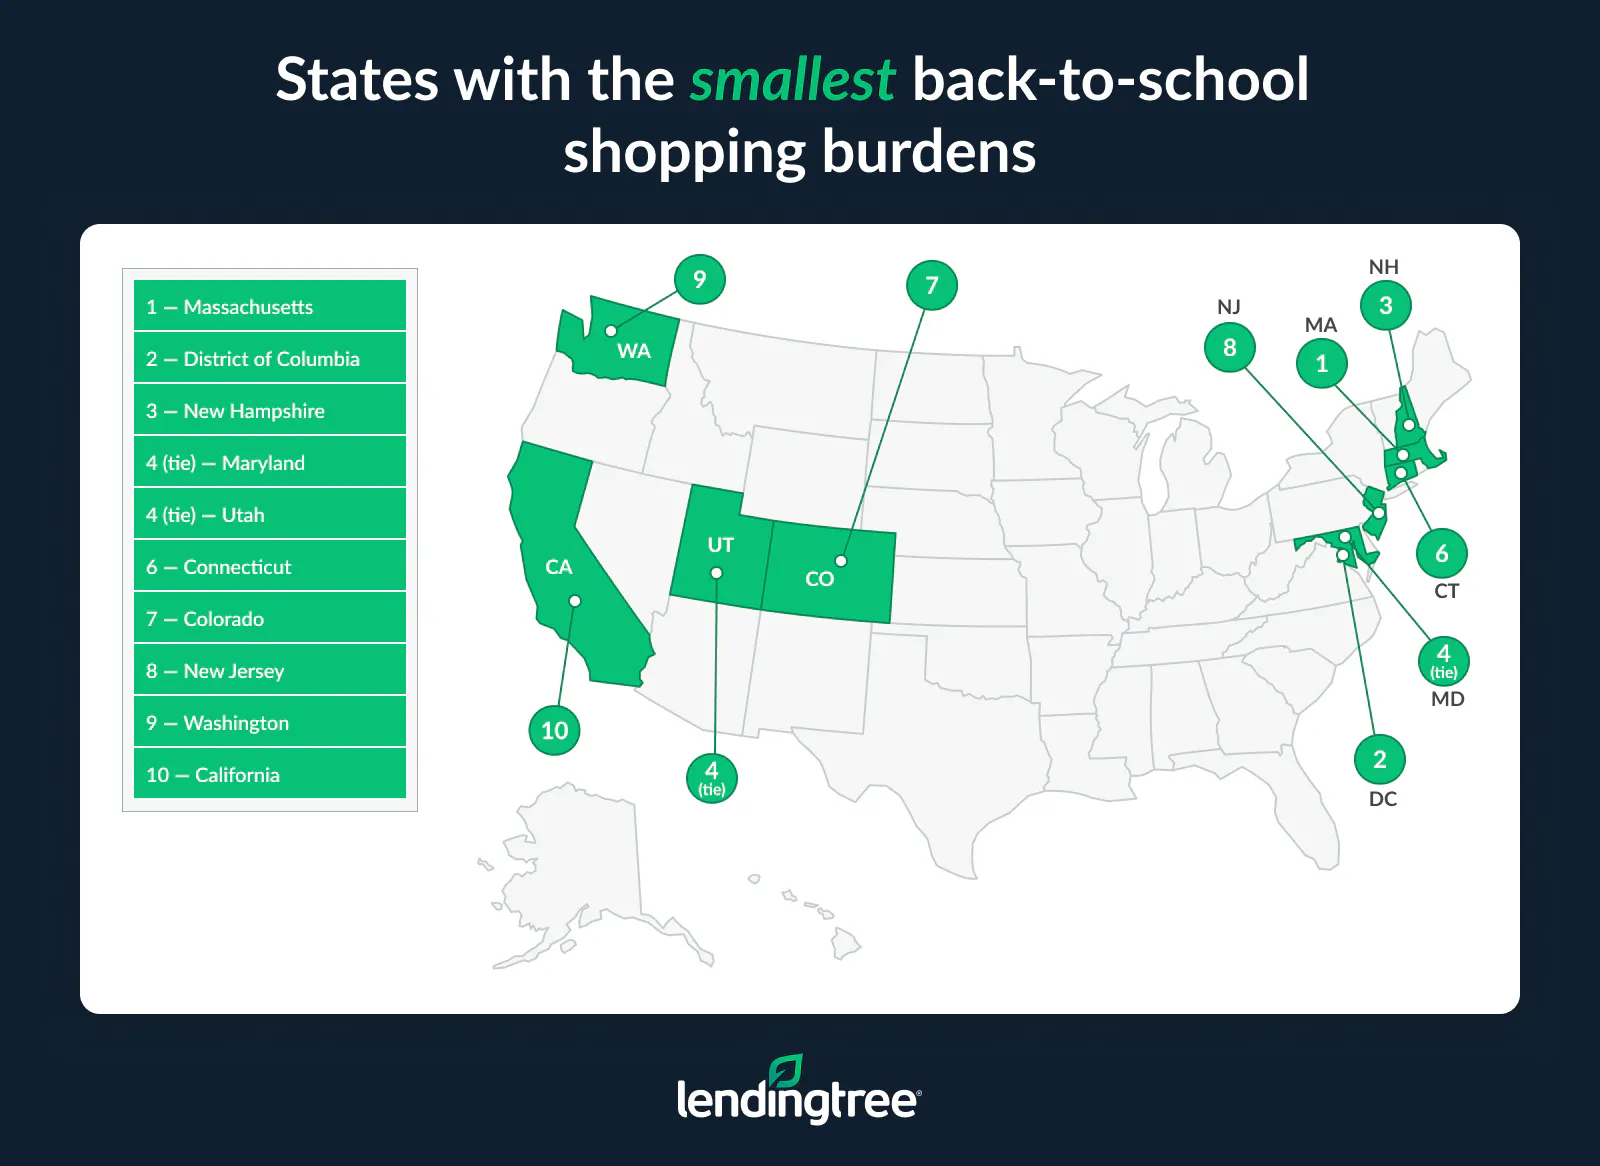
- Massachusetts is the most affordable state for back-to-school shopping. A basket of back-to-school items represents 9.7% of monthly household income there. The District of Columbia (10.0%) and New Hampshire (10.2%) rank next.
K-12 back-to-school spending has changed little since 2019
Families with K-12 students spent $858 on electronics, clothing/accessories, shoes and school supplies in 2025, according to the National Retail Federation. That’s just 0.6% higher than an estimated $853 in 2019, a figure LendingTree calculated using U.S. Bureau of Labor Statistics (BLS) consumer price index (CPI) data from August of the respective years. (See the methodology for details.) The increase is modest considering inflation rose 26.3% between August 2019 and August 2025, indicating that overall back-to-school spending has remained essentially flat.
Matt Schulz, LendingTree chief consumer finance analyst and author of “Ask Questions, Save Money, Make More: How to Take Control of Your Financial Life,” says the trend may reflect a K-shaped economy, in which households’ financial circumstances are diverging.
“People who are doing well financially are spending more, while those who aren’t are pulling back,” he says. “Taken together, that results in spending that’s slightly higher but largely unchanged. Consumers who are struggling are becoming more price-conscious and looking for ways to reduce costs, but persistent inflation limits how much they can save.”
Lower electronics spending is the main reason overall costs have stayed flat
Electronics spending is the biggest reason total back-to-school costs haven’t risen more. LendingTree estimates spending in the category fell from $338 in 2019 to $296 in 2025, while spending on clothing/accessories, shoes and school supplies increased. (As with the overall estimate, LendingTree started with the NRF’s 2025 figures for each category and used BLS data to estimate 2019 spending.)
Prices for electronics commonly purchased for school, like calculators and Chromebooks, have fallen 12.5% since 2019. By contrast, school supplies are up 9.9%, while clothing/accessories and shoes are up 6.8% and 6.7%, respectively.
Schulz says several factors are driving the trend.
“The decline in electronics spending is likely being driven by a combination of lower prices and longer replacement cycles,” he says. “Prices for many school-related electronics have fallen because of competition and improved supply chains, but families are also holding on to devices longer as they manage higher costs elsewhere in their budgets. While electronics have historically become more affordable over time, future savings will depend on tariffs, supply chain conditions and how long consumers can continue delaying upgrades.”
Mississippi households face the nation’s highest back-to-school shopping burden
Nationally, U.S. households are expected to spend an estimated 12.6% of their monthly income on back-to-school shopping. (LendingTree adjusted the national basket cost using U.S. Bureau of Economic Analysis — BEA — regional price parities, or RPPs.)
In Mississippi, that share rises to 16.8% — the highest of any state. Households in the state are expected to spend an estimated $826 on back-to-school supplies, while monthly household income in Mississippi is $4,927 — the lowest among the states.
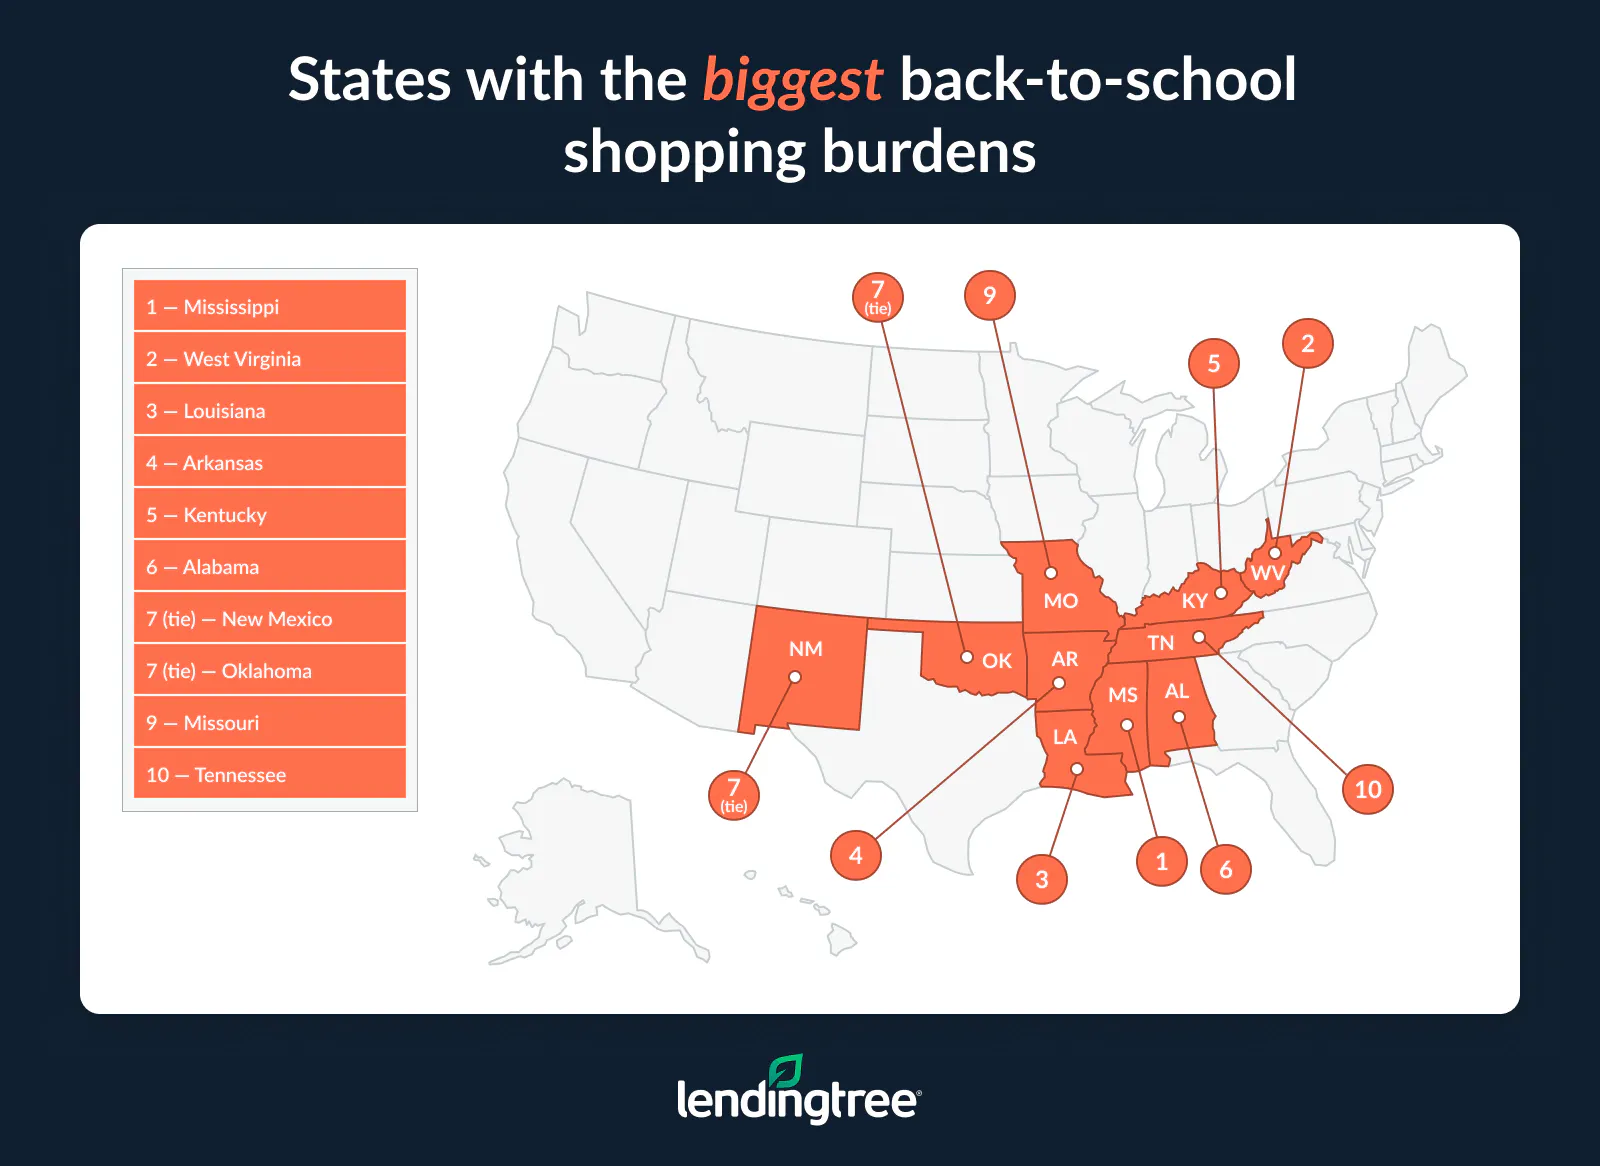
West Virginia (16.3%) and Louisiana (15.8%) rank second and third, respectively.
Schulz says income is the primary factor behind the disparity. “This is primarily about income,” he says. “Simply put, when household income is low, costs such as back-to-school shopping can become a significant burden. That’s the reality for many Americans, and states such as Mississippi, West Virginia and Louisiana are no exception.”
Massachusetts is the most affordable state for back-to-school shopping
At the other end of the spectrum, a basket of back-to-school items accounts for just 9.7% of monthly household income in Massachusetts. Households in the state are expected to spend $848 on back-to-school supplies, but that cost represents a relatively small share of the state’s monthly household income of $8,736.
The District of Columbia (10.0%) and New Hampshire (10.2%) rank second- and third-lowest, respectively.
As with the states facing the highest shopping burden, Schulz says income is the key factor. “While prices may be higher in Massachusetts, D.C. and other higher-income areas, residents in those locations generally have greater financial capacity to absorb those costs,” he says.
Full rankings: Where back-to-school shopping is most and least burdensome
| Rank | State | Monthly household income | Estimated back-to-school spending | % of income |
|---|---|---|---|---|
| 1 | Mississippi | $4,927 | $826 | 16.8% |
| 2 | West Virginia | $5,067 | $828 | 16.3% |
| 3 | Louisiana | $5,082 | $804 | 15.8% |
| 4 | Arkansas | $5,176 | $803 | 15.5% |
| 5 | Kentucky | $5,377 | $823 | 15.3% |
| 6 | Alabama | $5,555 | $827 | 14.9% |
| 7 | New Mexico | $5,651 | $825 | 14.6% |
| 7 | Oklahoma | $5,512 | $805 | 14.6% |
| 9 | Missouri | $5,966 | $826 | 13.9% |
| 10 | Tennessee | $6,000 | $826 | 13.8% |
| 11 | South Carolina | $6,029 | $827 | 13.7% |
| 11 | Indiana | $5,997 | $820 | 13.7% |
| 11 | Michigan | $6,032 | $824 | 13.7% |
| 14 | North Carolina | $6,163 | $829 | 13.5% |
| 15 | Ohio | $6,018 | $804 | 13.4% |
| 16 | Pennsylvania | $6,462 | $853 | 13.2% |
| 17 | Montana | $6,278 | $824 | 13.1% |
| 17 | Maine | $6,370 | $834 | 13.1% |
| 19 | Wyoming | $6,294 | $818 | 13.0% |
| 19 | Florida | $6,478 | $841 | 13.0% |
| 21 | New York | $7,152 | $920 | 12.9% |
| 22 | Illinois | $6,934 | $891 | 12.8% |
| 22 | Kansas | $6,293 | $807 | 12.8% |
| 22 | South Dakota | $6,407 | $819 | 12.8% |
| 22 | Iowa | $6,292 | $804 | 12.8% |
| 26 | Georgia | $6,666 | $849 | 12.7% |
| 26 | Oregon | $7,102 | $903 | 12.7% |
| 26 | Nebraska | $6,365 | $807 | 12.7% |
| 26 | Texas | $6,643 | $842 | 12.7% |
| 26 | North Dakota | $6,489 | $821 | 12.7% |
| 31 | Wisconsin | $6,457 | $809 | 12.5% |
| 32 | Idaho | $6,764 | $826 | 12.2% |
| 32 | Nevada | $6,761 | $826 | 12.2% |
| 34 | Vermont | $6,894 | $835 | 12.1% |
| 34 | Arizona | $6,791 | $818 | 12.1% |
| 36 | Rhode Island | $6,959 | $834 | 12.0% |
| 37 | Minnesota | $7,260 | $863 | 11.9% |
| 38 | Alaska | $7,972 | $912 | 11.4% |
| 38 | Hawaii | $8,395 | $957 | 11.4% |
| 40 | Delaware | $7,295 | $825 | 11.3% |
| 41 | Virginia | $7,674 | $861 | 11.2% |
| 42 | California | $8,346 | $910 | 10.9% |
| 43 | Washington | $8,282 | $895 | 10.8% |
| 44 | New Jersey | $8,691 | $919 | 10.6% |
| 45 | Colorado | $8,093 | $847 | 10.5% |
| 46 | Connecticut | $8,004 | $835 | 10.4% |
| 47 | Utah | $8,055 | $828 | 10.3% |
| 47 | Maryland | $8,575 | $880 | 10.3% |
| 49 | New Hampshire | $8,315 | $846 | 10.2% |
| 50 | District of Columbia | $9,142 | $914 | 10.0% |
| 51 | Massachusetts | $8,736 | $848 | 9.7% |
Best back-to-school shopping tips for parents on a budget
Back-to-school expenses can add up quickly, from laptops and school supplies to clothing and shoes. Before relying on credit cards, create a spending plan and identify opportunities to reduce costs. Consider the following strategies:
- Set a realistic budget before you shop. Create a list of essential items, compare prices and take advantage of discounts and sales when available. If you need help covering larger education-related expenses, compare borrowing options and rates before taking on debt.
- Avoid carrying high-interest credit card balances. Using a credit card for school purchases may be convenient, but carrying a balance can significantly increase costs over time. If existing debt is already straining your budget, look for ways to reduce balances and better manage monthly payments.
- Plan ahead for recurring expenses, even if they occur only once or twice a year. “Back-to-school shopping, holidays, summer camps and annual insurance premiums shouldn’t be surprises, so it’s worth setting aside a little money each month and letting it grow in an online high-yield savings account (HYSA),” Schulz says. “HYSAs typically offer significantly higher yields than traditional savings accounts at large banks. If you don’t already have one, it can be worthwhile to compare options and find an account that fits your needs.”
Methodology
LendingTree analyzed changes in back-to-school costs since 2019 and the affordability of those purchases for families across the U.S.
The analysis began with the National Retail Federation (NRF) 2025 K-12 back-to-school spending estimates. The NRF reported that families with children in elementary through high school planned to spend an average of $858.07 across four categories: $295.81 on electronics, $249.36 on clothing/accessories, $169.13 on shoes and $143.77 on school supplies.
LendingTree used those spending categories and amounts to create a weighted basket of goods. For example, electronics account for 34.5% of the basket because $295.81 represents 34.5% of the total $858.07.
To estimate price changes over time, LendingTree used U.S. Bureau of Labor Statistics (BLS) consumer price index (CPI) data, mapping each NRF category to a corresponding CPI proxy and estimating the cost of the same basket over time. For each category, LendingTree compared August 2025 with August 2019 to align the analysis with the back-to-school shopping season.
For the state affordability analysis, LendingTree adjusted the national basket cost using U.S. Bureau of Economic Analysis (BEA) goods regional price parities (RPPs). The adjusted cost was then compared with monthly household income in each state.
States were ranked from highest to lowest based on the percentage of one month’s median household income required to purchase the BEA goods RPP-adjusted back-to-school basket.
Income data comes from the U.S. Census Bureau’s 2024 American Community Survey.
Get debt consolidation loan offers from up to 5 lenders in minutes
Recommended Articles
Most Back-to-School Shoppers Feel Stressed and Expect to Spend More, While Nearly 1 in 3 Say They Can’t Afford It This Year
Back-to-School Shoppers Plan to Spend an Average of $700, and 68% Are Stressed About Paying for It
75% of Parents Stressed About Paying for Back-to-School Shopping, Up 12% From Last Year