Older Homeowners Could Pass Down $17.2 Trillion by 2045 as Inheritance Conversations Lag


Over the next two decades, the transfer of generational wealth is set to accelerate in the U.S. This LendingTree study estimates that homeowners ages 65 and older could pass down roughly $17.2 trillion between 2026 and 2045 — an average of $859 billion a year.
That wealth transfer may not be so straightforward, though. A separate survey of 1,585 U.S. consumers indicates that expectations don’t always match reality, and many families still haven’t had necessary conversations about inheritance.
Here’s a closer look.
To estimate the scale and timing of this wealth transfer, we built a model using several key assumptions:
- Wealth multiplier (4.5): The ratio of mean total net worth to mean gross primary home value, based on the Federal Reserve’s 2022 Survey of Consumer Finances, used to convert home values into a broader estimate of total household net worth.
- Heir share (65%): The portion of wealth typically transferred to heirs after accounting for long-term care costs, taxes and other drawdowns, per Cerulli Associates 2023 research.
- Mortality rates by age group: Annual probability of death, based on the Social Security Administration’s 2023 Period Life Tables. These were 1.4% for householders ages 65 to 74, 4.5% for householders ages 75 to 84 and 13.0% for householders ages 85 and older.
- Model horizon (20 years): These mortality probabilities were applied across the period from 2026 to 2045 to project how much wealth could be transferred each year as older homeowners die.
- Homeowners 65 and older could transfer approximately $17.2 trillion between 2026 and 2045. Over the 20-year period, an average of $859 billion could be transferred per year.
- California alone could account for nearly $1 in every $5 transferred. The state’s estimated $3.4 trillion transfer represents 19.8% of the national total. That’s more than the combined projected transfers for Florida ($1.6 trillion) and New York ($1.2 trillion).
- Hawaii has the highest modeled transferable wealth per older homeowner household. Hawaii’s older homeowner households have $3.1 million in modeled transferable wealth per household. California follows at $2.9 million, while the District of Columbia ranks third at $2.8 million.
- Overall, 33% of Americans younger than 65 expect to receive an inheritance or financial gift in the future. That share rises to 53% among those who are younger than 65 and earning $100,000 or more. However, just 43% of Americans age 65 or older plan to give an inheritance or financial gift.
- Expectations of future wealth transfers are influencing retirement strategies for many prospective heirs. Among those who expect to receive an inheritance or financial gift, 43% say their retirement planning depends a great deal on that expected transfer. Only 25% of those who expect an inheritance or financial gift say the possibility of receiving it hasn’t affected their retirement planning.
- Conversations around wealth transfers are lagging. While many Americans expect to rely on an inheritance or financial gift for their retirement, just 57% of Americans expecting an inheritance or financial gift report having clearly discussed those expectations with the person from whom they expect to receive it. Meanwhile, 16% of those expecting an inheritance haven’t discussed it at all with the expected giver. Homeowners 65 and older could transfer $17.2 trillion by 2045.
Homeowners 65 and older could transfer $17.2 trillion by 2045
In total, homeowners 65 and older could transfer approximately $17.2 trillion in wealth between 2026 and 2045, or an average of $859 billion a year over those 20 years.
The largest wealth transfers are concentrated in the earliest years, peaking at $1.4 trillion in 2026 and staying in the trillions through 2031. Wealth transfers decline by year, reaching their lowest level in 2045 at a still-significant $528 billion.
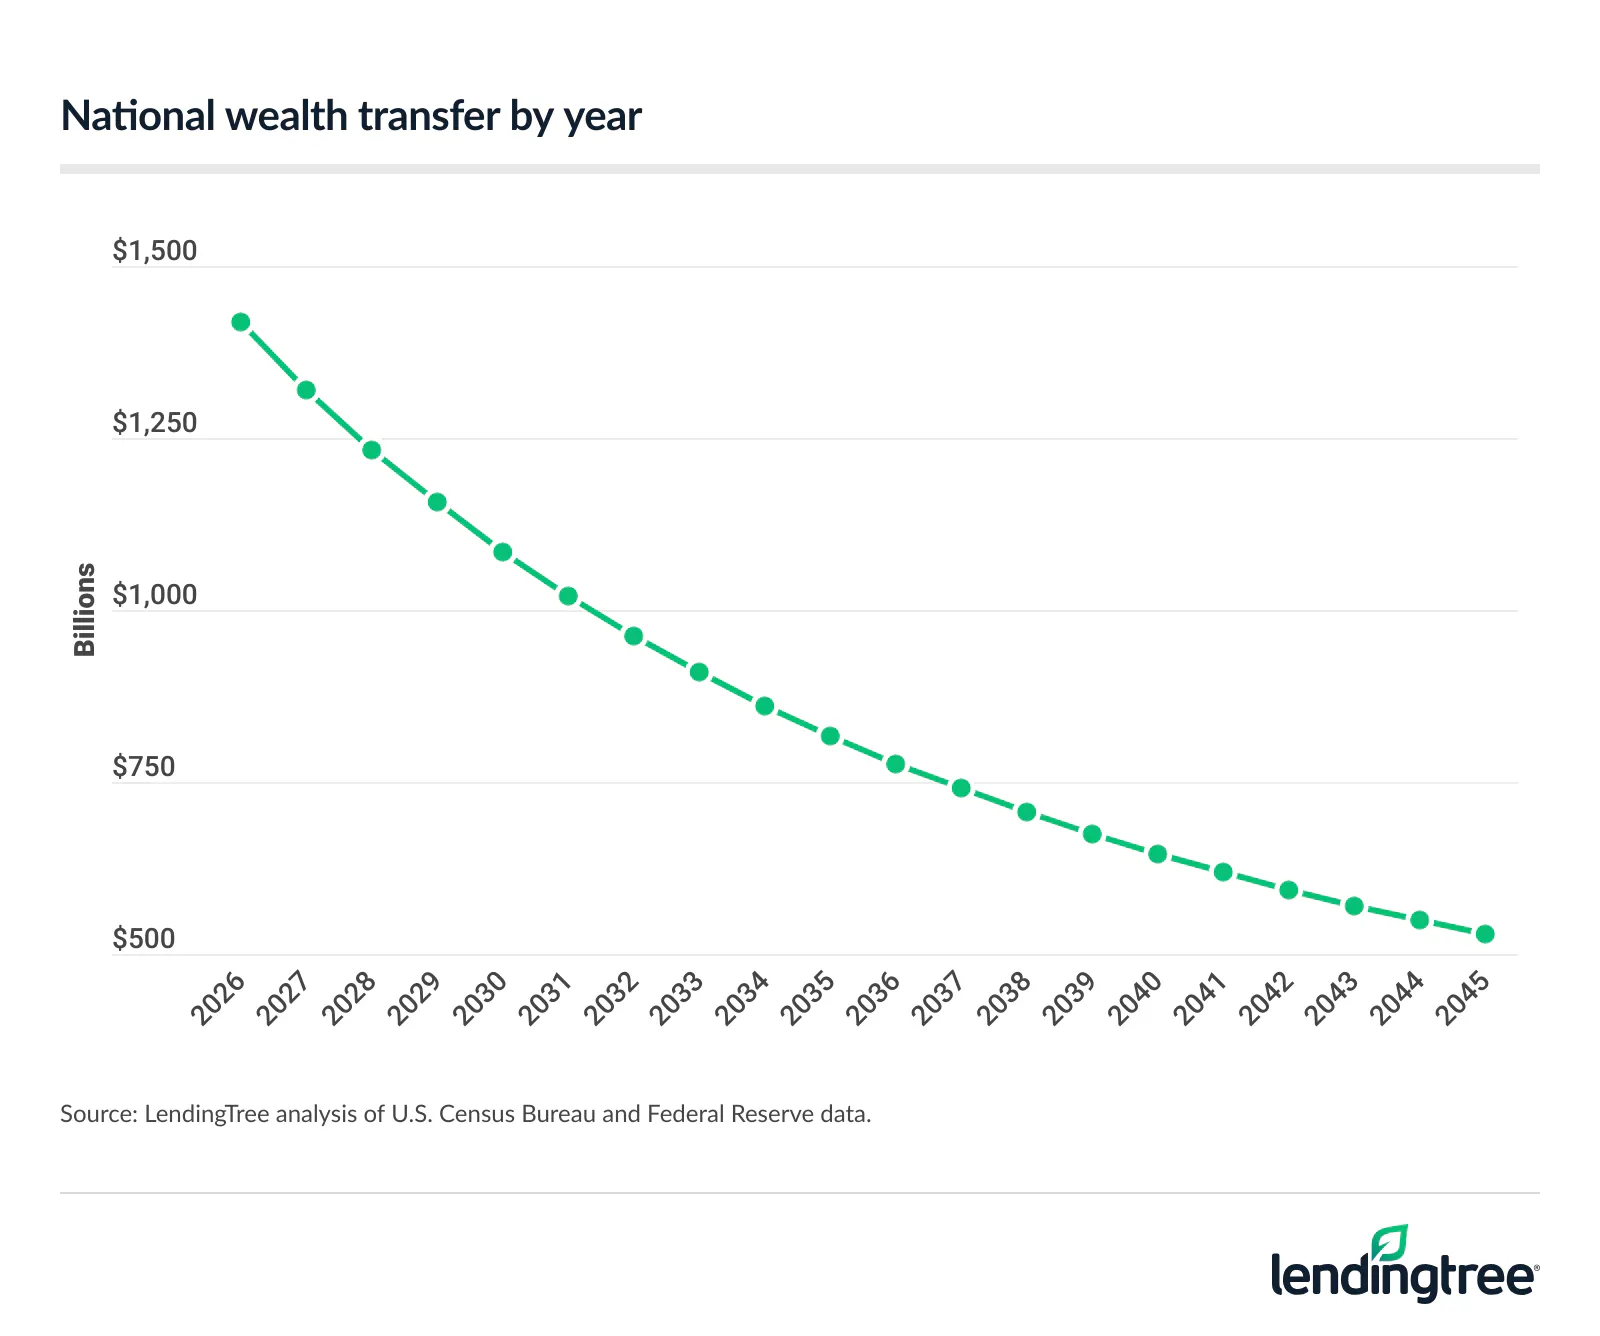
National wealth transfer by year
| Calendar year | Estimated wealth transfer |
|---|---|
| 2026 | $1.4 trillion |
| 2027 | $1.3 trillion |
| 2028 | $1.2 trillion |
| 2029 | $1.2 trillion |
| 2030 | $1.1 trillion |
| 2031 | $1.0 trillion |
| 2032 | $962 billion |
| 2033 | $910 billion |
| 2034 | $861 billion |
| 2035 | $817 billion |
| 2036 | $777 billion |
| 2037 | $740 billion |
| 2038 | $706 billion |
| 2039 | $674 billion |
| 2040 | $645 billion |
| 2041 | $618 billion |
| 2042 | $593 billion |
| 2043 | $570 billion |
| 2044 | $548 billion |
| 2045 | $528 billion |
Matt Schulz, LendingTree chief consumer finance analyst and author of “Ask Questions, Save Money, Make More: How to Take Control of Your Financial Life,” says this massive transfer is a big deal.
“For many families, an inheritance or financial gift could make milestones like buying a home, starting a business, paying off debt or retiring more securely much more possible,” he says. “It can be nothing short of life-changing. The biggest opportunity is that inherited wealth can provide financial flexibility at critical moments in life.”
There are also risks to this magnitude of wealth transfer, though, Schulz says.
“The biggest risk is that wealth transfers aren’t spread evenly,” he says. “Many wealthy families will become even wealthier, while those without inherited wealth may find it increasingly difficult to build their own. The inequality that we see today in our country might just get worse.”
California could account for nearly $1 of every $5 transferred
California alone is projected to account for nearly $1 in every $5 transferred nationally. The state’s estimated $3.4 trillion in transferable wealth over the 20-year period represents 19.8% of the national total. That’s more than the combined projected transfers for the next-highest ranking states, Florida ($1.6 trillion) and New York ($1.2 trillion).
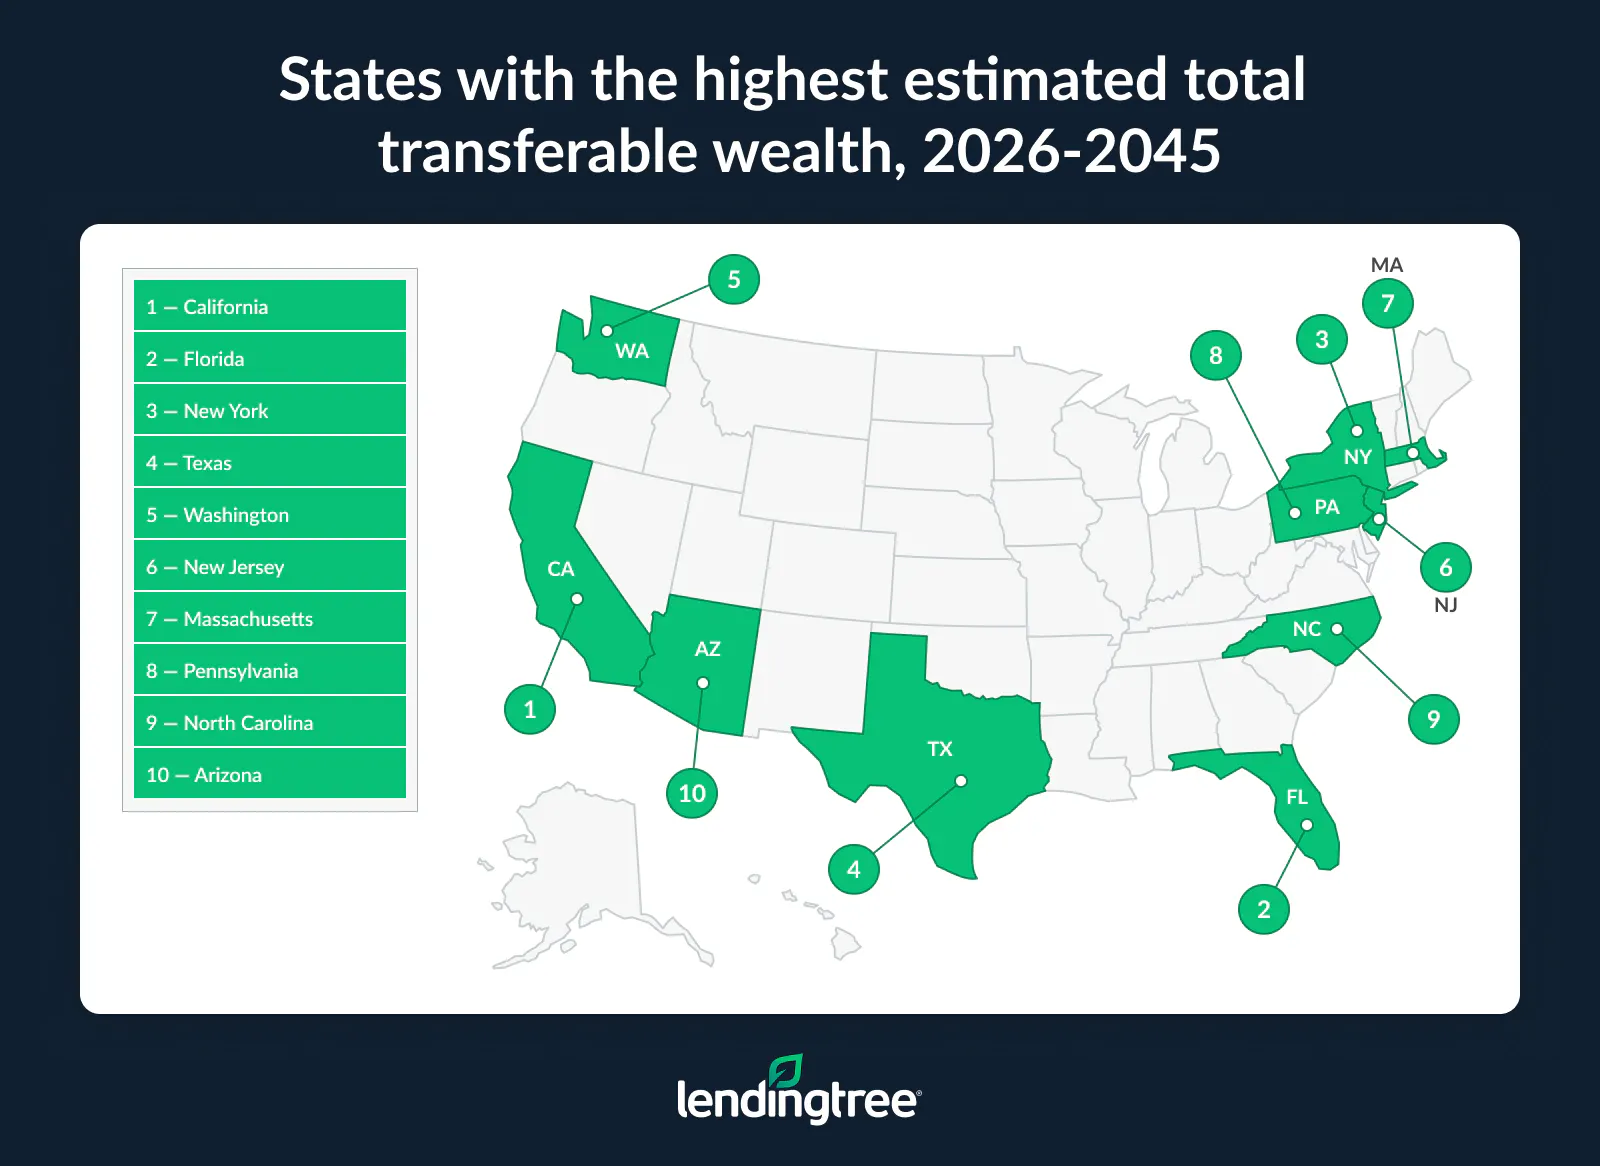
Schulz points to the scale of California’s economy as the driving factor here.
“California itself would be one of the world’s largest economies,” he says. “We tend to think of California in terms of technology and entertainment, but it’s also a power in manufacturing, agriculture, trade and other industries. That massive diversified economy has created staggering amounts of wealth.”
On the flipside, it has also led to challenges, which will likely only continue to compound as that wealth is transferred, Schulz says. “That extreme concentration of wealth has led to an affordability crisis that may only be made worse when all of those fortunes are passed down. We’ve already seen many families leaving the state for more affordable locales, and that seems unlikely to stop anytime soon.”
Hawaii has the highest transferable wealth per household
While California leads in total dollars projected to be transferred, Hawaii tops the list on a per-household basis. Hawaii’s older homeowner households have a modeled $3.1 million in transferable wealth per household.
California ($2.9 million) and the District of Columbia ($2.8 million) are next in the ranking.
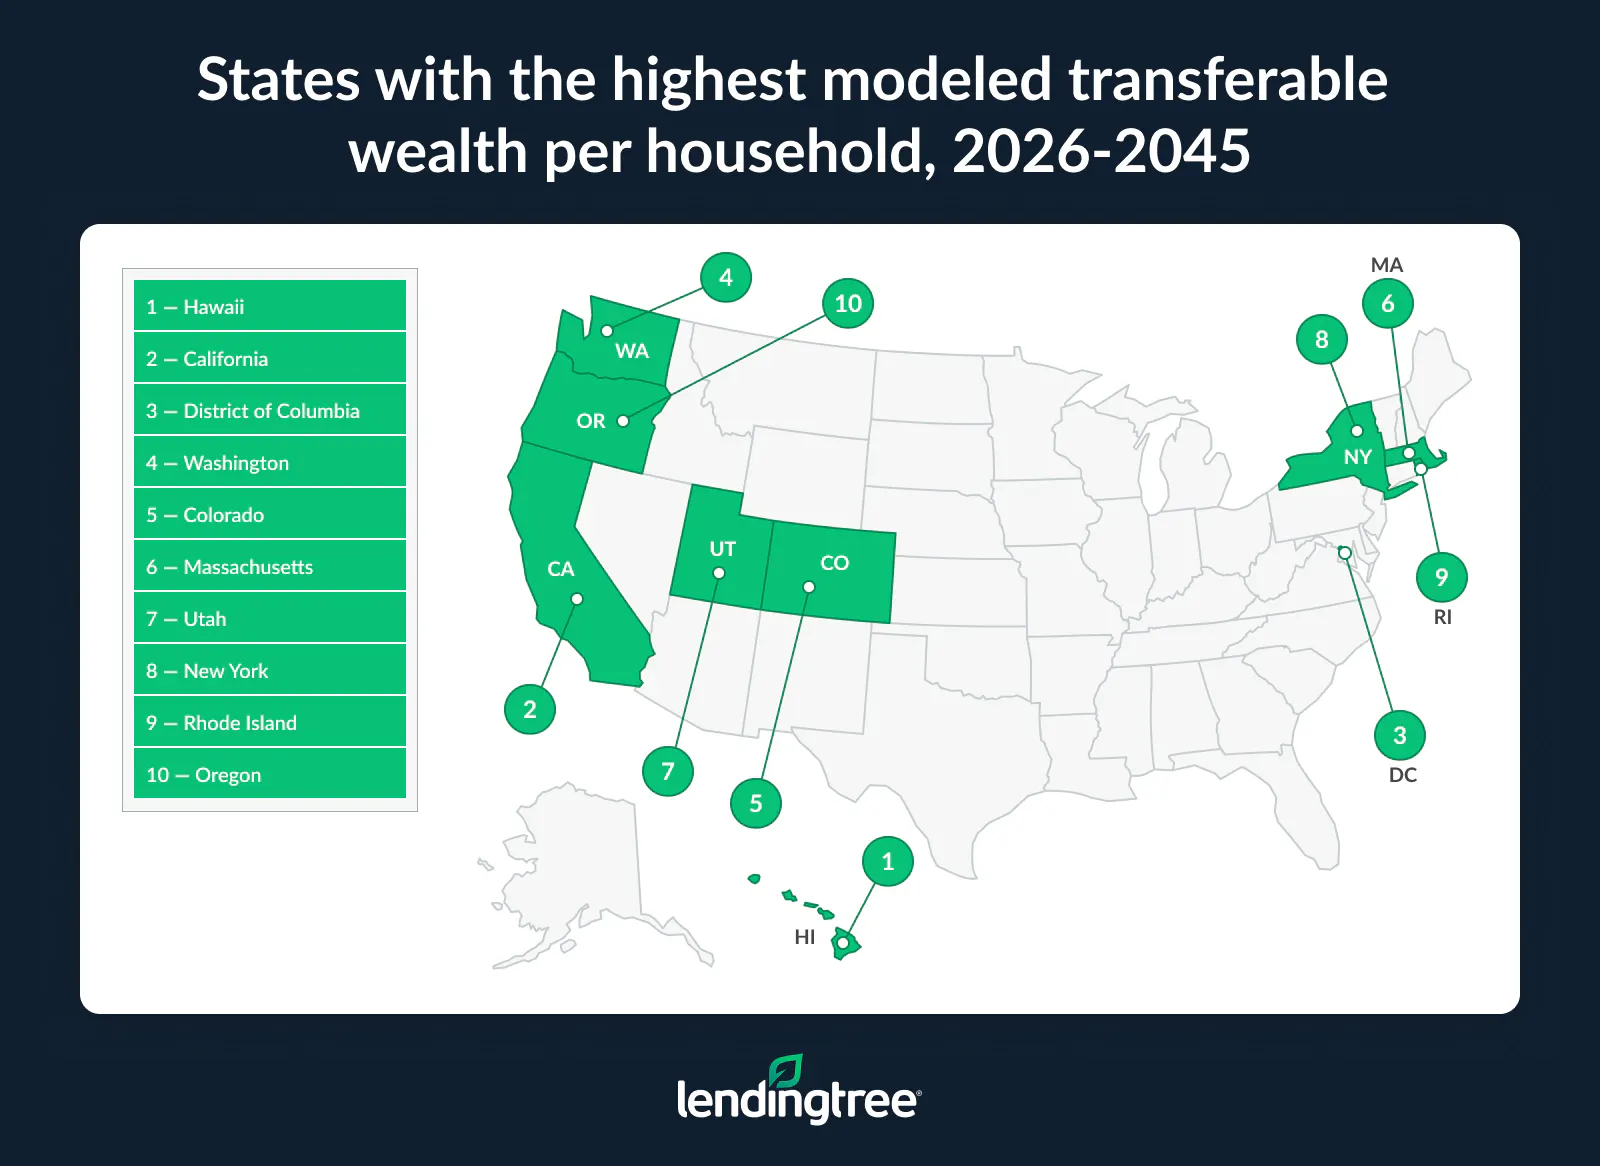
On the other end of the list, West Virginia has the lowest modeled per-household wealth to be transferred, at just $592,374 per household. Mississippi ($622,367) and Arkansas ($691,660) follow.
Full rankings: How much wealth older homeowners will pass on by state
| Rank | State | Total homeowners 65 and older | Mean value of homes | Transferable wealth per household | Total estimated transfer over 20 years | Avg. annual transfer |
|---|---|---|---|---|---|---|
| 1 | California | 2,723,823 | $981,746 | $2.9 million | $3.4 trillion | $171 billion |
| 2 | Florida | 2,502,458 | $503,699 | $1.5 million | $1.7 trillion | $82 billion |
| 3 | New York | 1,534,418 | $588,698 | $1.7 million | $1.2 trillion | $58 billion |
| 4 | Texas | 2,071,359 | $359,860 | $1.1 million | $908 billion | $45 billion |
| 5 | Washington | 660,384 | $685,089 | $2.0 million | $546 billion | $27 billion |
| 6 | New Jersey | 772,202 | $530,058 | $1.6 million | $518 billion | $26 billion |
| 7 | Massachusetts | 601,743 | $680,744 | $2.0 million | $517 billion | $26 billion |
| 8 | Pennsylvania | 1,311,060 | $311,736 | $911,828 | $508 billion | $25 billion |
| 9 | North Carolina | 1,008,177 | $372,919 | $1.1 million | $467 billion | $23 billion |
| 10 | Arizona | 760,938 | $470,916 | $1.4 million | $453 billion | $23 billion |
| 11 | Illinois | 1,142,949 | $311,831 | $912,106 | $452 billion | $23 billion |
| 12 | Virginia | 768,139 | $459,158 | $1.3 million | $441 billion | $22 billion |
| 13 | Colorado | 491,905 | $683,677 | $2.0 million | $404 billion | $20 billion |
| 14 | Georgia | 862,147 | $373,633 | $1.1 million | $392 billion | $20 billion |
| 15 | Michigan | 1,048,201 | $289,447 | $846,632 | $379 billion | $19 billion |
| 16 | Ohio | 1,149,505 | $262,122 | $766,707 | $377 billion | $19 billion |
| 17 | Maryland | 525,534 | $484,874 | $1.4 million | $315 billion | $16 billion |
| 18 | Tennessee | 658,032 | $379,340 | $1.1 million | $311 billion | $16 billion |
| 19 | Oregon | 405,630 | $543,719 | $1.6 million | $271 billion | $14 billion |
| 20 | South Carolina | 567,352 | $382,184 | $1.1 million | $269 billion | $13 billion |
| 21 | Minnesota | 522,925 | $362,454 | $1.1 million | $231 billion | $12 billion |
| 22 | Wisconsin | 575,738 | $326,499 | $955,010 | $229 billion | $11 billion |
| 23 | Connecticut | 333,738 | $511,966 | $1.5 million | $219 billion | $11 billion |
| 24 | Indiana | 636,660 | $259,147 | $758,005 | $205 billion | $10 billion |
| 25 | Missouri | 593,617 | $273,748 | $800,713 | $203 billion | $10 billion |
| 26 | Hawaii | 138,480 | $1,057,558 | $3.1 million | $195 billion | $10 billion |
| 27 | Alabama | 511,809 | $270,560 | $791,388 | $174 billion | $9 billion |
| 28 | Utah | 222,059 | $605,517 | $1.8 million | $168 billion | $8 billion |
| 29 | Nevada | 255,659 | $513,542 | $1.5 million | $165 billion | $8 billion |
| 30 | Kentucky | 429,664 | $249,095 | $728,603 | $133 billion | $7 billion |
| 31 | Louisiana | 427,071 | $248,821 | $727,801 | $132 billion | $7 billion |
| 32 | Oklahoma | 347,660 | $260,531 | $762,053 | $113 billion | $6 billion |
| 33 | Idaho | 179,888 | $502,942 | $1.5 million | $111 billion | $6 billion |
| 34 | New Mexico | 233,919 | $348,789 | $1.0 million | $104 billion | $5 billion |
| 35 | Iowa | 312,957 | $252,355 | $738,138 | $99 billion | $5 billion |
| 36 | New Hampshire | 147,108 | $513,703 | $1.5 million | $90 billion | $4 billion |
| 37 | Kansas | 269,975 | $264,737 | $774,356 | $87 billion | $4 billion |
| 37 | Arkansas | 289,630 | $236,465 | $691,660 | $87 billion | $4 billion |
| 39 | Maine | 169,024 | $412,665 | $1.2 million | $86 billion | $4 billion |
| 40 | Montana | 122,484 | $534,951 | $1.6 million | $79 billion | $4 billion |
| 41 | Mississippi | 289,698 | $212,775 | $622,367 | $77 billion | $4 billion |
| 42 | Rhode Island | 98,046 | $560,348 | $1.6 million | $68 billion | $3 billion |
| 43 | Delaware | 119,838 | $429,862 | $1.3 million | $64 billion | $3 billion |
| 44 | Nebraska | 177,242 | $284,052 | $830,852 | $63 billion | $3 billion |
| 45 | West Virginia | 211,051 | $202,521 | $592,374 | $54 billion | $3 billion |
| 46 | District of Columbia | 38,465 | $959,906 | $2.8 million | $50 billion | $2 billion |
| 47 | Wyoming | 64,863 | $502,056 | $1.5 million | $39 billion | $2 billion |
| 47 | Vermont | 77,084 | $400,754 | $1.2 million | $39 billion | $2 billion |
| 49 | South Dakota | 82,856 | $301,563 | $882,072 | $30 billion | $1 billion |
| 50 | Alaska | 54,021 | $386,801 | $1.1 million | $24 billion | $1 billion |
| 51 | North Dakota | 66,520 | $260,232 | $761,179 | $21 billion | $1 billion |
A third of younger Americans expect an inheritance
Expectations surrounding inheritances are common, with a third (33%) of Americans younger than 65 expecting to receive either an inheritance or a financial gift in the future.
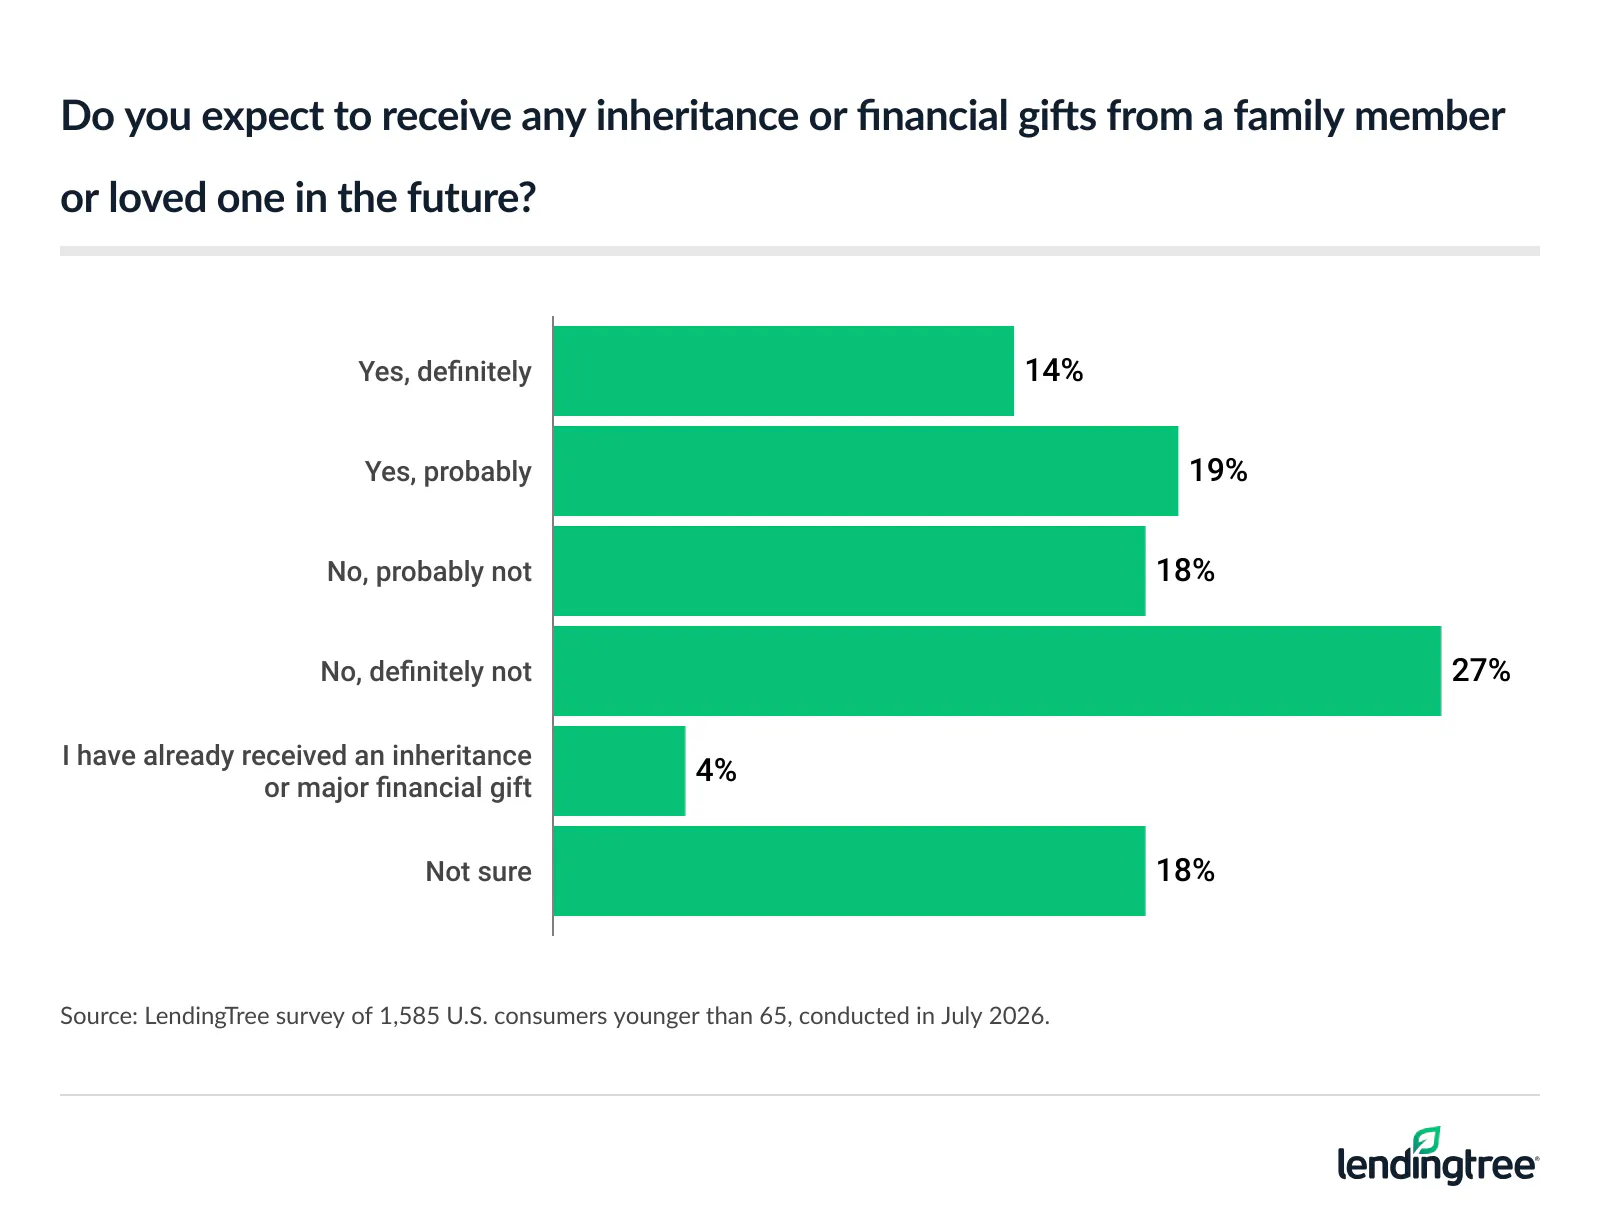
These expectations are especially common among younger Americans earning six figures (53%), those with children younger than 18 (46%) and Gen Zers ages 18 to 29 (43%). In contrast, just 43% of Americans 65 or older plan to give an inheritance or financial gift.
That gap between expectation and intention isn’t necessarily a red flag, though, according to Schulz.
“There’s often a gap between what people hope to leave behind and what ultimately gets transferred,” he says. “Many older Americans fully intend to pass wealth to the next generation, but retirement can last 20 or 30 years, and financial needs change over time. Healthcare expenses, long-term care, market fluctuations, inflation and the cost of living can all reduce the value of an estate before it’s ultimately transferred.”
That said, Schulz also believes there’s an expectations gap within families. “Adult children may estimate the value of their parents’ assets without fully understanding their retirement spending, debt, charitable giving or estate plans,” he says. “In many cases, families simply haven’t had detailed conversations about what will be passed on, when it might happen or whether wealth will be transferred during life, at death or both. That uncertainty can leave prospective heirs with expectations that don’t match reality.”
Expected inheritances are already shaping retirement plans
Prospective heirs may rely on expected inheritances a little too much. Among those who expect to receive an inheritance or financial gift, a significant 43% say their retirement planning depends a great deal on that expected transfer.
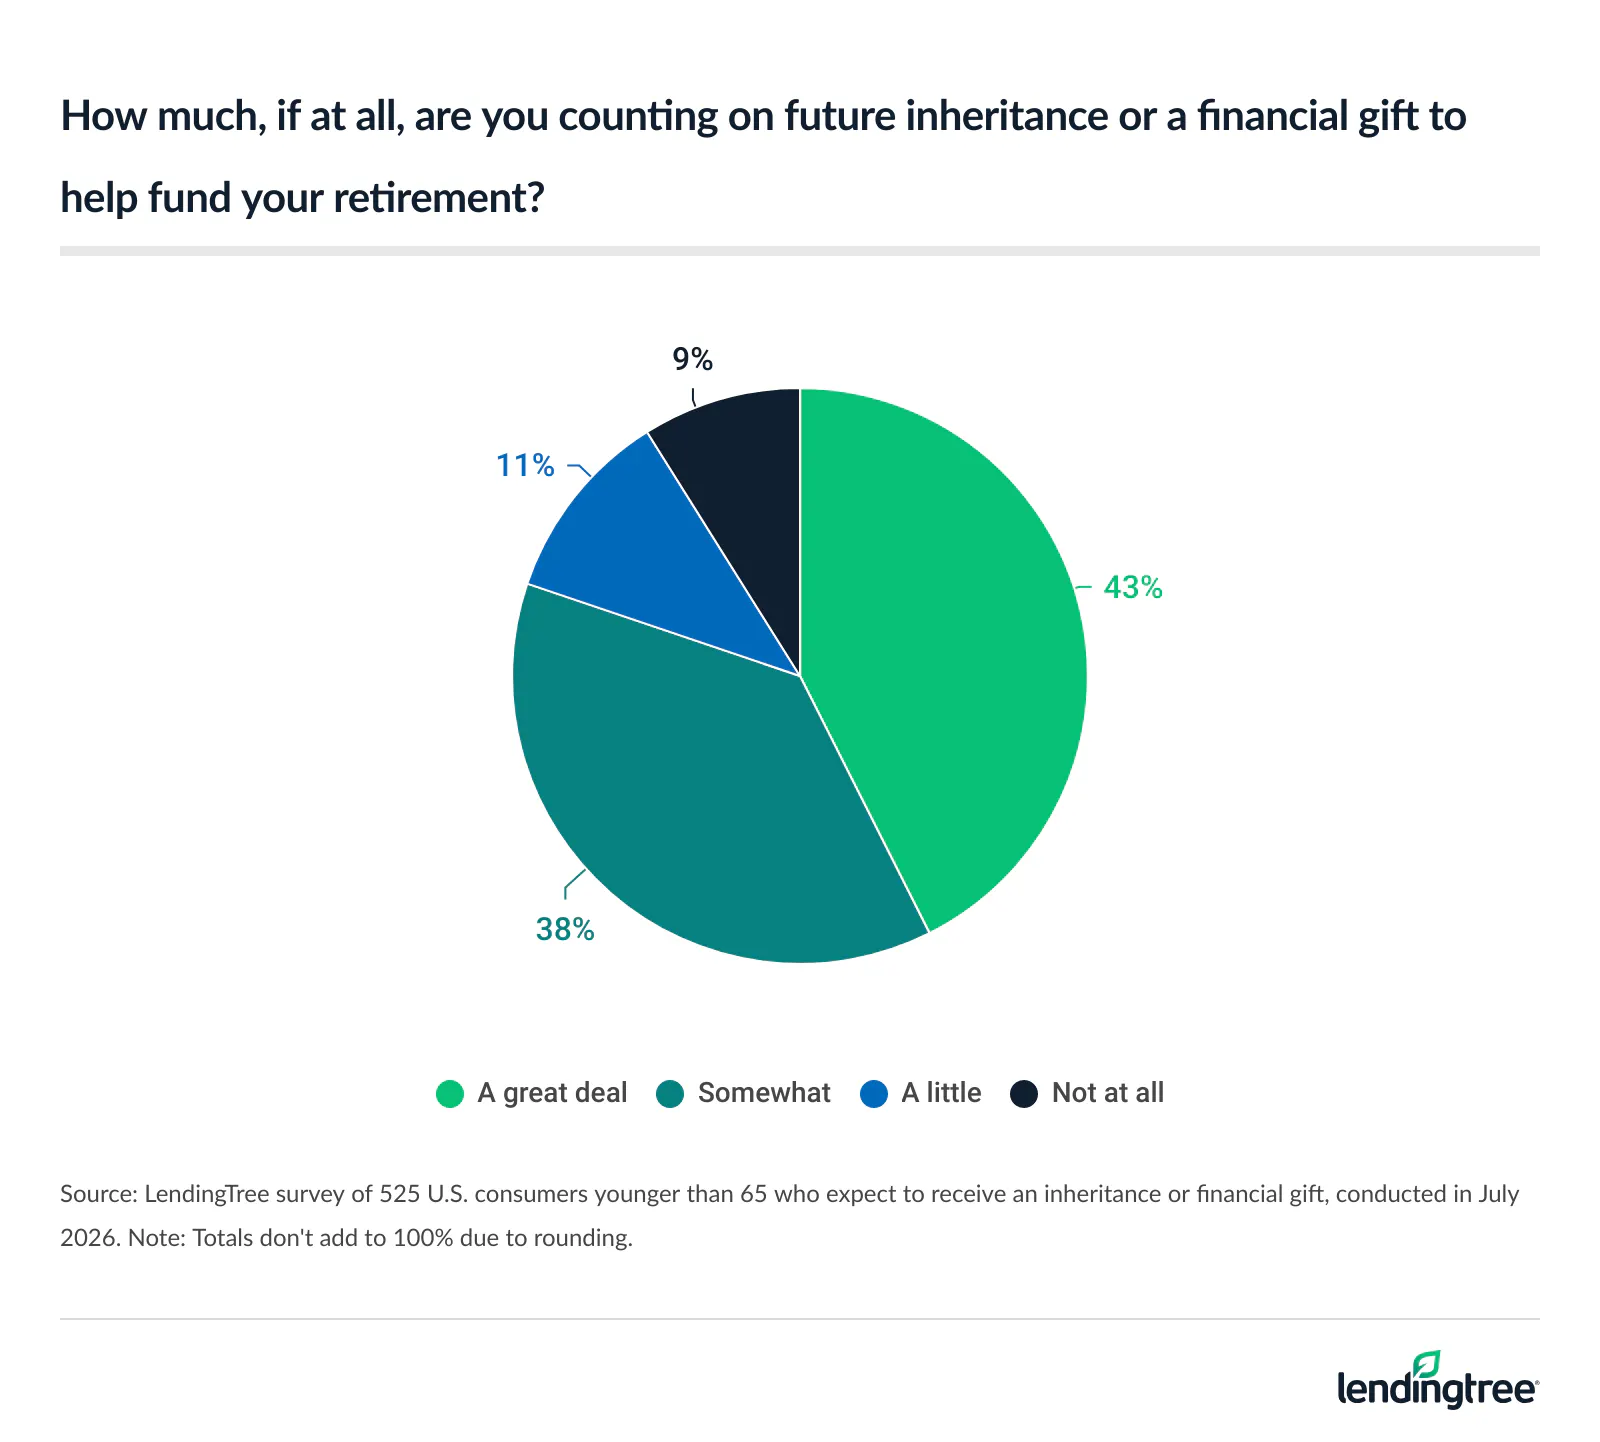
Only a quarter (25%) of those who expect an inheritance or financial gift say the possibility of receiving it hasn’t affected their retirement planning.
This strategy may not be the soundest, though. In fact, Schulz warns against leaning too heavily on money that hasn’t arrived yet.
“Planning around an inheritance is risky because there are so many variables outside your control,” he says. “You don’t know when the transfer will occur, how much will ultimately remain after healthcare costs or other expenses, or whether family circumstances or estate plans will change over time.”
Instead, Schulz advises that “a future inheritance should generally be treated as a potential upside rather than a core retirement strategy.”
“Build a retirement plan that works without it, and if an inheritance ultimately materializes, it can improve your financial security rather than rescue it.”
Families aren’t talking about wealth transfers enough
Conversations around wealth transfers aren’t happening as often as they should be. While many Americans expect to rely on an inheritance or financial gift for their retirement, just 57% of those anticipating an inheritance have discussed those expectations clearly with the person they expect to receive it from.
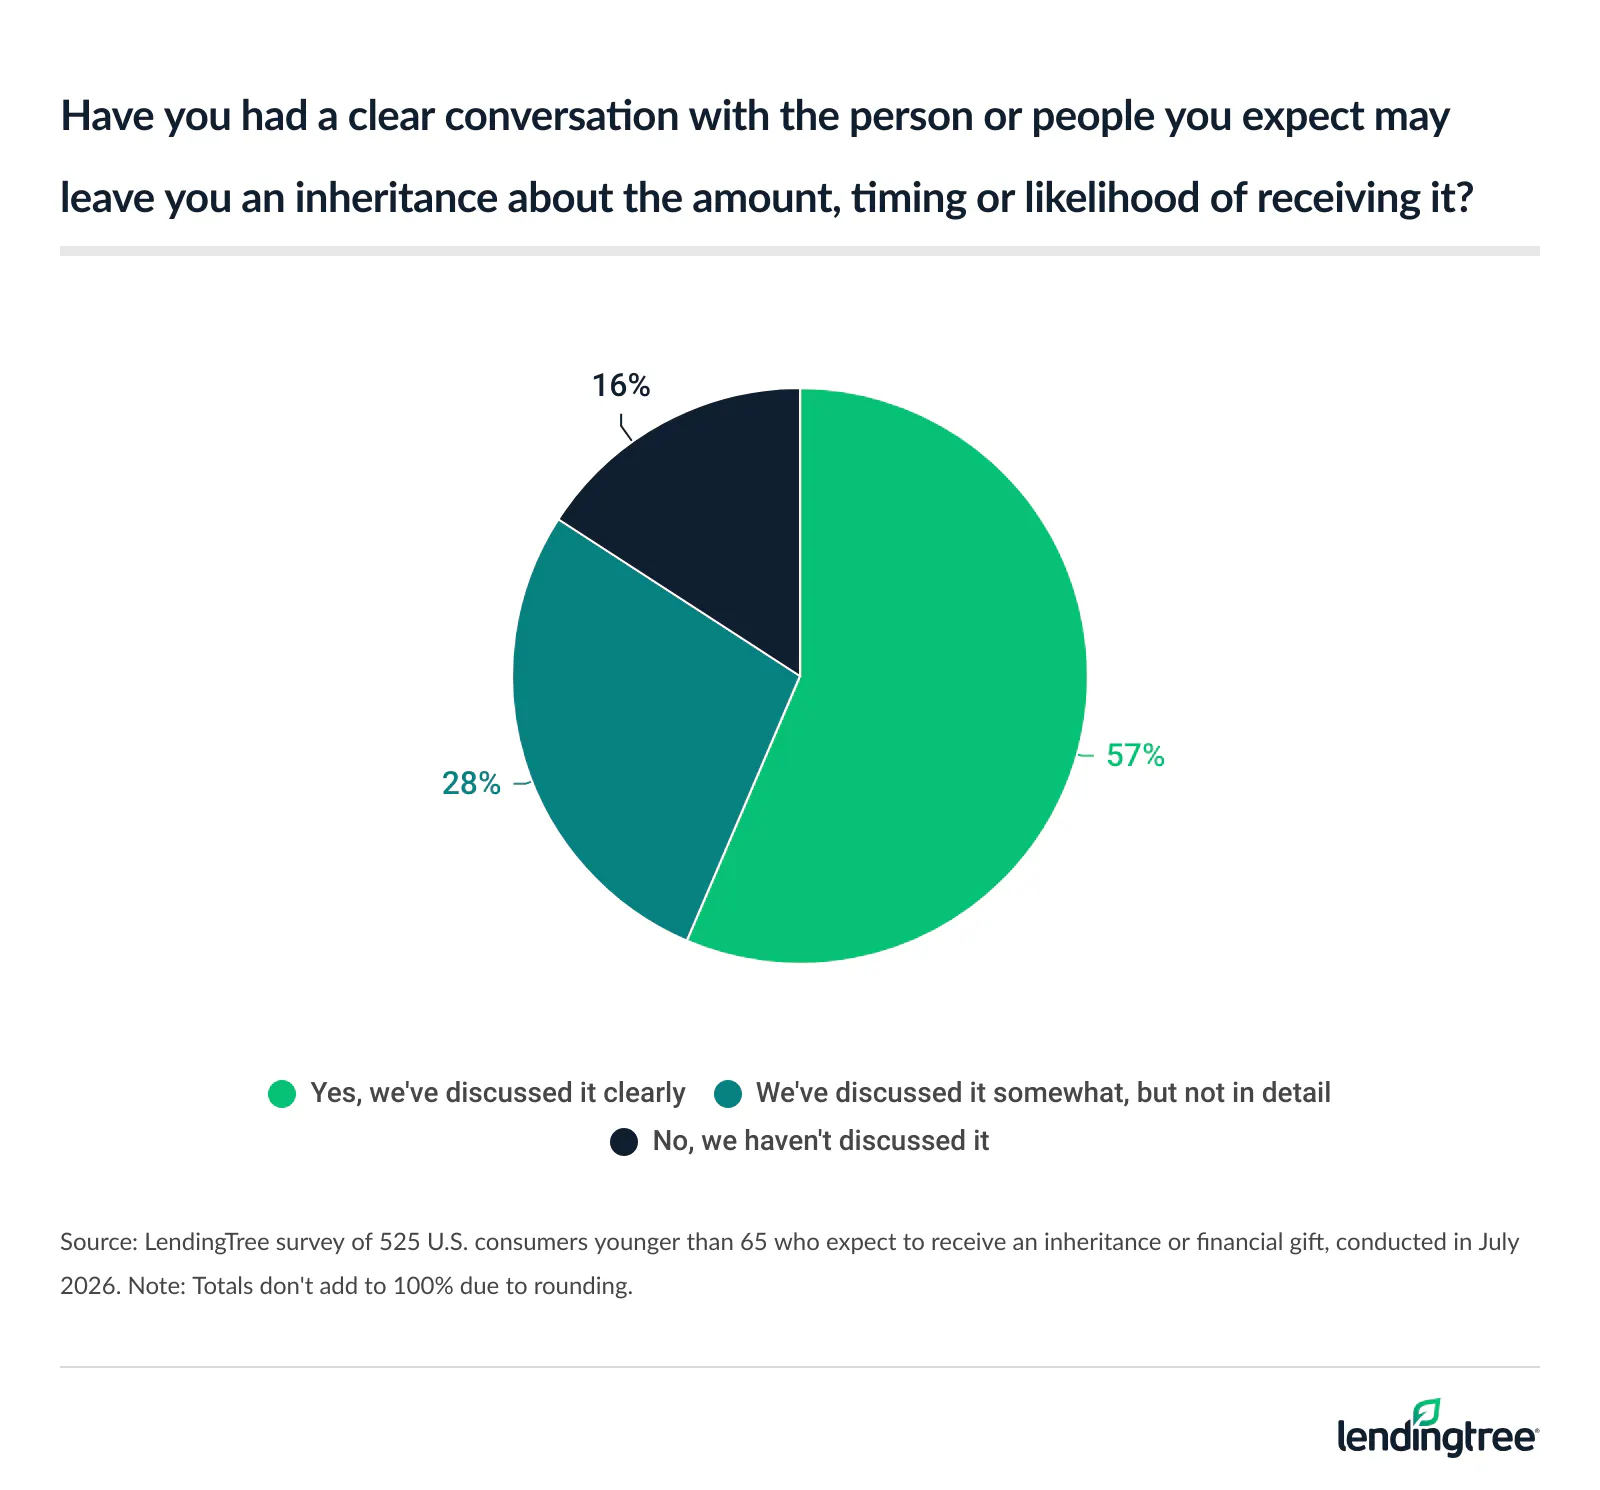
Meanwhile, 28% have only discussed their inheritance broadly, and 16% of those expecting an inheritance haven’t discussed it with the expected giver at all.
According to Schulz, that silence has real consequences.
“When families avoid conversations about inheritance, they often create uncertainty for everyone involved,” he says. “Adult children may make financial decisions based on assumptions that never come to pass, while parents may assume everyone understands their wishes when they don’t. That uncertainty can complicate retirement planning long before it creates legal problems after someone’s death, but it can also lead to resentment and anger.”
To avoid these issues cropping up, it’s important to have conversations that are wide-ranging and comprehensive, and likely ongoing.
“The most productive conversations aren’t necessarily about dollar amounts,” Schulz says. “They’re about expectations and processes and perspectives, too.”
Tips for preparing for the great wealth transfer
With trillions of dollars expected to pass from one generation to the next in the coming decades, families can reduce the risk of confusion and family conflict by planning ahead. We recommend focusing on these key steps:
- Communicate early and often. “Have honest conversations early,” Schulz says. “While inheritance discussions can be uncomfortable, they’re essential because expectations about inheritance should never be based on assumptions.”
- Keep your estate plan current. Schulz recommends making sure your estate planning documents remain up to date. “Wills, trusts, beneficiary designations and powers of attorney should be reviewed periodically, especially if you’ve had major life changes recently,” he says.
- Organize important financial and legal documents. In addition to maintaining current estate planning documents, keep records — such as account information, insurance policies and property documents — in a secure, accessible location. Let your executor or trusted family members know where to find them if needed.
- Work with estate planning professionals. An estate planning attorney and financial advisor can help ensure your documents reflect your wishes, account for changes in the law and make the transfer of assets as smooth as possible for your heirs.
Methodology
LendingTree analyzed data from all 50 states and the District of Columbia to estimate how much wealth older homeowners would transfer when they die.
To estimate state-level transfers, we calculated the number of homeowners ages 65 and older and the value of their homes. Based on the Federal Reserve’s 2022 Survey of Consumer Finances (the latest available), we assumed that the average homeowner age 65 or older has a net worth equal to 4.5 times the home value and would pass on 65% of that wealth.
Annual transfers from 2026 through 2045 were estimated using mortality rates of 1.4% for homeowners ages 65 to 74, 4.5% for those ages 75 to 84 and 13.0% for those 85 and older, based on Social Security Administration (SSA) data. The analysis included only homeowners who were 65 or older at the time of the analysis and excluded homeowners who later aged into the cohort.
States were ranked from highest to lowest based on the total amount transferred over the 20-year period.
Older homeowner household counts came from the U.S. Census Bureau’s 2024 American Community Survey (ACS). Average home values were calculated from the Census Bureau’s 2024 ACS one-year Public Use Microdata Sample (PUMS) using owner-occupied homes with a householder age 65 or older, positive property values and Census Bureau housing-unit weights.
Additionally, LendingTree commissioned QuestionPro to conduct an online survey of 1,585 U.S. consumers ages 18 to 64 from July 2 to 8, 2026. The survey was administered using a nonprobability-based sample, and quotas were used to help ensure the sample reflected the overall population. Researchers reviewed all responses for quality control.
Generations were defined as the following age groups in 2026:
- Generation Z: 18 to 29
- Millennials: 30 to 45
- Generation X: 46 to 64
Get debt consolidation loan offers from up to 5 lenders in minutes