Starter Homes Are Out of Reach for 62% of Nonhomeowners Nationwide
For millions of Americans, the dream of homeownership is slipping further out of reach.
LendingTree research found that fewer than 4 in 10 nonhomeowner households nationwide can afford a starter home. The data highlights significant differences in starter-home affordability across the country, with some markets remaining far more accessible than others.
- Starter homes remain unaffordable for most nonhomeowner households nationwide. Just 37.6% can afford a starter home, and the median nonhomeowner household earns $7,099 less than the $62,099 annual income needed to do so. The average starter home nationwide costs $200,000.
- Rhode Island is the least affordable state for aspiring homebuyers who don’t already own a home. Just 16.5% of nonhomeowner households can afford a starter home there, and the median nonhomeowner household earns $56,581 less than the income required to purchase one. The average starter home in Rhode Island costs $350,000.
- California’s nonhomeowners face the nation’s largest dollar shortfall. The median nonhomeowner household earns $67,776 less than the $140,676 needed to afford a starter home, and only 21.3% can afford one. The average starter home in California costs $482,000.
- Lower-cost Southern states tend to offer the greatest accessibility. Mississippi ranks first, with 61.8% of nonhomeowner households able to afford a starter home, followed by West Virginia (58.0%), Arkansas (54.3%) and Alabama (54.1%). The average starter home costs $85,000 in Mississippi and $90,000 in West Virginia.
- Consumers most often define a starter home by its affordability and the compromises it requires. When asked what qualifies a home as a starter home, 36% say it’s more affordable than other homes in the area, 33% say it has fewer bedrooms or bathrooms than ideal and 30% say it offers less square footage than they would want long term. Overall, 64% believe it’s realistic for a first-time homebuyer to purchase a starter home in their area.
Starter homes remain unaffordable for most nonhomeowners
Just 37.6% of nonhomeowner households can afford a starter home, defined as the weighted 25th-percentile value of owner-occupied homes. The median nonhomeowner household earns $55,000 but needs $62,099 to afford a starter home, leaving an income gap of $7,099.
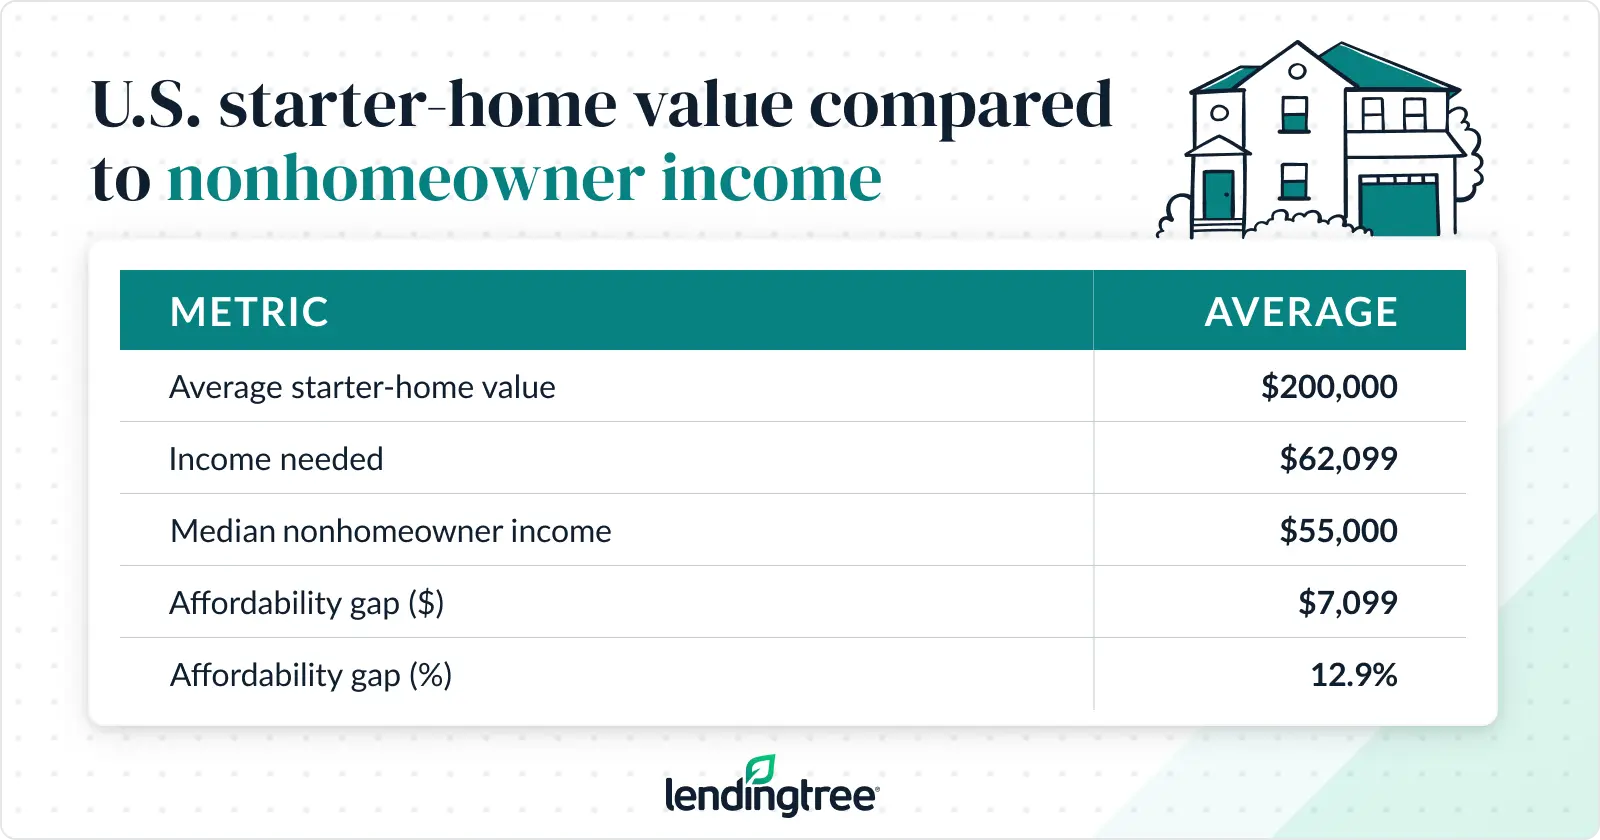
Nationwide, the average starter home costs $200,000.
While that income gap may appear manageable on paper, Matt Schulz, LendingTree chief consumer finance analyst and author of “Ask Questions, Save Money, Make More: How to Take Control of Your Financial Life,” says closing it may be difficult in practice.
“It’s safe to say that most people don’t get raises of $7,099 each year,” he says. “That means that bridging that gap might require a side hustle, a second job or other sacrifices. That’s tough, however, especially with how many other demands people already have on their time.”
Millennials are the generation most likely to be able to afford a starter home. Among nonhomeowners, 45.2% of millennials ages 30 to 45 can afford one, compared with 40.7% of Gen Xers ages 46 to 61, 37.3% of Gen Zers ages 18 to 29 and 24.3% of baby boomers ages 62 to 80.
Rhode Island is the least affordable state for aspiring homebuyers
Rhode Island ranks as the least affordable state for nonhomeowner households seeking to purchase a starter home. Just 16.5% can afford one, and the median nonhomeowner household earns $51,000, well below the $107,581 needed to afford a starter home.
In Rhode Island, a starter home costs an average of $350,000.
Schulz says the data underscores how challenging homeownership has become for many Americans. “For so many, it feels completely out of reach,” he says. “It’s a shame because homeownership can be a powerful wealth-building tool and a real stabilizing force for families. However, the numbers involved are so daunting that many people don’t see a realistic way to get into the market.”
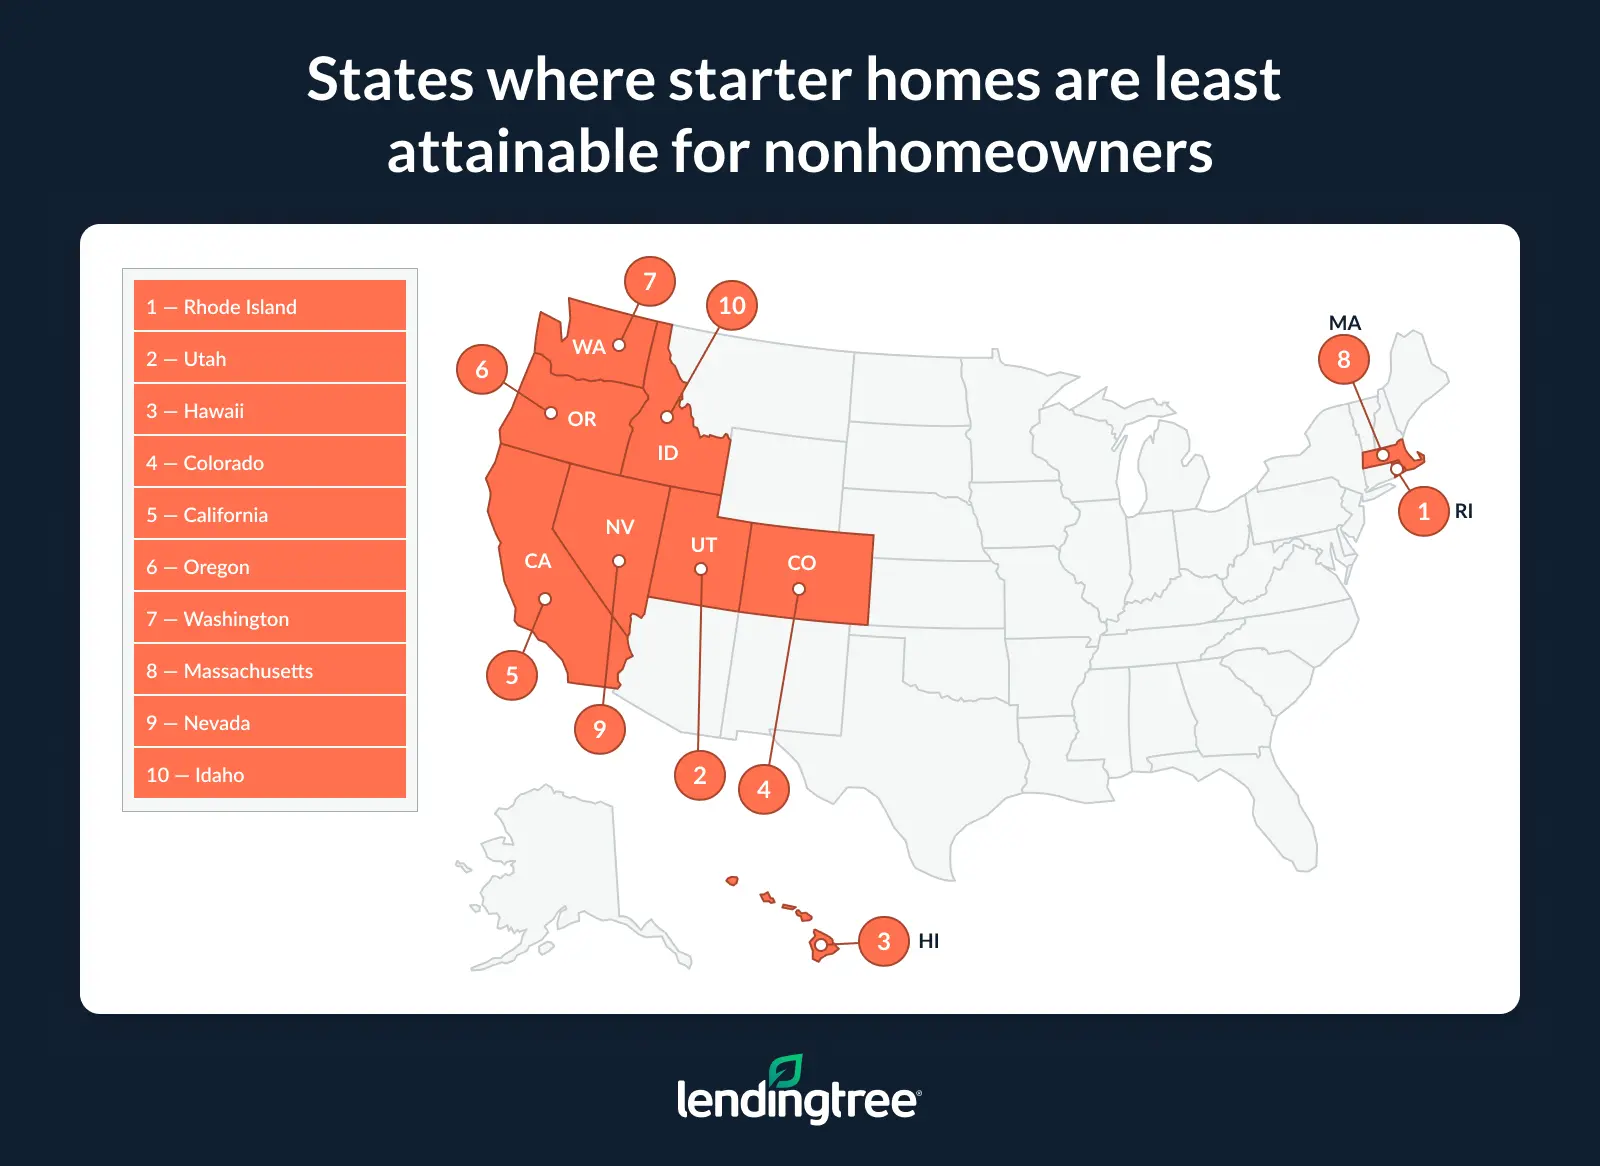
Utah ranks second. Just 19.1% of nonhomeowner households can afford a starter home there. The average starter home costs $400,000, while the median nonhomeowner household earns $65,000, far short of the $112,351 needed to afford one.
Hawaii rounds out the top three least affordable states. Just 19.2% of nonhomeowners can afford a starter home. The median nonhomeowner household earns $70,200, compared with the $133,856 needed to afford a starter home, which costs an average of $500,000.
California’s nonhomeowners face the nation’s largest income gap
While Rhode Island ranks as the least affordable state overall, California has the largest income shortfall in dollar terms. The median nonhomeowner household earns $72,900, or $67,776 less than the $140,676 needed to afford a starter home. Just 21.3% of nonhomeowner households can afford one. The average starter home in California costs $482,000.
California also requires the highest monthly income to cover homeownership costs, at $11,723. For the average starter home, monthly principal and interest payments total $2,805, contributing to a total monthly housing payment of $3,517.
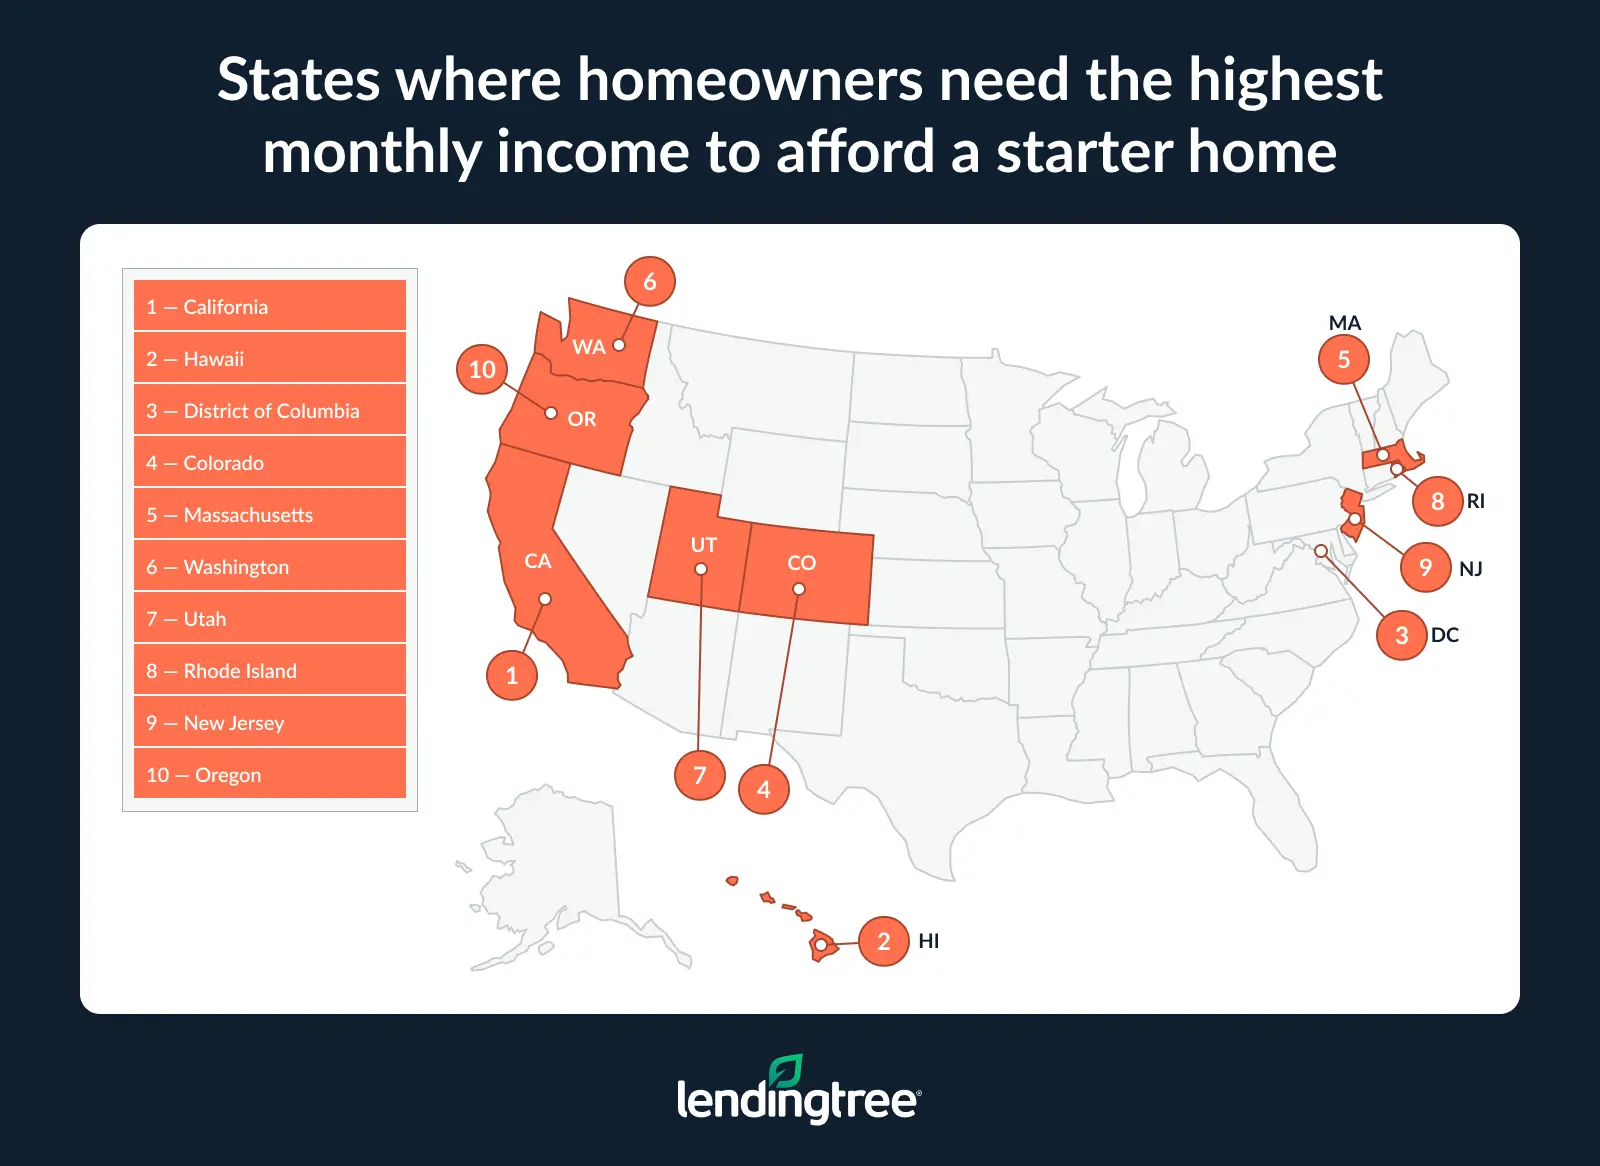
Hawaii ranks second, requiring a monthly income of $11,153 to comfortably afford a starter home, followed by the District of Columbia at $10,710.
More broadly, coastal and higher-cost markets dominate this part of the rankings. Hawaii, Colorado, Massachusetts, Oregon, Utah, Washington and the District of Columbia all have large affordability gaps and relatively small shares of nonhomeowner households that can afford a starter home. In many of these markets, nonhomeowner households would need to nearly double their current incomes to afford one.
Despite those challenges, Schulz says homeownership remains attainable for some buyers willing to make adjustments.
“If homeownership is a major priority, there are often ways you can make it happen, even in some of the nation’s most expensive housing markets,” he says. “However, it may take planning and sacrifice. That may mean focusing on improving your credit, reducing debt, increasing savings, pursuing higher-paying jobs or considering smaller homes and different neighborhoods. You may have to consider different types of loans. You might even have to partner with a spouse, family member or co-buyer to make it work. It’s up to you to decide what you’re willing to do and how far you’re willing to go to make your homeownership dream come true.”
Full rankings: States where homeowners need the highest monthly income to afford a starter home
| Rank | State | Starter-home value | Principal and interest | Total monthly payment | Monthly income needed |
|---|---|---|---|---|---|
| 1 | California | $482,000 | $2,805 | $3,517 | $11,723 |
| 2 | Hawaii | $500,000 | $2,910 | $3,346 | $11,153 |
| 3 | District of Columbia | $450,000 | $2,619 | $3,213 | $10,710 |
| 4 | Colorado | $400,000 | $2,328 | $3,040 | $10,133 |
| 5 | Massachusetts | $400,000 | $2,328 | $2,980 | $9,933 |
| 6 | Washington | $400,000 | $2,328 | $2,907 | $9,690 |
| 7 | Utah | $400,000 | $2,328 | $2,809 | $9,363 |
| 8 | Rhode Island | $350,000 | $2,037 | $2,690 | $8,967 |
| 9 | New Jersey | $325,000 | $1,891 | $2,675 | $8,917 |
| 10 | Oregon | $350,000 | $2,037 | $2,546 | $8,487 |
| 11 | Nevada | $335,000 | $1,950 | $2,376 | $7,920 |
| 12 | New Hampshire | $300,000 | $1,746 | $2,346 | $7,820 |
| 14 | Connecticut | $275,000 | $1,600 | $2,248 | $7,493 |
| 13 | Maryland | $296,000 | $1,723 | $2,277 | $7,590 |
| 15 | Idaho | $300,000 | $1,746 | $2,140 | $7,133 |
| 16 | Arizona | $275,000 | $1,600 | $1,960 | $6,533 |
| 17 | Florida | $250,000 | $1,455 | $1,890 | $6,300 |
| 18 | Montana | $250,000 | $1,455 | $1,879 | $6,263 |
| 20 | Virginia | $250,000 | $1,455 | $1,868 | $6,227 |
| 19 | Alaska | $250,000 | $1,455 | $1,874 | $6,247 |
| 21 | Minnesota | $225,000 | $1,309 | $1,757 | $5,857 |
| 22 | Delaware | $250,000 | $1,455 | $1,735 | $5,783 |
| 23 | Texas | $189,000 | $1,100 | $1,661 | $5,537 |
| 28 | Nebraska | $165,000 | $960 | $1,515 | $5,050 |
| 24 | New York | $200,000 | $1,164 | $1,585 | $5,283 |
| 27 | Tennessee | $200,000 | $1,164 | $1,541 | $5,137 |
| 26 | Georgia | $200,000 | $1,164 | $1,550 | $5,167 |
| 29 | North Carolina | $200,000 | $1,164 | $1,488 | $4,960 |
| 25 | Vermont | $200,000 | $1,164 | $1,552 | $5,173 |
| 30 | Wisconsin | $190,000 | $1,106 | $1,486 | $4,953 |
| 32 | Wyoming | $200,000 | $1,164 | $1,462 | $4,873 |
| 31 | Maine | $200,000 | $1,164 | $1,484 | $4,947 |
| 34 | South Dakota | $168,000 | $978 | $1,391 | $4,637 |
| 33 | Illinois | $155,000 | $902 | $1,406 | $4,687 |
| 35 | South Carolina | $175,000 | $1,018 | $1,337 | $4,457 |
| 36 | Pennsylvania | $160,000 | $931 | $1,278 | $4,260 |
| 38 | Michigan | $150,000 | $873 | $1,223 | $4,077 |
| 39 | North Dakota | $150,000 | $873 | $1,220 | $4,067 |
| 41 | New Mexico | $150,000 | $873 | $1,187 | $3,957 |
| 45 | Oklahoma | $120,000 | $698 | $1,124 | $3,747 |
| 37 | Ohio | $150,000 | $873 | $1,224 | $4,080 |
| 40 | Missouri | $150,000 | $873 | $1,202 | $4,007 |
| 43 | Iowa | $136,000 | $791 | $1,181 | $3,937 |
| 44 | Kansas | $125,000 | $727 | $1,145 | $3,817 |
| 42 | Indiana | $150,000 | $873 | $1,185 | $3,950 |
| 46 | Kentucky | $125,000 | $727 | $1,057 | $3,523 |
| 47 | Alabama | $120,000 | $698 | $981 | $3,270 |
| 48 | Louisiana | $124,000 | $722 | $978 | $3,260 |
| 49 | Arkansas | $110,000 | $640 | $947 | $3,157 |
| 50 | Mississippi | $85,000 | $495 | $738 | $2,460 |
| 51 | West Virginia | $90,000 | $524 | $728 | $2,427 |
Southern states offer the most attainable path to homeownership
At the other end of the rankings, lower-cost Southern states offer the strongest affordability for nonhomeowner households. Mississippi ranks first, with 61.8% able to afford a starter home, followed by West Virginia (58.0%), Arkansas (54.3%) and Alabama (54.1%).
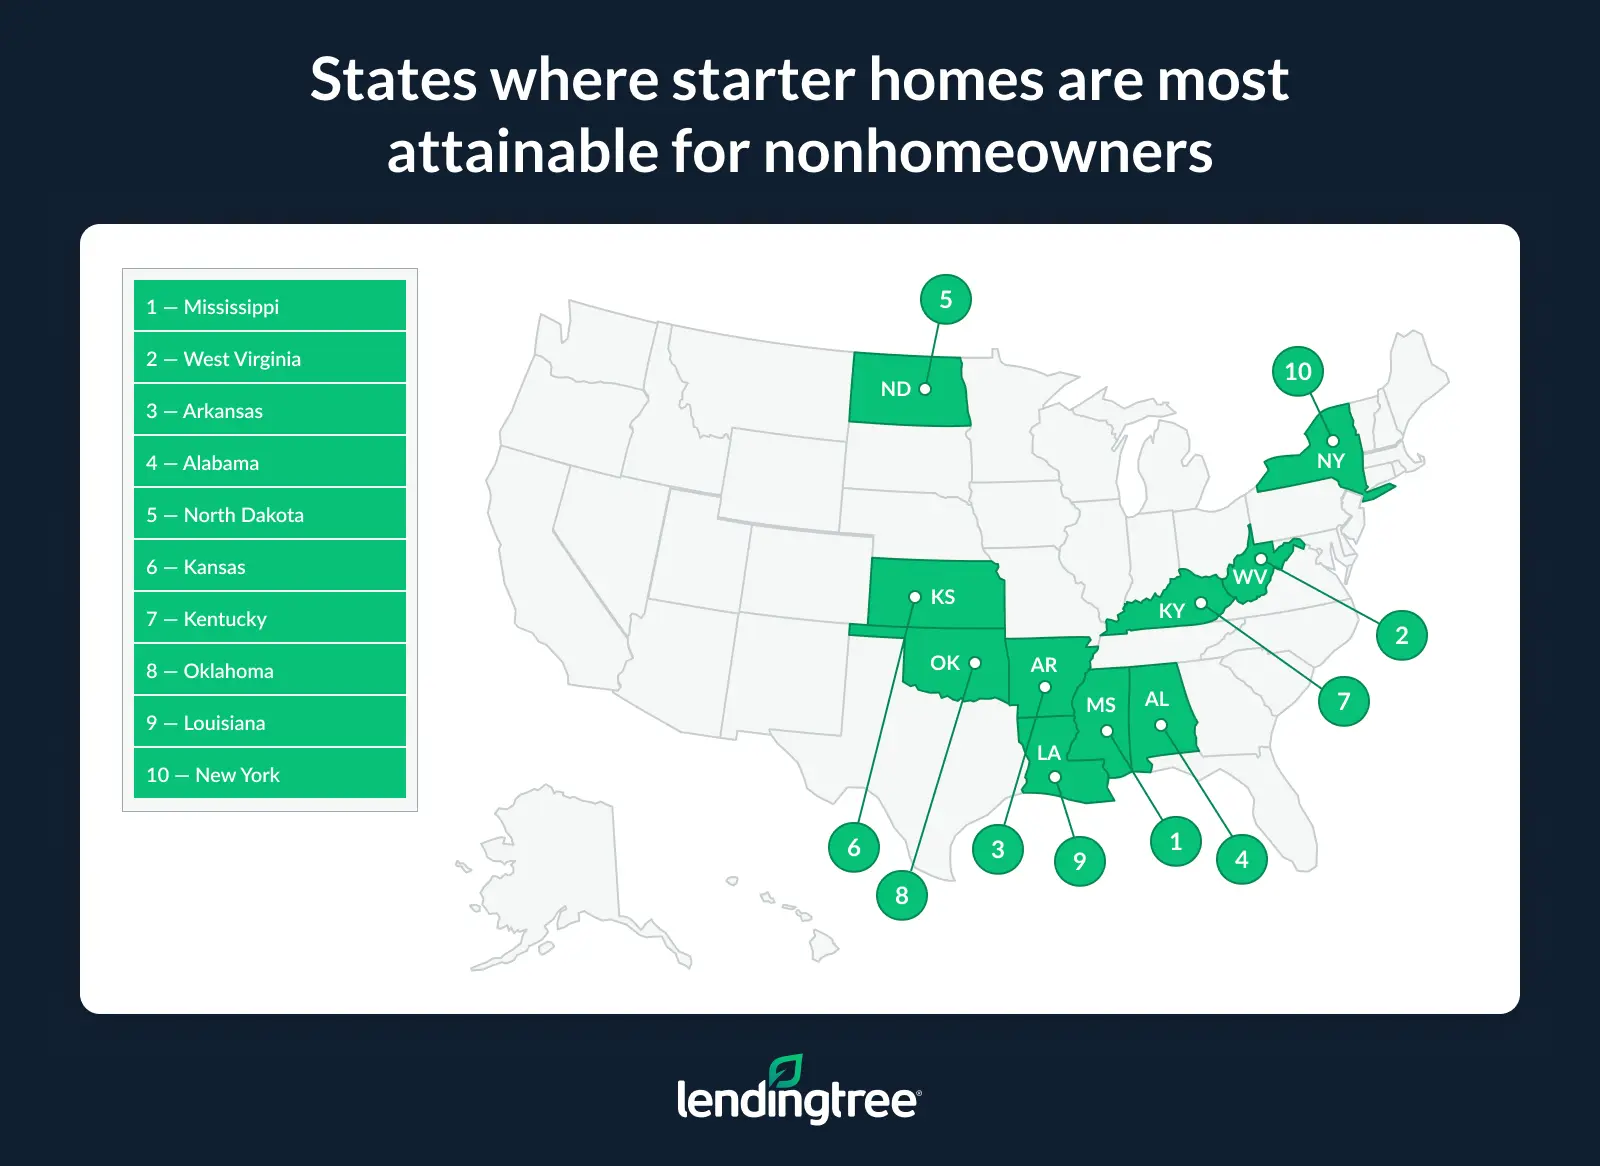
Starter homes cost an average of $85,000 in Mississippi and $90,000 in West Virginia, making them the only states where the average starter-home price is below $100,000.
Full rankings: States where starter homes are most/least attainable for nonhomeowners
| Rank | State | % able to afford a starter home | Starter-home value | Starter-home price-to-income ratio | Income needed | Median nonhomeowner income |
|---|---|---|---|---|---|---|
| 1 | Mississippi | 61.8% | $85,000 | 2.19 | $29,523 | $38,800 |
| 2 | West Virginia | 58.0% | $90,000 | 2.57 | $29,114 | $35,000 |
| 3 | Arkansas | 54.3% | $110,000 | 2.75 | $37,862 | $40,000 |
| 4 | Alabama | 54.1% | $120,000 | 2.82 | $39,239 | $42,500 |
| 5 | North Dakota | 52.7% | $150,000 | 2.95 | $48,785 | $50,800 |
| 6 | Kansas | 52.3% | $125,000 | 2.55 | $45,793 | $49,000 |
| 7 | Kentucky | 50.7% | $125,000 | 2.89 | $42,280 | $43,300 |
| 8 | Oklahoma | 49.9% | $120,000 | 2.69 | $44,969 | $44,600 |
| 9 | Louisiana | 48.9% | $124,000 | 3.26 | $39,114 | $38,000 |
| 10 | New York | 47.7% | $200,000 | 3.33 | $63,386 | $60,000 |
| 11 | New Mexico | 47.2% | $150,000 | 3.31 | $47,485 | $45,260 |
| 12 | Indiana | 47.1% | $150,000 | 3.37 | $47,398 | $44,500 |
| 12 | Missouri | 47.1% | $150,000 | 3.33 | $48,068 | $45,000 |
| 14 | Pennsylvania | 47.0% | $160,000 | 3.28 | $51,119 | $48,800 |
| 15 | Illinois | 46.6% | $155,000 | 3.04 | $56,230 | $51,000 |
| 15 | Vermont | 46.6% | $200,000 | 3.51 | $62,099 | $57,000 |
| 17 | Ohio | 46.3% | $150,000 | 3.33 | $48,948 | $45,000 |
| 18 | Iowa | 46.0% | $136,000 | 3.12 | $47,254 | $43,640 |
| 19 | Michigan | 45.3% | $150,000 | 3.39 | $48,935 | $44,200 |
| 20 | South Carolina | 43.8% | $175,000 | 3.72 | $53,475 | $47,000 |
| 21 | Georgia | 43.1% | $200,000 | 3.70 | $61,992 | $54,000 |
| 22 | Wisconsin | 41.5% | $190,000 | 3.80 | $59,428 | $50,000 |
| 23 | Delaware | 41.4% | $250,000 | 4.31 | $69,416 | $58,000 |
| 24 | North Carolina | 41.2% | $200,000 | 4.00 | $59,502 | $50,000 |
| 25 | Virginia | 40.9% | $250,000 | 4.13 | $74,729 | $60,600 |
| 26 | Texas | 40.2% | $189,000 | 3.44 | $66,434 | $55,000 |
| 27 | Alaska | 39.4% | $250,000 | 3.97 | $74,949 | $63,000 |
| 27 | Tennessee | 39.4% | $200,000 | 4.00 | $61,626 | $50,000 |
| 29 | Wyoming | 38.6% | $200,000 | 4.65 | $58,492 | $43,000 |
| 30 | Maine | 37.8% | $200,000 | 4.45 | $59,379 | $44,900 |
| 31 | South Dakota | 37.6% | $168,000 | 3.73 | $55,627 | $45,000 |
| 32 | Arizona | 37.5% | $275,000 | 4.48 | $78,385 | $61,350 |
| 32 | Nebraska | 37.5% | $165,000 | 3.30 | $60,583 | $50,000 |
| 34 | Florida | 36.0% | $250,000 | 4.36 | $75,596 | $57,300 |
| 35 | Maryland | 33.7% | $296,000 | 4.65 | $91,068 | $63,700 |
| 36 | Minnesota | 33.6% | $225,000 | 4.43 | $70,271 | $50,800 |
| 37 | Montana | 32.1% | $250,000 | 4.81 | $75,146 | $52,000 |
| 38 | New Hampshire | 29.1% | $300,000 | 4.84 | $93,850 | $62,000 |
| 39 | District of Columbia | 28.7% | $450,000 | 5.92 | $128,528 | $76,000 |
| 40 | New Jersey | 28.4% | $325,000 | 4.92 | $107,014 | $66,000 |
| 41 | Connecticut | 28.0% | $275,000 | 5.17 | $89,925 | $53,200 |
| 42 | Idaho | 26.1% | $300,000 | 5.56 | $85,587 | $54,000 |
| 43 | Nevada | 25.4% | $335,000 | 5.82 | $95,026 | $57,600 |
| 44 | Massachusetts | 25.3% | $400,000 | 6.19 | $119,215 | $64,590 |
| 45 | Washington | 25.1% | $400,000 | 5.73 | $116,298 | $69,800 |
| 46 | Oregon | 22.7% | $350,000 | 6.03 | $101,837 | $58,000 |
| 47 | California | 21.3% | $482,000 | 6.61 | $140,676 | $72,900 |
| 48 | Colorado | 19.3% | $400,000 | 6.13 | $121,598 | $65,200 |
| 49 | Hawaii | 19.2% | $500,000 | 7.12 | $133,856 | $70,200 |
| 50 | Utah | 19.1% | $400,000 | 6.15 | $112,351 | $65,000 |
| 51 | Rhode Island | 16.5% | $350,000 | 6.86 | $107,581 | $51,000 |
Full rankings: States with the biggest starter home affordability gaps (by percentage)
| Rank | State | Starter-home value | Income needed | Median nonhomeowner income | Affordability gap ($) | Affordability gap (%) |
|---|---|---|---|---|---|---|
| 1 | Rhode Island | $350,000 | $107,581 | $51,000 | $56,581 | 110.9% |
| 2 | California | $482,000 | $140,676 | $72,900 | $67,776 | 93.0% |
| 3 | Hawaii | $500,000 | $133,856 | $70,200 | $63,656 | 90.7% |
| 4 | Colorado | $400,000 | $121,598 | $65,200 | $56,398 | 86.5% |
| 5 | Massachusetts | $400,000 | $119,215 | $64,590 | $54,625 | 84.6% |
| 6 | Oregon | $350,000 | $101,837 | $58,000 | $43,837 | 75.6% |
| 7 | Utah | $400,000 | $112,351 | $65,000 | $47,351 | 72.8% |
| 8 | District of Columbia | $450,000 | $128,528 | $76,000 | $52,528 | 69.1% |
| 9 | Connecticut | $275,000 | $89,925 | $53,200 | $36,725 | 69.0% |
| 10 | Washington | $400,000 | $116,298 | $69,800 | $46,498 | 66.6% |
| 11 | Nevada | $335,000 | $95,026 | $57,600 | $37,426 | 65.0% |
| 12 | New Jersey | $325,000 | $107,014 | $66,000 | $41,014 | 62.1% |
| 13 | Idaho | $300,000 | $85,587 | $54,000 | $31,587 | 58.5% |
| 14 | New Hampshire | $300,000 | $93,850 | $62,000 | $31,850 | 51.4% |
| 15 | Montana | $250,000 | $75,146 | $52,000 | $23,146 | 44.5% |
| 16 | Maryland | $296,000 | $91,068 | $63,700 | $27,368 | 43.0% |
| 17 | Minnesota | $225,000 | $70,271 | $50,800 | $19,471 | 38.3% |
| 18 | Wyoming | $200,000 | $58,492 | $43,000 | $15,492 | 36.0% |
| 19 | Maine | $200,000 | $59,379 | $44,900 | $14,479 | 32.2% |
| 20 | Florida | $250,000 | $75,596 | $57,300 | $18,296 | 31.9% |
| 21 | Arizona | $275,000 | $78,385 | $61,350 | $17,035 | 27.8% |
| 22 | South Dakota | $168,000 | $55,627 | $45,000 | $10,627 | 23.6% |
| 23 | Tennessee | $200,000 | $61,626 | $50,000 | $11,626 | 23.3% |
| 23 | Virginia | $250,000 | $74,729 | $60,600 | $14,129 | 23.3% |
| 25 | Nebraska | $165,000 | $60,583 | $50,000 | $10,583 | 21.2% |
| 26 | Texas | $189,000 | $66,434 | $55,000 | $11,434 | 20.8% |
| 27 | Delaware | $250,000 | $69,416 | $58,000 | $11,416 | 19.7% |
| 28 | North Carolina | $200,000 | $59,502 | $50,000 | $9,502 | 19.0% |
| 28 | Alaska | $250,000 | $74,949 | $63,000 | $11,949 | 19.0% |
| 30 | Wisconsin | $190,000 | $59,428 | $50,000 | $9,428 | 18.9% |
| 31 | Georgia | $200,000 | $61,992 | $54,000 | $7,992 | 14.8% |
| 32 | South Carolina | $175,000 | $53,475 | $47,000 | $6,475 | 13.8% |
| 33 | Michigan | $150,000 | $48,935 | $44,200 | $4,735 | 10.7% |
| 34 | Illinois | $155,000 | $56,230 | $51,000 | $5,230 | 10.3% |
| 35 | Vermont | $200,000 | $62,099 | $57,000 | $5,099 | 8.9% |
| 36 | Ohio | $150,000 | $48,948 | $45,000 | $3,948 | 8.8% |
| 37 | Iowa | $136,000 | $47,254 | $43,640 | $3,614 | 8.3% |
| 38 | Missouri | $150,000 | $48,068 | $45,000 | $3,068 | 6.8% |
| 39 | Indiana | $150,000 | $47,398 | $44,500 | $2,898 | 6.5% |
| 40 | New York | $200,000 | $63,386 | $60,000 | $3,386 | 5.6% |
| 41 | New Mexico | $150,000 | $47,485 | $45,260 | $2,225 | 4.9% |
| 42 | Pennsylvania | $160,000 | $51,119 | $48,800 | $2,319 | 4.8% |
| 43 | Louisiana | $124,000 | $39,114 | $38,000 | $1,114 | 2.9% |
| 44 | Oklahoma | $120,000 | $44,969 | $44,600 | $369 | 0.8% |
| 45 | Kentucky | $125,000 | $42,280 | $43,300 | -$1,020 | -2.4% |
| 46 | North Dakota | $150,000 | $48,785 | $50,800 | -$2,015 | -4.0% |
| 47 | Arkansas | $110,000 | $37,862 | $40,000 | -$2,138 | -5.3% |
| 48 | Kansas | $125,000 | $45,793 | $49,000 | -$3,207 | -6.5% |
| 49 | Alabama | $120,000 | $39,239 | $42,500 | -$3,261 | -7.7% |
| 50 | West Virginia | $90,000 | $29,114 | $35,000 | -$5,886 | -16.8% |
| 51 | Mississippi | $85,000 | $29,523 | $38,800 | -$9,277 | -23.9% |
Consumers view starter homes as a balance between affordability and compromise
For many consumers, a starter home is defined by the trade-offs it requires. More than a third (36%) say a starter home is simply more affordable than other homes in the area. Meanwhile, 33% say it has fewer bedrooms or bathrooms than they would ideally want, and 30% say it offers less square footage than they would prefer over the long term.
Other commonly cited characteristics include:
- It requires compromises because of current home prices or interest rates (22%)
- It’s older or has outdated features (20%)
- It needs cosmetic updates but is livable (19%)
- It’s a practical first step toward homeownership, even if it isn’t their dream home (18%)
- It’s a condo, townhome or other lower-maintenance property (17%)
- It fits their current life stage, but they would likely move later (15%)
- It has limited outdoor space or no yard (13%)
- It has trade-offs they’d accept to become a homeowner (10%)
- It’s farther from work, schools or amenities than they would prefer (10%)
- It’s in a less central or less desirable location than their ideal home (9%)
Overall, 64% of consumers say it is realistic for a first-time homebuyer to purchase a starter home in their area.
Experts recommend prioritizing financial readiness
With starter homes remaining unaffordable for many households and affordability pressures persisting across much of the country, prospective buyers may need to take a longer-term approach to preparing for homeownership. Schulz recommends the following strategies:
- Improve your credit score. Even modest improvements can help borrowers qualify for more favorable mortgage terms and lower monthly payments.
- Pay down high-interest debt. Lowering credit card balances and other outstanding debt can improve your debt-to-income (DTI) ratio and strengthen your mortgage application.
- Build a larger savings cushion. A down payment is only one part of the cost of homeownership. Buyers should also plan for closing costs, moving expenses, maintenance and unexpected repairs.
- Assess your readiness realistically. If purchasing a home today would leave you financially stretched, continuing to rent while improving your financial position may be the better long-term choice.
- Focus on long-term financial stability, not just homeownership. Buying a home is an important milestone, but the objective should be sustainable ownership rather than simply completing a purchase.
Methodology
LendingTree analyzed 2024 IPUMS USA American Community Survey (ACS) one-year microdata to estimate whether nonhomeowner households in each state could afford a starter home. Starter homes were defined as the weighted 25th percentile value of owner-occupied homes in each state. Median nonhomeowner income was also calculated at the state level using the same data.
Researchers then estimated the income needed to afford each state’s starter home using a standard mortgage underwriting framework. The model assumed a 30-year fixed-rate mortgage, a 10% down payment and a 30% front-end debt-to-income cap.
The mortgage-rate assumption was set at 6.72%, based on the average of Freddie Mac’s weekly 30-year fixed mortgage rates across 2024. Private mortgage insurance was set at 0.61% annually on the loan amount, based on the midpoint of Urban Institute Housing Finance Policy Center PMI benchmarks for borrowers putting 10% down.
For each state, LendingTree estimated a monthly housing payment that included principal and interest, property taxes, homeowners insurance and PMI. Property tax rates were calculated using Census Bureau ACS data on property taxes paid and home values, then applied to each state’s starter-home value.
Homeowners insurance costs came from LendingTree researchers’ analysis of rate data pulled in February 2026 from Quadrant Information Services. These rates were publicly sourced from insurer filings and are intended for comparative purposes only, so individual quotes will likely differ.
To better align insurance assumptions with home values, each state’s dwelling coverage was approximated to the nearest available benchmark of $200,000, $350,000 or $500,000 based on that state’s starter-home value. Unless otherwise noted, the insurance assumptions also used:
- Personal liability: $100,000
- Medical payments: $1,000
- Deductible: $1,000
After estimating the full monthly payment for a starter home in each state, LendingTree converted that figure into the minimum annual income needed to qualify under the 30% front-end DTI threshold. Researchers then compared that figure with the weighted median income of nonhomeowner households in each state to calculate the affordability gap and estimate the share able to afford a starter home.
Separately, LendingTree commissioned QuestionPro to conduct an online survey of 2,000 U.S. consumers ages 18 to 80 from June 2 to 11, 2026. The survey was administered using a nonprobability-based sample, and quotas were used to help ensure the sample reflected the overall population. Researchers reviewed all responses for quality control.
We defined generations as the following ages in 2026:
- Generation Z: 18 to 29
- Millennials: 30 to 45
- Generation X: 46 to 61
- Baby boomers: 62 to 80
View mortgage loan offers from up to 5 lenders in minutes