The Single-Parent Housing Divide: Best and Worst Metros for Renting and Owning
Homeownership has long been seen as a path to lasting stability. But for single parents, that path can be riddled with obstacles — especially in certain parts of the country.
According to a LendingTree study, single parents in some U.S. metros are more than twice as likely to own a home as those in the most challenging metros. Further, housing costs consume a vastly different share of single-parent incomes across the country. Find our full analysis and data below.
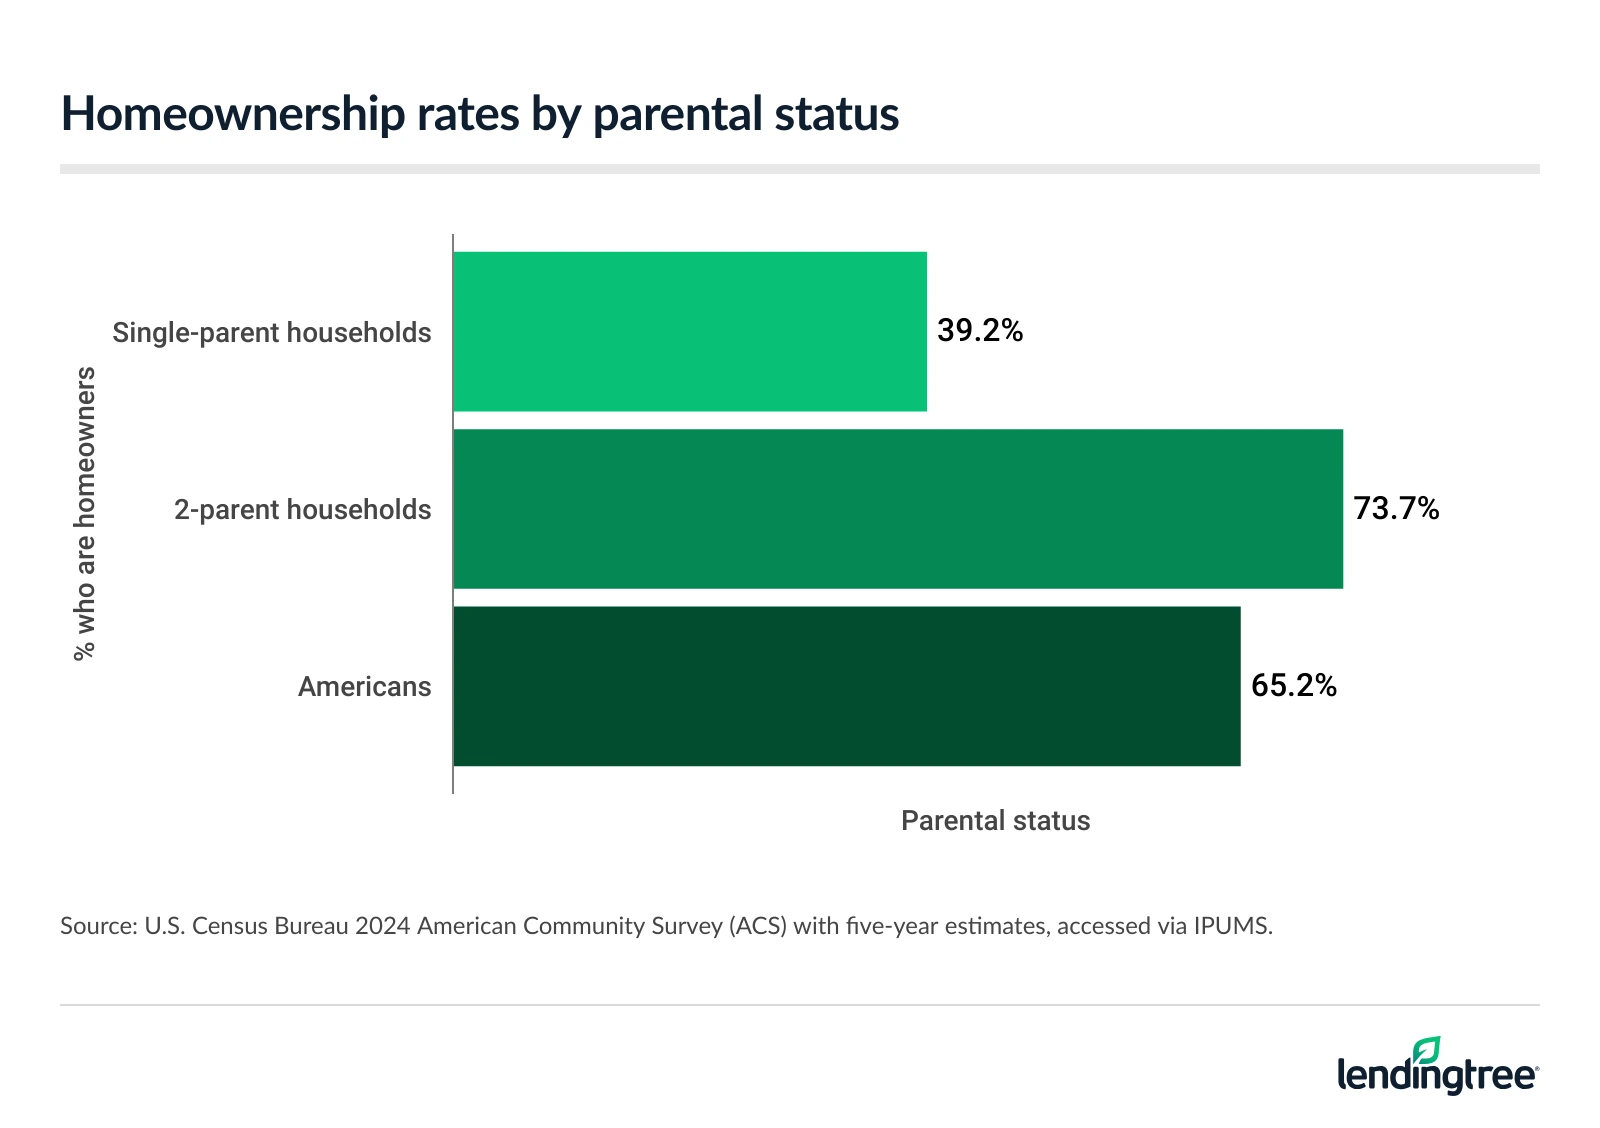
- Nationally, 39.2% of single parents are homeowners. Comparatively, 73.7% of two-parent households, and 65.2% of Americans overall, own a home. Single-parent owners spend 25.7% of their income on housing, while single-parent renters spend 40.9% — above the commonly recommended 30% threshold.
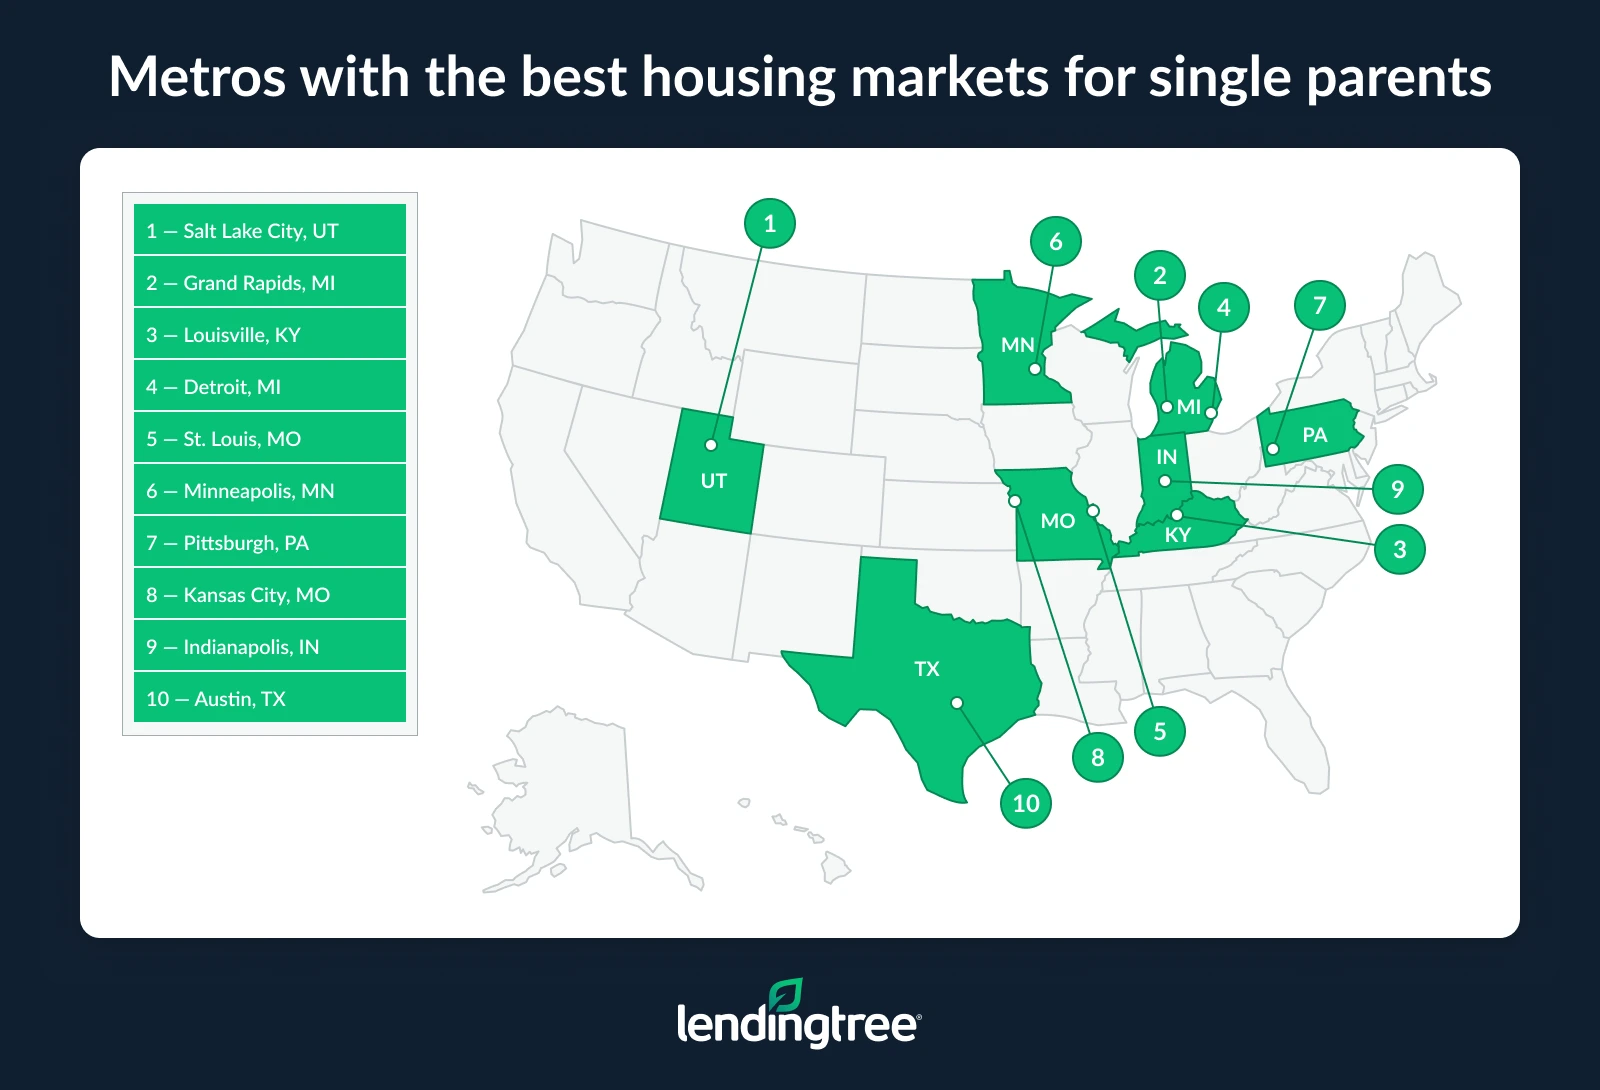
- Salt Lake City, Grand Rapids, Mich., and Louisville, Ky., rank as the best large metros for single-parent owners and renters. In contrast, Los Angeles, New York and San Diego are the worst for single parents.
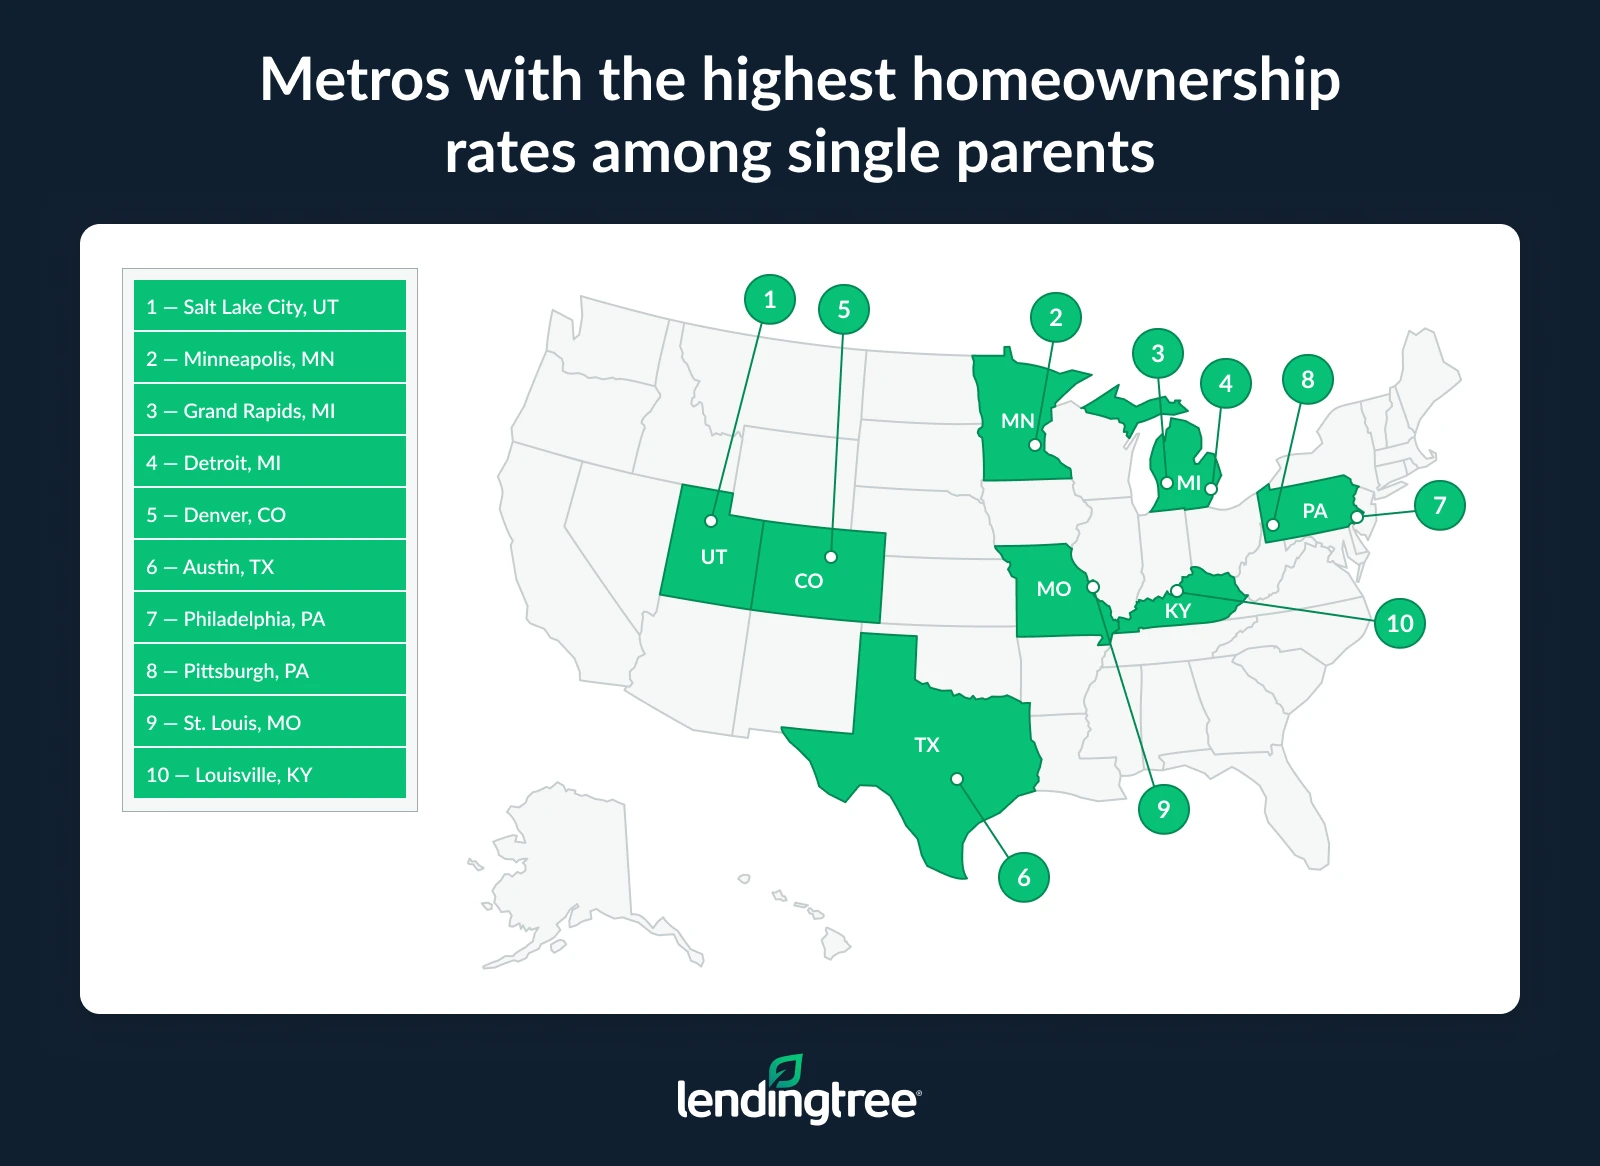
- Salt Lake City has the highest rate of single-parent homeownership at 52.2%, followed by Minneapolis (48.4%) and Grand Rapids (48.1%). Meanwhile, Los Angeles (24.3%), New York (27.2%) and Memphis, Tenn. (28.1%), have the lowest rates. That means that single parents in Salt Lake City are more than twice as likely to own homes compared to those in Los Angeles.
- In Indianapolis, Louisville and Raleigh, N.C., single-parent homeowners spend the smallest share of their income on housing. In high-cost metros, the picture looks very different: In Los Angeles (31.8%), New York (31.6%) and San Diego and Miami (both 30.4%), single parents spend more than 30% of their income on ownership costs.
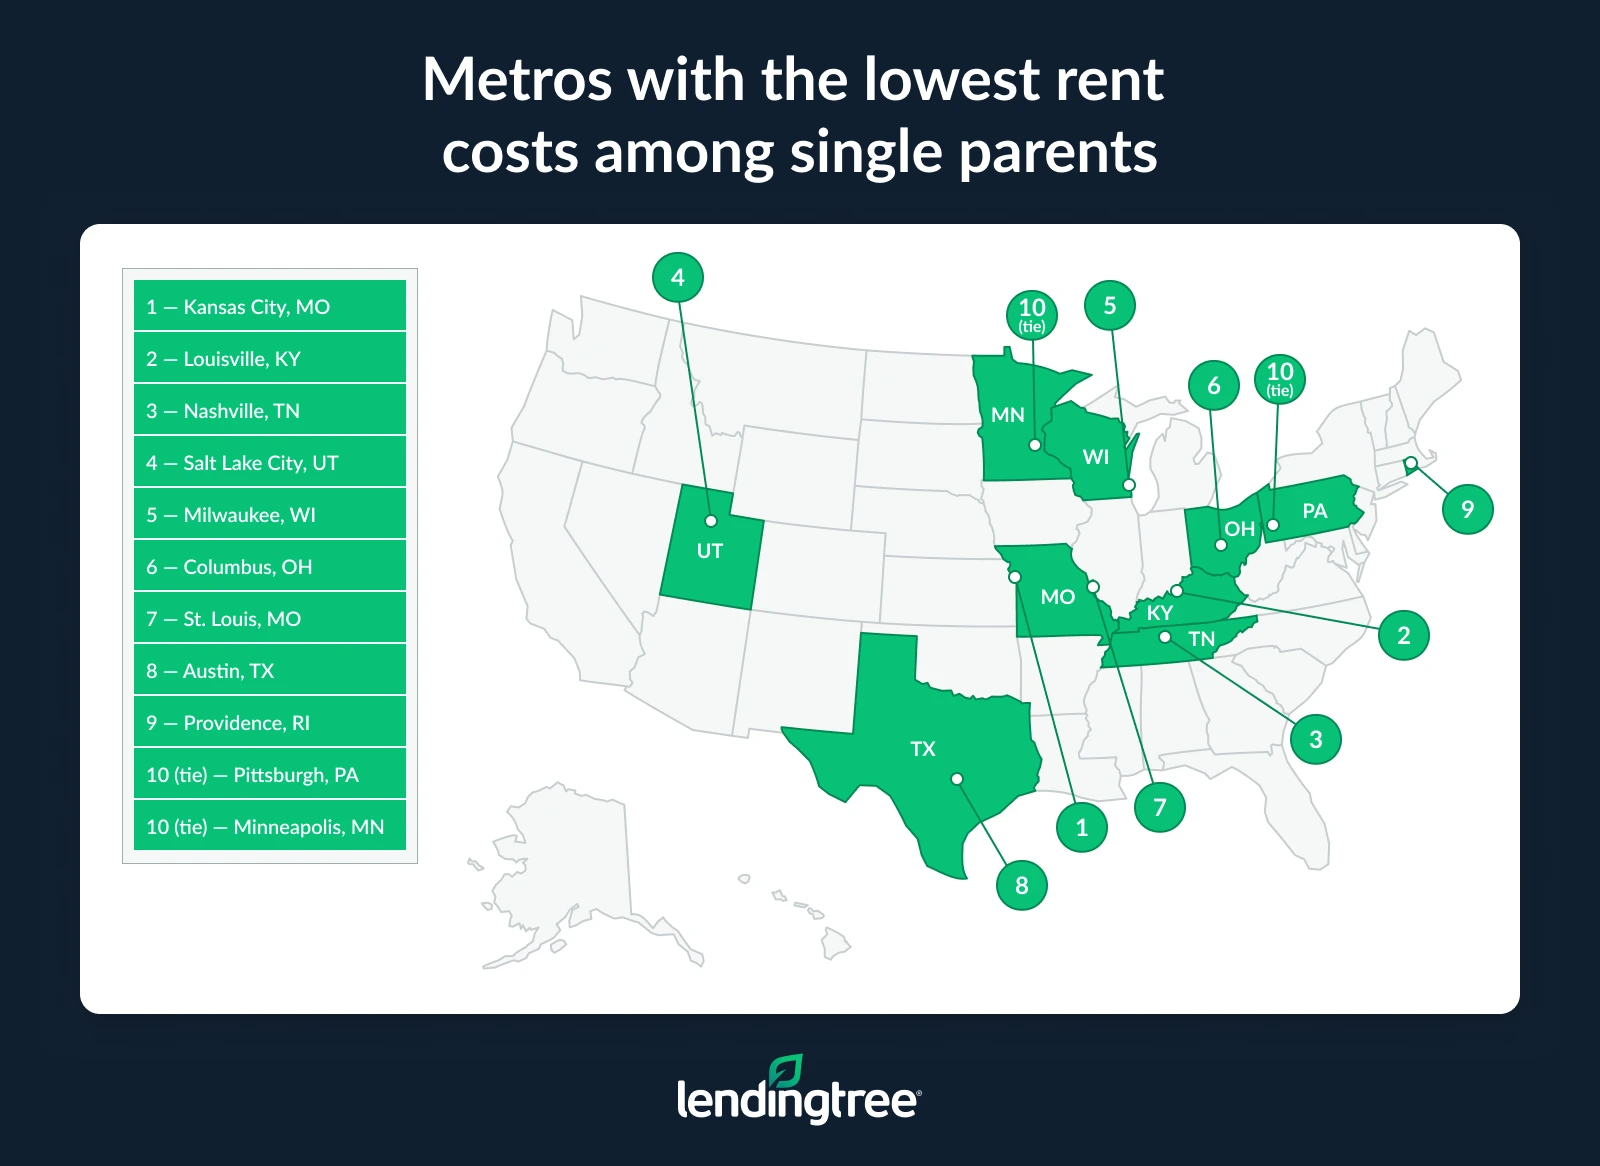
- When it comes to renting, single parents in Kansas City, Mo., Louisville and Nashville, Tenn., spend between 36.0% and 37.0% of their income on rent — the lowest among the 50 largest metros. At the other end, single-parent renters in Miami (53.3%), Orlando, Fla. (47.6%), and Riverside, Calif. (46.8%), face the highest cost burdens, with housing taking up a much larger share of their income.
Nearly 2 in 5 single parents are homeowners
Across the U.S.,39.2% of single parents — only about 2 in 5 — are homeowners. Meanwhile, 73.7% of two-parent households and 65.2% of Americans overall own their home.
“Single parents are trying to build a financial future on one income in a market that increasingly feels designed for two,” says Matt Schulz, LendingTree chief consumer finance analyst and author of “Ask Questions, Save Money, Make More: How to Take Control of Your Financial Life.”
“When you’re balancing housing costs, childcare, healthcare and everyday bills without a second paycheck to fall back on, saving for a down payment becomes dramatically harder,” he explains.
That explains, too, why the cost of housing can be so burdensome to single parents. Homeowners in the demographic spend an average of 25.7% of their income on housing, while single-parent renters spend a whopping 40.9% — significantly above the commonly cited 30% rule of thumb.
“Homeownership can be especially meaningful for single-parent families because it often creates stability in a world that can feel financially fragile,” Schulz says. “On the flip side, when homeownership is out of reach, families are often more vulnerable to rent hikes, forced moves and financial stress that can spill into nearly every area of life. That stuff matters.”
While the rate of rent increases has been slowing since 2020, it did spike amid the pandemic, locking vulnerable populations like single parents into higher overall housing payments. According to Zillow estimates, the average rental payment in the U.S. as of May 2026 is $2,000 per month, compared to an average of about $1,700 for a mortgage payment. When rent goes up, setting money aside for a down payment can become even more difficult, prolonging the cycle.
Salt Lake City is the best large metro for single-parent homeownership
The story does vary, however, depending on where single parents are based in the U.S. According to our analysis, which is based on both the rate of homeownership and affordability, Salt Lake City, Grand Rapids, Mich., and Louisville, Ky., are the best large metros for single-parent owners and renters.
“The metros that tend to work best for single parents usually strike a balance between decent wages and relatively affordable housing,” Schulz says. “Places like Salt Lake City, Grand Rapids and Louisville generally offer lower housing costs than the biggest coastal areas while still providing economic opportunity and communities where families can realistically put down roots.”
Notably, however, according to data from the 2024 Census, median mortgage and rental costs were slightly higher in Salt Lake City than the national median (though substantially lower in Grand Rapids; information for Louisville wasn’t available). Since fewer people tend to move to these cities than to the larger coastal ones that Schulz references, some of the affordability may also be due to single parents holding onto homes they’d already owned. (Homeowner costs without mortgages are significantly lower in most cases.)
Unsurprisingly, the cities that rank the worst for single parents in terms of share of ownership and affordability are led by Los Angeles, New York and San Diego. In these areas, Schulz says, “housing costs have so badly outpaced incomes.”
“Even solid earners can struggle there, and for single parents relying on one income, the math often just doesn’t work,” he says.
Indeed, according to 2024 Census data, the median homeownership cost with a mortgage in each of these three cities tops $3,200, compared with a national median of $1,963.
More than half of single parents are homeowners in one metro
Salt Lake City stands out among America’s largest metros: It has the highest rate of single-parent homeownership, with more than half (52.2%) of single-parent families there owning their homes.
That’s more than double the single-parent homeownership rate in Los Angeles (24.3%), suggesting that it’s significantly easier for single parents in Salt Lake City to achieve homeownership than those in L.A. Other cities topping the list for single-parent homeownership rates include Minneapolis (48.4%) and Grand Rapids (48.1%).
“A lot of this comes down to affordability,” Schulz says. “In places where starter homes still exist and where families can buy in decent neighborhoods without stretching every dollar, homeownership rates are naturally going to be higher. In high-cost metros, on the other hand, even households with above-average incomes may not qualify for homes near jobs or schools. That creates a situation where many single parents remain long-term renters, not because they don’t want to own, but because the barrier to entry is simply too high.”
It’s no surprise, then, that Los Angeles and New York land at the bottom of the list, with single-parent homeownership rates of 24.3% and 27.2%, respectively. The third-lowest city, Memphis, Tenn. (28.1%), may seem more like an outlier. But according to Census data, the median household income in Memphis is substantially lower than the national ($51,736 versus $80,734), which may play into this finding.
Single parents in Indianapolis spend the least on homeownership costs
Keeping a roof over the family’s head is, for most Americans, the single largest monthly expense, no matter where they live. But your income does impact just how big a bite the cost of homeownership takes from your budget.
Single-parent homeowners in Indianapolis (21.7%), Louisville (22.0%) and Raleigh, N.C. (22.5%), spend the smallest share of their income on housing. These figures are well below the 30% housing-cost guideline mentioned above.
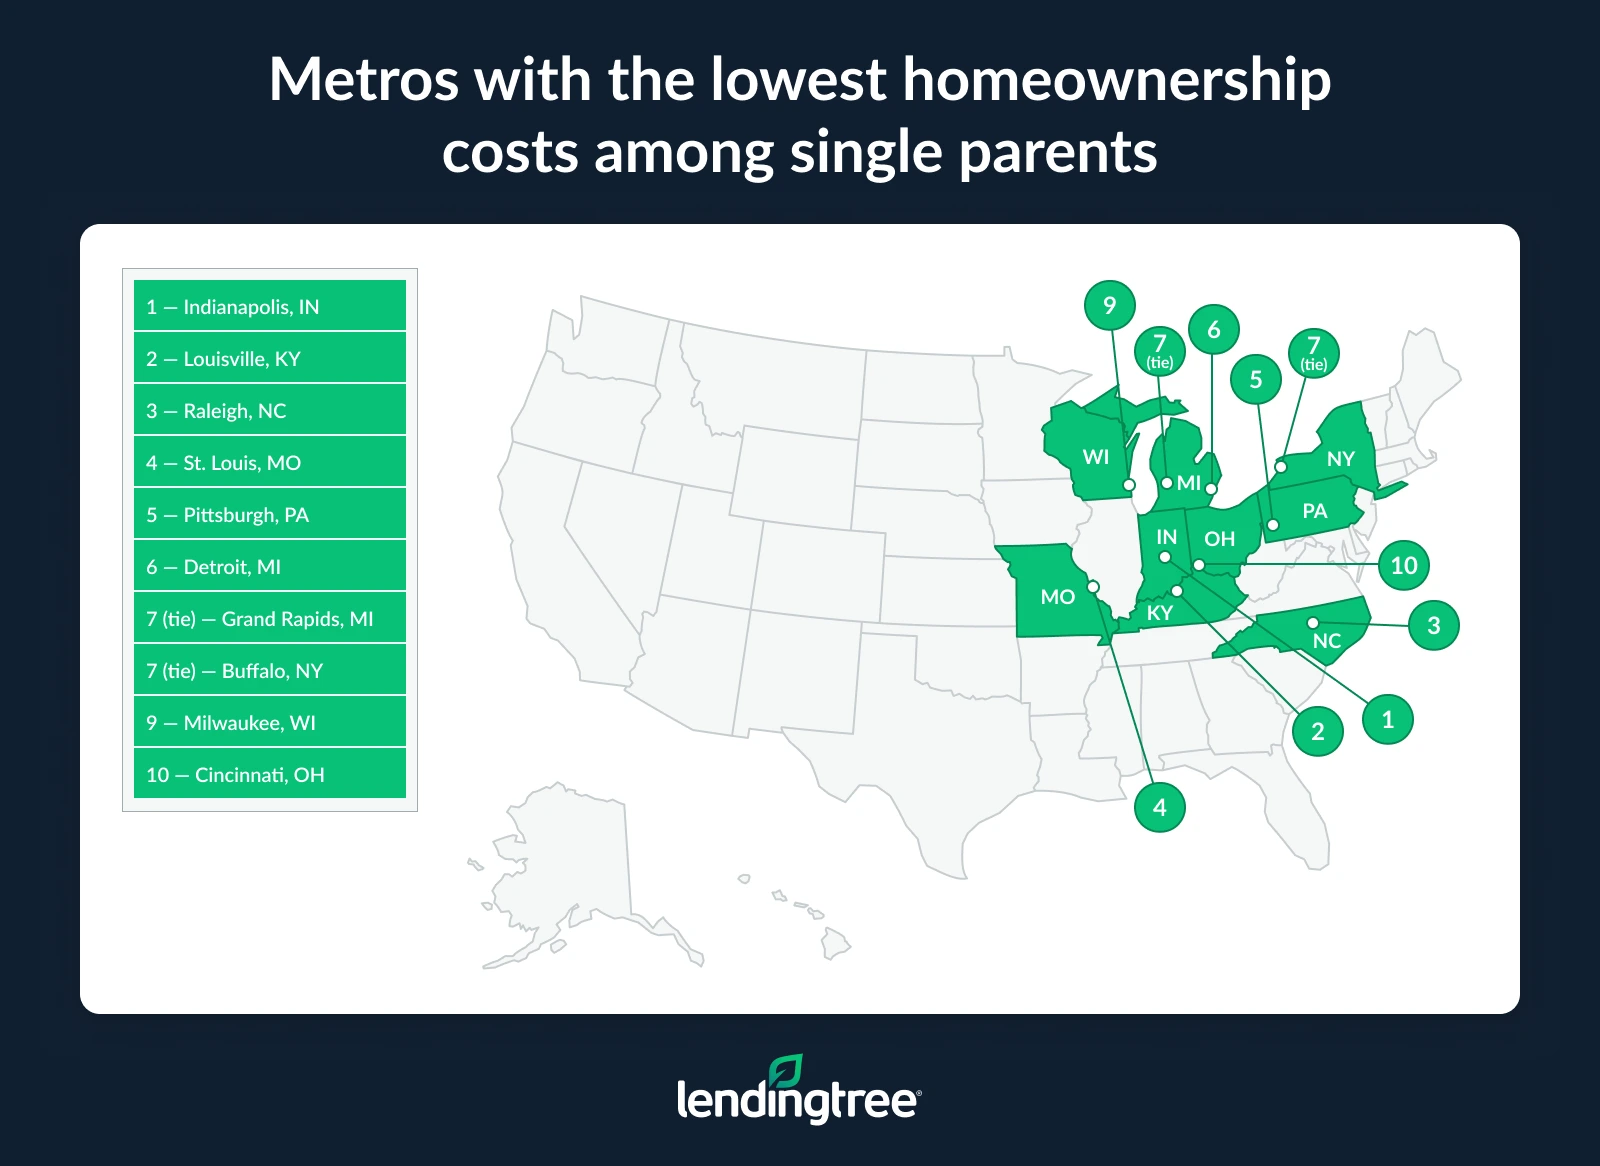
Meanwhile, single-parent homeowners in higher-cost metros are often spending above that threshold: 31.8% in Los Angeles, 31.6% in New York and 30.4% in both San Diego and Miami.
“In places like Indianapolis, Louisville and Raleigh, housing simply consumes a smaller share of income, which gives families more breathing room,” Schulz says. “When you’re not pouring every spare dollar into housing costs, you’re better able to save for emergencies as well as for your long-term goals. That financial flexibility matters enormously for single parents because there’s often no backup income if something goes wrong.”
This is not the case for those in high-cost metros, Schulz says. “When housing eats up 30% or more of income, there’s very little margin for error, and even a small financial shock can create serious instability.”
Single-parent Florida renters face the steepest housing cost burdens
For single parents who can’t quite make the leap into homeownership, the cost of staying sheltered can be even more burdensome. In all 50 of America’s largest metros, single parents paying rent spend more than 30% of their income on housing.
Single parents in Kansas City, Mo., Louisville and Nashville, Tenn., have it the easiest, though they still spend 36.3%, 36.6% and 36.7% of their income on rent, respectively.
In comparison, single-parent renters in Florida face the steepest housing cost burdens, led by Miami (where rent eats up 53.3% of the monthly budget) and Orlando (47.6%). The second runner-up is Riverside, Calif., where single-parent renters spend 46.8% of their income on housing.
“The markets where rent is relatively manageable tend to be places where housing supply has remained more aligned with local incomes,” Schulz explains. “Kansas City, Louisville and Nashville are far from cheap, but renters there generally get more housing for their money than they would in places like Miami or Orlando.”
Spending half of your income (or more) on rent has a serious impact on your ability to achieve financial — and even emotional — stability, Schulz says. “Single parents in high-cost rental markets may struggle to save, pay down debt or eventually transition into homeownership. It can also force some really tough choices. Ultimately, affordable rent doesn’t just help financially. It can improve the overall quality of your life by reducing stress and giving families more flexibility.”
Below, we’ve included the full rankings of the 50 largest American metros. Note: Half of the single-parent housing index is based on the homeownership rate of single parents in that metro, while the other half is a combination of the affordability indices for ownership and rent. Those affordability scores, in turn, are based on the costs of ownership or rent for single parents in each metro.
Full rankings: The best/worst housing markets for single parents (by metro)
| Rank | Metro | Homeownership rate (%) | Homeownership index | Ownership cost (%) | Rent cost (%) | Affordability index (ownership) | Affordability index (rent) | Affordability index (combined) | Single-parent housing index |
|---|---|---|---|---|---|---|---|---|---|
| 1 | Salt Lake City, UT | 52.2% | 100.0 | 27.2% | 36.8% | 45.5 | 97.1 | 71.3 | 85.7 |
| 2 | Grand Rapids, MI | 48.1% | 85.3 | 23.8% | 39.8% | 79.2 | 79.4 | 79.3 | 82.3 |
| 3 | Louisville, KY | 42.9% | 66.7 | 22.0% | 36.6% | 97.0 | 98.2 | 97.6 | 82.1 |
| 4 | Detroit, MI | 47.5% | 83.2 | 23.4% | 41.0% | 83.2 | 72.4 | 77.8 | 80.5 |
| 5 | St. Louis, MO | 43.0% | 67.0 | 22.7% | 37.8% | 90.1 | 91.2 | 90.6 | 78.8 |
| 6 | Minneapolis, MN | 48.4% | 86.4 | 26.5% | 38.6% | 52.5 | 86.5 | 69.5 | 77.9 |
| 7 | Pittsburgh, PA | 43.2% | 67.7 | 22.9% | 38.6% | 88.1 | 86.5 | 87.3 | 77.5 |
| 8 | Kansas City, MO | 42.2% | 64.2 | 24.3% | 36.3% | 74.3 | 100.0 | 87.1 | 75.6 |
| 9 | Indianapolis, IN | 42.2% | 64.2 | 21.7% | 41.3% | 100.0 | 70.6 | 85.3 | 74.7 |
| 10 | Austin, TX | 43.5% | 68.8 | 26.1% | 37.9% | 56.4 | 90.6 | 73.5 | 71.2 |
| 11 | Raleigh, NC | 40.8% | 59.1 | 22.5% | 41.5% | 92.1 | 69.4 | 80.7 | 69.9 |
| 12 | Denver, CO | 45.4% | 75.6 | 25.8% | 41.8% | 59.4 | 67.6 | 63.5 | 69.6 |
| 13 | Cincinnati, OH | 39.2% | 53.4 | 24.0% | 38.9% | 77.2 | 84.7 | 81.0 | 67.2 |
| 14 | Phoenix, AZ | 41.7% | 62.4 | 24.7% | 41.7% | 70.3 | 68.2 | 69.3 | 65.8 |
| 15 | Richmond, VA | 40.9% | 59.5 | 25.4% | 39.9% | 63.4 | 78.8 | 71.1 | 65.3 |
| 16 | Buffalo, NY | 40.5% | 58.1 | 23.8% | 42.2% | 79.2 | 65.3 | 72.3 | 65.2 |
| 17 | Philadelphia, PA | 43.4% | 68.5 | 25.8% | 42.4% | 59.4 | 64.1 | 61.8 | 65.1 |
| 18 | Nashville, TN | 37.0% | 45.5 | 24.6% | 36.7% | 71.3 | 97.6 | 84.5 | 65.0 |
| 18 | Washington, DC | 41.1% | 60.2 | 25.5% | 40.2% | 62.4 | 77.1 | 69.7 | 65.0 |
| 20 | Charlotte, NC | 39.1% | 53.0 | 24.7% | 41.2% | 70.3 | 71.2 | 70.7 | 61.9 |
| 21 | Cleveland, OH | 36.7% | 44.4 | 24.4% | 38.9% | 73.3 | 84.7 | 79.0 | 61.7 |
| 22 | Birmingham, AL | 39.8% | 55.6 | 26.2% | 39.8% | 55.4 | 79.4 | 67.4 | 61.5 |
| 22 | Baltimore, MD | 40.4% | 57.7 | 25.4% | 41.9% | 63.4 | 67.1 | 65.2 | 61.5 |
| 24 | Atlanta, GA | 42.0% | 63.4 | 25.9% | 43.7% | 58.4 | 56.5 | 57.4 | 60.4 |
| 25 | Oklahoma City, OK | 40.0% | 56.3 | 25.7% | 42.2% | 60.4 | 65.3 | 62.8 | 59.6 |
| 26 | San Antonio, TX | 39.8% | 55.6 | 25.4% | 43.2% | 63.4 | 59.4 | 61.4 | 58.5 |
| 27 | Columbus, OH | 31.8% | 26.9 | 24.2% | 37.2% | 75.2 | 94.7 | 85.0 | 55.9 |
| 27 | Portland, OR | 41.2% | 60.6 | 28.4% | 41.6% | 33.7 | 68.8 | 51.2 | 55.9 |
| 29 | Milwaukee, WI | 30.5% | 22.2 | 23.9% | 37.1% | 78.2 | 95.3 | 86.8 | 54.5 |
| 30 | Tampa, FL | 41.4% | 61.3 | 27.4% | 46.2% | 43.6 | 41.8 | 42.7 | 52.0 |
| 31 | Sacramento, CA | 37.9% | 48.7 | 27.6% | 41.9% | 41.6 | 67.1 | 54.3 | 51.5 |
| 32 | Chicago, IL | 39.4% | 54.1 | 28.1% | 43.1% | 36.6 | 60.0 | 48.3 | 51.2 |
| 33 | Seattle, WA | 39.0% | 52.7 | 28.0% | 43.7% | 37.6 | 56.5 | 47.0 | 49.9 |
| 34 | Providence, RI | 35.5% | 40.1 | 30.2% | 38.4% | 15.8 | 87.6 | 51.7 | 45.9 |
| 35 | Dallas, TX | 34.7% | 37.3 | 27.5% | 42.6% | 42.6 | 62.9 | 52.8 | 45.0 |
| 36 | Virginia Beach, VA | 31.6% | 26.2 | 27.3% | 40.4% | 44.6 | 75.9 | 60.2 | 43.2 |
| 37 | San Jose, CA | 30.9% | 23.7 | 26.6% | 41.2% | 51.5 | 71.2 | 61.3 | 42.5 |
| 38 | Houston, TX | 34.2% | 35.5 | 27.1% | 44.6% | 46.5 | 51.2 | 48.9 | 42.2 |
| 39 | Jacksonville, FL | 38.0% | 49.1 | 29.5% | 45.9% | 22.8 | 43.5 | 33.2 | 41.1 |
| 40 | Las Vegas, NV | 33.8% | 34.1 | 26.3% | 46.6% | 54.5 | 39.4 | 46.9 | 40.5 |
| 41 | Boston, MA | 36.6% | 44.1 | 29.8% | 44.7% | 19.8 | 50.6 | 35.2 | 39.6 |
| 42 | San Francisco, CA | 32.3% | 28.7 | 29.1% | 42.8% | 26.7 | 61.8 | 44.2 | 36.5 |
| 43 | Riverside, CA | 36.3% | 43.0 | 29.8% | 46.8% | 19.8 | 38.2 | 29.0 | 36.0 |
| 44 | Orlando, FL | 36.7% | 44.4 | 29.7% | 47.6% | 20.8 | 33.5 | 27.2 | 35.8 |
| 45 | Memphis, TN | 28.1% | 13.6 | 26.2% | 44.2% | 55.4 | 53.5 | 54.5 | 34.1 |
| 46 | Fresno, CA | 30.0% | 20.4 | 26.4% | 46.7% | 53.5 | 38.8 | 46.1 | 33.3 |
| 47 | Miami, FL | 35.6% | 40.5 | 30.4% | 53.3% | 13.9 | 0.0 | 6.9 | 23.7 |
| 48 | San Diego, CA | 29.1% | 17.2 | 30.4% | 46.3% | 13.9 | 41.2 | 27.5 | 22.4 |
| 49 | New York, NY | 27.2% | 10.4 | 31.6% | 45.0% | 2.0 | 48.8 | 25.4 | 17.9 |
| 50 | Los Angeles, CA | 24.3% | 0.0 | 31.8% | 46.4% | 0.0 | 40.6 | 20.3 | 10.1 |
How single parents can navigate the housing market: 5 expert tips
The housing market may feel daunting, and doubly so for single parents. Still, there are tips and tricks that can help you navigate it with as much ease and financial flexibility as possible.
- Focus on the monthly payment, not just the sticker price. “A home that technically fits your budget can still leave you financially stretched if taxes, insurance and other associated costs are too high,” Schulz says. Always be sure to get an all-inclusive estimate of the monthly payment from your prospective mortgage lender, and don’t forget to factor in hidden costs like maintenance and repairs. In some instances, renting can be cheaper than owning. A rent-versus-buy calculator can help you truly understand the costs on either side of the equation.
- Don’t assume you need a huge down payment. “Many first-time buyer programs, local grants and low-down-payment loans exist specifically to help buyers who may not have massive savings,” Schulz explains. Of course, putting down more can help lower your monthly payment and increase your equity faster. It just doesn’t necessarily have to be a barrier to getting your foot in the door.
- Build — and protect — your emergency fund. “Growing savings can be easier said than done, especially for single parents. But it’s hugely important,” Schulz says. “Single parents often don’t have the luxury of a second income during emergencies, so having cash reserves is especially important.”
- Prioritize stability over perfection. When shopping the market, “the goal doesn’t have to be your forever home right away,” Schulz says. “Sometimes the best move is simply finding a safe, affordable place that allows you to build equity and financial confidence.”
- Don’t be afraid to ask for help — and to shop around. Local housing agencies and nonprofits can offer programs and guidance, often for no cost, and querying different lenders gives you the best opportunity to find the lowest interest rate. That little bit of extra research can help homeowners save thousands over the life of their mortgage, Schulz says.
Methodology
LendingTree researchers analyzed data from the 2024 American Community Survey (ACS) with five-year estimates, accessed via IPUMS. Single-parent households are defined as those with a householder who has no spouse or partner present and at least one child younger than 18. The analysis is limited to occupied housing units. Housing cost measures include median monthly gross rent and median monthly ownership costs, which reflect total monthly expenses for renters and homeowners, including utilities, fees and taxes.
The 50 largest metros are ranked using a single-parent housing index, which combines two components:
- Homeownership: The share of single-parent households that own their homes
- Affordability: The weighted median share of household income spent on housing, calculated separately for owners and renters
Each component is scaled from 0 to 100, and the final index gives equal weight to homeownership and affordability. Higher scores indicate more favorable housing conditions for single-parent households.
View mortgage loan offers from up to 5 lenders in minutes