Businesses Most Optimistic About Performance and Demand, Less So About Hiring
American businesses are feeling cautiously upbeat heading into the second half of 2026, but optimism is far from universal.
LendingTree research finds that while confidence in future business performance has improved over the past year, the majority of businesses still expect conditions to remain largely the same across other growth measures. Where businesses operate, how many people they employ and what industry they’re in all play a role in how rosy (or not) their outlook is.
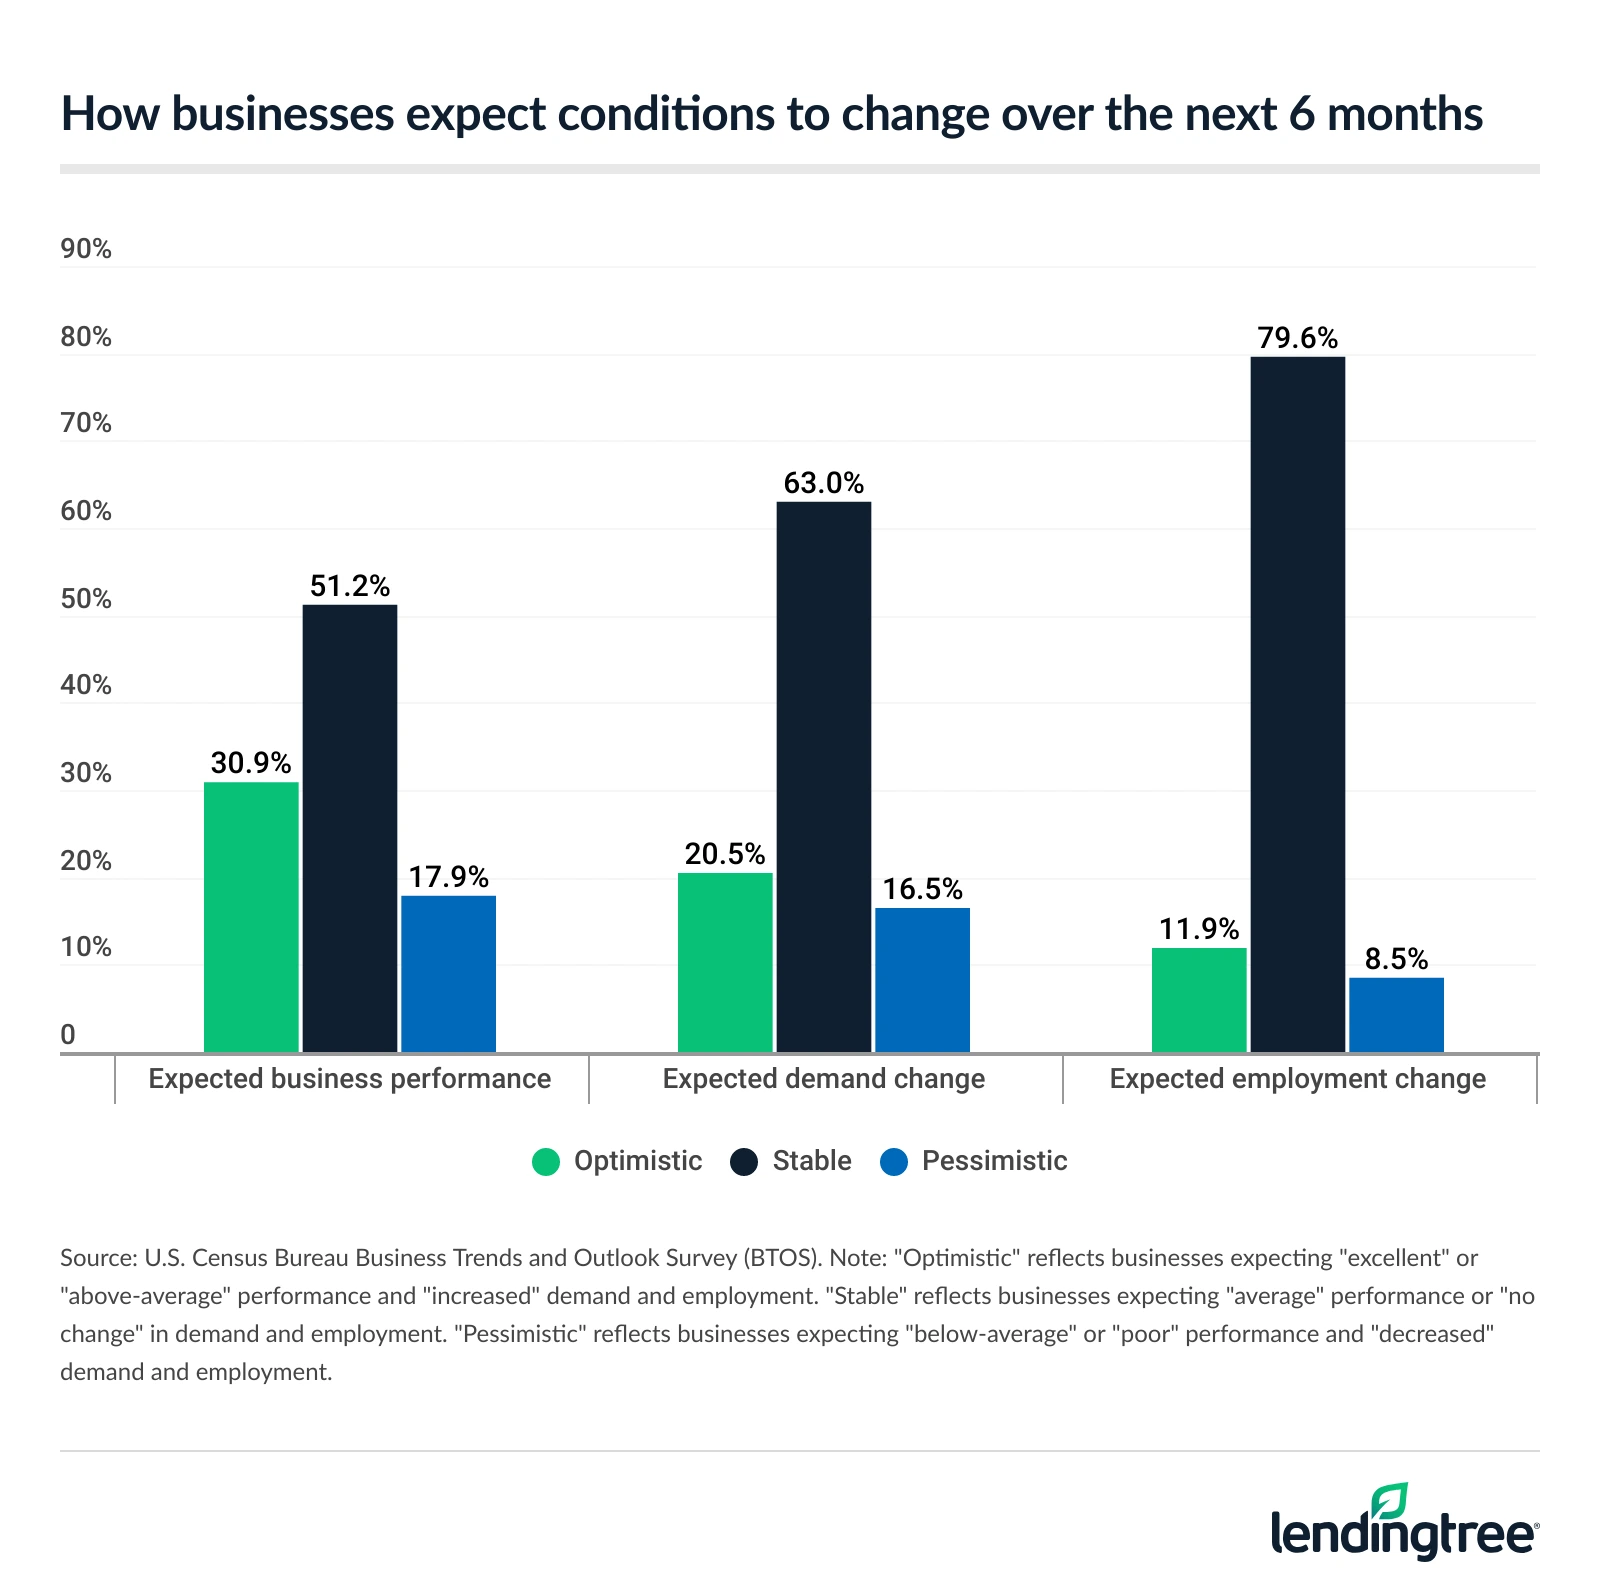
- Business optimism is highest around future business performance, with nearly 1 in 3 businesses (30.9%) expecting strong results over the next six months. Businesses are next most optimistic about demand growth (20.5%) and employment growth (11.9%). Across all three measures, however, the majority of businesses expect conditions to remain largely the same: 51.2% expect no change for performance, 63.0% for demand and 79.6% for employment.
- Montana businesses are the most optimistic in the nation, while neighboring North Dakota ranks last. Missouri and Ohio tie for second overall for high levels of optimism, while large states, such as California, Florida, Texas and New York, are absent from the top 10. Specifically, Missouri leads in performance expectations (40.0%), Delaware leads in demand growth expectations (27.6%) and Alaska tops employment growth expectations (23.6%).
- Business optimism rises sharply with firm size. Businesses with 50 or more employees are more than twice as likely to expect employment growth as smaller firms (34.1% versus 13.9%). Larger businesses also report substantially higher confidence in future business performance (45.9% versus 32.0%) and demand growth (31.9% versus 21.4%).
- Utilities is the most optimistic sector heading into the next six months, while retail trade ranks last. The finance and insurance sector leads confidence in future business performance, with 47.4% of businesses expecting strong results. Manufacturers are the most likely to expect employment growth (16.7%), while utilities leads demand expectations, with 31.6% of businesses expecting growth.
Nearly 1 in 3 businesses expect strong performance over the next 6 months
Business optimism is strong when it comes to future business performance. Notably, 30.9% of businesses expect strong results over the next six months. Meanwhile, 20.5% expect demand growth, and 11.9% believe there will be employment growth.
Matt Schulz, LendingTree chief consumer finance analyst and author of “Ask Questions, Save Money, Make More: How to Take Control of Your Financial Life,” believes that a lot of this optimism might come from businesses getting more comfortable operating amid uncertainty in the past year.
“There are still many unknowns complicating things for businesses, but we’ve also seen that consumers have remained pretty resilient in the face of economic headwinds,” he says. “Businesses can take some comfort in that. If they and their customers have successfully navigated the past year, there’s reason to believe they’ll be able to do the same over the next six months, too.”
That said, businesses may not be able to get too comfortable. “If unemployment spikes, inflation jumps higher or global events heat up, all that optimism could vanish in a hurry,” Schulz says.
Perhaps because of these factors, businesses have largely tempered expectations. Most expect holding steady rather than breaking out — 51.2% of businesses expect performance to remain unchanged, while 63.0% expect as much for demand, and 79.6% for employment.
Still, sentiment has improved. The share of businesses expecting strong performance rose from 26.6% in May 2025 to 30.9% in May 2026. Demand growth expectations also increased modestly. Hiring expectations, however, weakened slightly year over year.
Year-over-year change in business optimism
| Measure | % of optimistic businesses, 2025 | % of optimistic businesses, 2026 | % point change |
|---|---|---|---|
| Expected business performance | 26.6% | 30.9% | 4.3 |
| Expected employment change | 12.3% | 11.9% | -0.4 |
| Expected demand change | 19.2% | 20.5% | 1.3 |
Montana businesses are most optimistic
When it comes to where businesses are most optimistic, Montana ranks first, with an optimism index score of 28.0. (Note: Our optimism index takes the simple average of the share of optimistic responses across expected business performance, employment growth and demand growth.)
Missouri and Ohio tie for second overall.
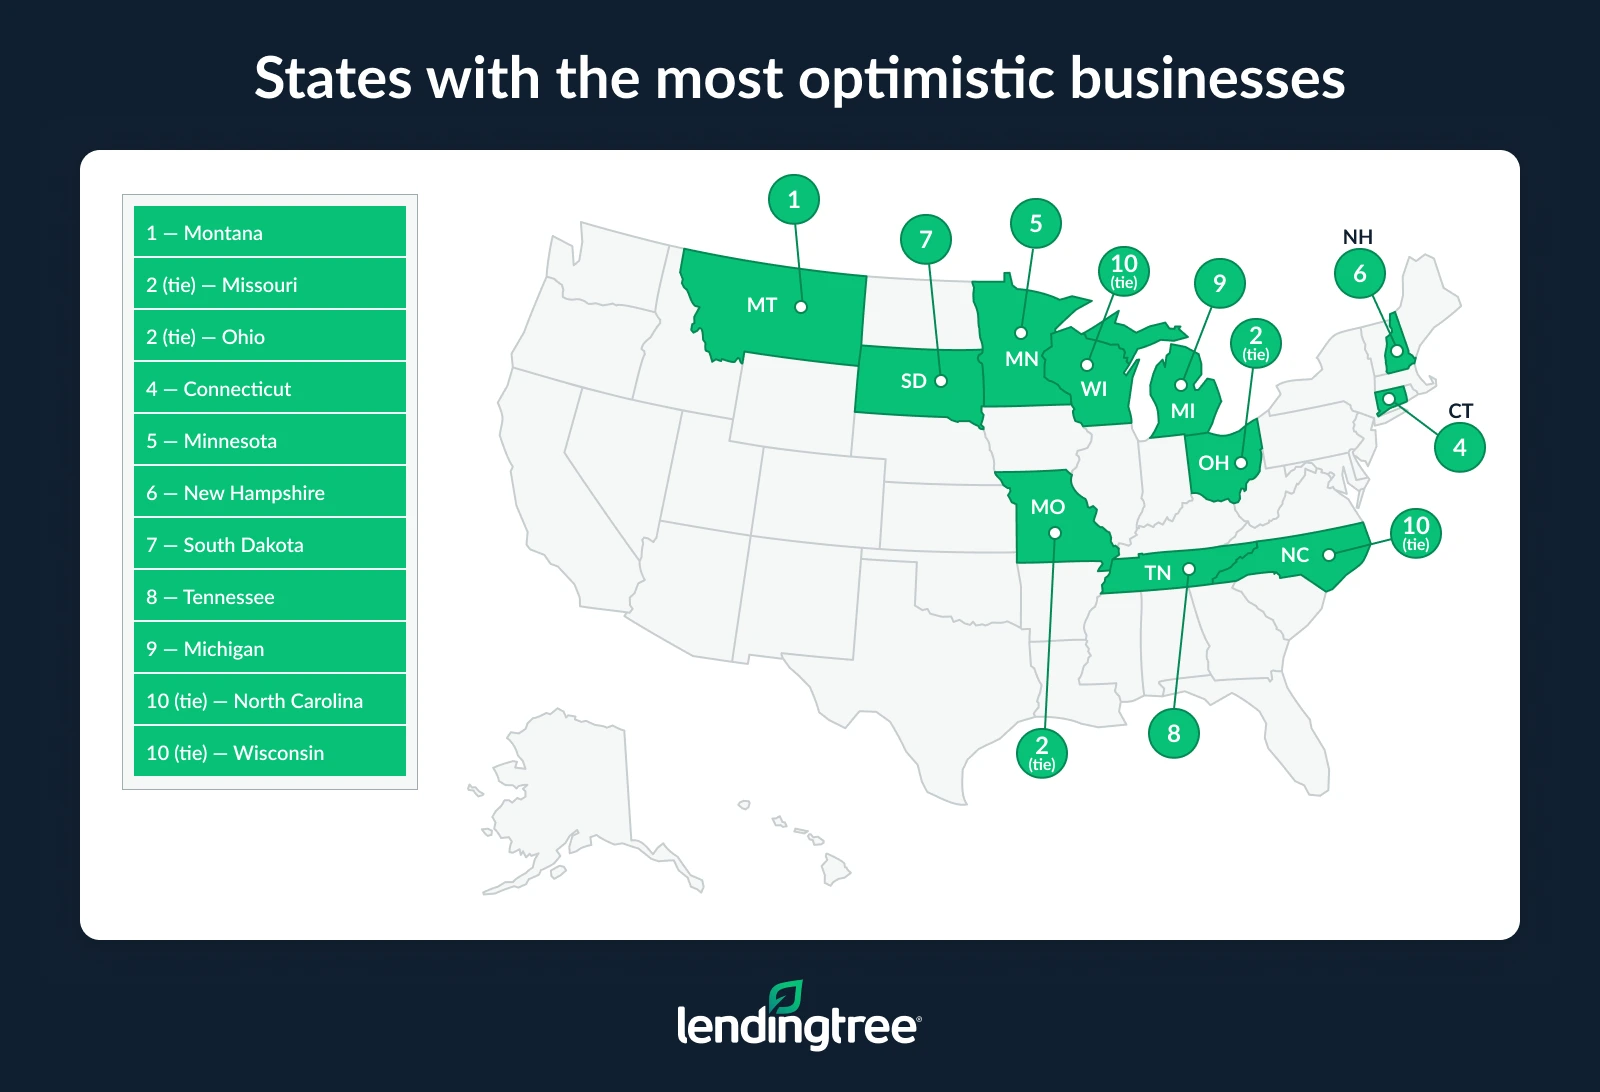
Drilling down by metric, Missouri leads in performance expectations, with 40.0% of businesses there expecting strong performance over the next six months. That’s followed by Connecticut (39.1%) and Montana (38.3%).
Meanwhile, Delaware leads demand growth expectations (27.6%), with New Hampshire (26.8%) and Ohio (26.7%) following. Alaska (23.6%), Delaware (19.9%) and Montana (19.9%) lead when it comes to employment growth expectations.
At the other end of the spectrum, the bottom five states — North Dakota, Kentucky, Wyoming, Nevada and New York — all scored 17.5 or below on our optimism index.
Notably, large states, such as California, Florida, Texas and New York, are absent from the top 10. New York is near the bottom of the rankings, and Florida and California also finished in the bottom 10.
Full rankings: States with the most/least optimistic businesses
| Rank | State | Expecting strong business performance (%) | Expecting employment growth (%) | Expecting demand growth (%) | Optimism index |
|---|---|---|---|---|---|
| 1 | Montana | 38.3% | 19.9% | 25.9% | 28.0 |
| 2 | Missouri | 40.0% | 17.5% | 21.9% | 26.5 |
| 2 | Ohio | 38.2% | 14.6% | 26.7% | 26.5 |
| 4 | Connecticut | 39.1% | 13.3% | 24.1% | 25.5 |
| 5 | Minnesota | 34.8% | 16.9% | 23.9% | 25.2 |
| 6 | New Hampshire | 35.2% | 13.3% | 26.8% | 25.1 |
| 7 | South Dakota | 34.0% | 15.7% | 24.1% | 24.6 |
| 8 | Tennessee | 34.0% | 13.8% | 24.4% | 24.1 |
| 9 | Michigan | 33.6% | 16.9% | 21.0% | 23.8 |
| 10 | North Carolina | 34.6% | 11.7% | 24.1% | 23.5 |
| 10 | Wisconsin | 32.3% | 16.0% | 22.3% | 23.5 |
| 12 | Alaska | 24.9% | 23.6% | 21.4% | 23.3 |
| 13 | Texas | 32.9% | 13.7% | 23.0% | 23.2 |
| 14 | Arizona | 34.5% | 12.9% | 21.5% | 23.0 |
| 15 | Iowa | 37.7% | 10.6% | 19.9% | 22.7 |
| 16 | Delaware | 20.3% | 19.9% | 27.6% | 22.6 |
| 17 | Pennsylvania | 34.0% | 12.9% | 20.3% | 22.4 |
| 18 | Washington | 29.0% | 13.2% | 24.7% | 22.3 |
| 19 | Oklahoma | 37.8% | 10.2% | 18.4% | 22.1 |
| 20 | Maryland | 32.9% | 10.5% | 22.5% | 22.0 |
| 21 | Arkansas | 35.5% | 10.4% | 19.3% | 21.7 |
| 22 | Kansas | 32.9% | 12.3% | 19.4% | 21.5 |
| 23 | Virginia | 32.0% | 13.1% | 18.5% | 21.2 |
| 24 | New Mexico | 35.6% | 14.2% | 13.6% | 21.1 |
| 25 | Indiana | 32.5% | 12.8% | 17.7% | 21.0 |
| 25 | Mississippi | 37.5% | 9.5% | 15.9% | 21.0 |
| 25 | South Carolina | 33.3% | 9.3% | 20.4% | 21.0 |
| 28 | Alabama | 31.0% | 12.7% | 19.0% | 20.9 |
| 29 | Hawaii | 29.0% | 13.9% | 19.4% | 20.8 |
| 30 | Massachusetts | 30.9% | 13.6% | 17.3% | 20.6 |
| 30 | Maine | 23.8% | 14.2% | 23.8% | 20.6 |
| 32 | Georgia | 31.4% | 10.0% | 20.0% | 20.5 |
| 33 | Nebraska | 30.2% | 8.6% | 22.2% | 20.3 |
| 34 | Illinois | 30.4% | 11.0% | 19.3% | 20.2 |
| 34 | New Jersey | 30.2% | 10.7% | 19.8% | 20.2 |
| 36 | Louisiana | 34.0% | 7.3% | 18.5% | 19.9 |
| 37 | Idaho | 25.6% | 11.2% | 21.8% | 19.5 |
| 38 | Vermont | 21.2% | 14.9% | 21.4% | 19.2 |
| 39 | Rhode Island | 22.1% | 18.3% | 16.8% | 19.1 |
| 39 | West Virginia | 22.1% | 11.0% | 24.2% | 19.1 |
| 41 | California | 26.4% | 10.4% | 19.8% | 18.9 |
| 42 | Utah | 26.1% | 9.7% | 20.7% | 18.8 |
| 43 | Oregon | 25.3% | 12.3% | 18.6% | 18.7 |
| 44 | Florida | 28.4% | 8.5% | 18.3% | 18.4 |
| 45 | Colorado | 25.3% | 10.6% | 19.0% | 18.3 |
| 46 | New York | 25.7% | 9.4% | 17.4% | 17.5 |
| 47 | Nevada | 25.9% | 6.7% | 19.4% | 17.3 |
| 48 | Wyoming | 19.1% | 12.5% | 18.4% | 16.7 |
| 49 | Kentucky | 27.0% | 8.1% | 12.3% | 15.8 |
| 50 | North Dakota | 19.9% | 15.6% | 11.2% | 15.6 |
Business optimism rises sharply with firm size
Company size may be one of the strongest predictors of business confidence. Large businesses — those with 50 or more employees — are significantly more optimistic than small businesses, with optimism indexes of 37.3 for large businesses versus 22.4 for small businesses.
Business optimism: Large vs. small businesses
| Firm size | Expecting strong business performance (%) | Expecting employment growth (%) | Expecting demand growth (%) | Optimism index |
|---|---|---|---|---|
| 1 to 49 employees | 32.0% | 13.9% | 21.4% | 22.4 |
| 50 or more employees | 45.9% | 34.1% | 31.9% | 37.3 |
| All businesses | 30.9% | 11.9% | 20.5% | 21.1 |
Most notably, big firms are more than twice as likely to expect employment growth as smaller ones, at 34.1% versus 13.9%. They’re also much more optimistic about future business performance (45.9% versus 32.0%) and demand growth (31.9% versus 21.4%).
Business optimism by firm size
| Firm size | Expecting strong business performance (%) | Expecting employment growth (%) | Expecting demand growth (%) | Optimism index |
|---|---|---|---|---|
| 1 to 4 employees | 27.7% | 7.0% | 18.0% | 17.6 |
| 5 to 9 employees | 33.0% | 15.0% | 22.0% | 23.3 |
| 10 to 19 employees | 35.9% | 19.4% | 24.0% | 26.4 |
| 20 to 49 employees | 37.6% | 23.8% | 26.3% | 29.2 |
| 50 to 99 employees | 44.7% | 31.2% | 30.4% | 35.4 |
| 100 to 249 employees | 47.6% | 37.0% | 33.6% | 39.4 |
| 250 or more employees | 46.1% | 36.4% | 32.6% | 38.4 |
| All businesses | 30.9% | 11.9% | 20.5% | 21.1 |
More specifically by firm size, businesses with 100 to 249 employees are the most optimistic, at 39.4 on our optimism index. Those with 250 or more employees (38.4) follow closely behind.
Meanwhile, those with just one to four employees are the least optimistic by far, at 17.6 on our optimism index. That score is largely driven by expected employee growth at just 7.0% — the only measure in the single digits. Following are businesses with five to nine employees, with an optimism index score of 23.3.
Schulz says these discrepancies in optimism levels are probably because larger businesses often have more financial wiggle room.
“They tend to have bigger cash reserves and easier access to financing, which gives them more flexibility to manage problems in tough times,” he says. “Many also have more diversified revenue streams, so they’re less dependent on one customer group or product line. They also often have advantages in hiring, technology and supply chain relationships that can help them adapt faster to face challenges.”
Utilities is the most optimistic sector
Not all industries are navigating the same economic climate. Utilities is the most optimistic sector heading into the next six months, followed by finance and insurance, and healthcare and social assistance.
By metric, the finance and insurance sector leads confidence in future business performance, with 47.4% of businesses expecting strong performance over the next six months. That’s followed by utilities (46.2%) and healthcare and social assistance (37.2%).
Meanwhile, manufacturers are the most likely to expect employment growth (16.7%), followed by educational services (15.2%) and administrative and support and waste management and remediation services (14.9%).
Utilities leads in demand expectations, with 31.6% of businesses expecting growth. Manufacturing (26.6%) and wholesale trade (23.7%) have the next-highest expectations.
Business optimism by sector
| Sector | Expecting strong business performance (%) | Expecting employment growth (%) | Expecting demand growth (%) | Optimism index |
|---|---|---|---|---|
| Utilities | 46.2% | 13.6% | 31.6% | 30.5 |
| Finance and insurance | 47.4% | 14.0% | 23.2% | 28.2 |
| Healthcare and social assistance | 37.2% | 14.5% | 23.0% | 24.9 |
| Manufacturing | 30.9% | 16.7% | 26.6% | 24.7 |
| Educational services | 36.0% | 15.2% | 22.0% | 24.4 |
| Construction | 32.3% | 14.5% | 22.6% | 23.1 |
| Professional scientific and technical services | 36.4% | 10.4% | 21.2% | 22.7 |
| Administrative and support and waste management and remediation services | 33.1% | 14.9% | 19.0% | 22.3 |
| Arts, entertainment and recreation | 35.2% | 12.7% | 16.9% | 21.6 |
| Wholesale trade | 26.8% | 10.6% | 23.7% | 20.4 |
| Information | 27.7% | 11.8% | 21.6% | 20.4 |
| Accommodation and food services | 22.5% | 14.4% | 18.9% | 18.6 |
| Mining, quarrying and oil and gas extraction | 25.9% | 14.2% | 14.2% | 18.1 |
| Real estate | 31.4% | 6.5% | 16.1% | 18.0 |
| Transportation and warehousing | 21.3% | 9.5% | 22.0% | 17.6 |
| Other services (except public administration) | 25.6% | 7.3% | 17.2% | 16.7 |
| Retail trade | 21.1% | 7.9% | 16.6% | 15.2 |
On the other end, retail trade ranks last in our optimism index. It’s followed by other services except public administration (which includes repair and maintenance, personal and laundry services and more) and transportation and warehousing.
Expert tips for small business owners over the next 6 months
As small businesses navigate a more uncertain economic environment, the companies that stay adaptable and disciplined are likely the ones best positioned for growth. Here are a few practical ways that business owners can remain competitive in the second half of the year:
- Stay close to your customers. “Businesses that pay attention to changing customer habits and respond quickly tend to outperform competitors during uncertain periods,” Schulz says. “Even small adjustments to pricing, promotions, product offerings or inventory can make a meaningful difference.”
- Be mindful of cash flow. “Many small businesses face challenges not because demand disappears, but because costs rise faster than expected,” he says. “Regularly reviewing expenses and building even a modest cash cushion, when possible, can create more flexibility if conditions shift.”
- Focus on efficiency. “This may not be the ideal environment for major expansion bets, but targeted investments in technology, marketing or operational improvements can help businesses operate leaner and stand out as consumers become more selective,” he says.
Methodology
LendingTree researchers analyzed data from the U.S. Census Bureau Business Trends and Outlook Survey (BTOS) released May 7, 2026.
The analysis focuses on three forward-looking survey measures over the next six months:
- Expected business performance (“excellent” or “above-average” responses classified as optimistic)
- Expected employment change (“increased” responses classified as optimistic)
- Expected demand change (“increased” responses classified as optimistic)
We calculated the Business Optimism Index — the simple average of the share of optimistic responses across these measures.
For Alaska, Delaware, Hawaii, Idaho, North Dakota, Rhode Island, Vermont, West Virginia and Wyoming, the excellent response category was suppressed by the Census Bureau due to small sample sizes. For these states, the business performance measure reflects only above-average responses, which may slightly understate optimism relative to other states.
Compare business loan offers