Gen Z Fuels Startup Interest as Half Consider Starting a Business


America’s entrepreneurial spirit is alive and well — and younger Americans are leading the charge.
According to a LendingTree analysis, new business applications hit a record high in 2025. Meanwhile, according to a survey of 2,000 U.S. consumers, more than 1 in 4 Americans (27%) say they’ve seriously considered starting a business in the past 12 months.
Here’s a closer look.
- Wyoming has the most business applications per capita. From April 2025 through March 2026, Wyoming ranked No. 1 in business applications (13,873 per 100,000 residents) and high-propensity applications (3,546 per 100,000), meaning these applications have a high likelihood of becoming employer businesses. Delaware and Florida rank second and third, respectively, in both categories.
- New business applications in 2025 reached a record high. There were 5.7 million business applications during 2025, exceeding the previous highs set in 2023 (5.5 million) and 2021 (5.4 million). Looking at business applications filed from April 2024 through March 2025 versus April 2025 through March 2026, Kentucky posted the highest growth (33.8%), followed by Missouri (27.7%) and Wyoming (25.1%).
- Interest in entrepreneurship is widespread, especially among younger Americans. More than 1 in 4 Americans (27%) say they’ve seriously considered starting a business in the past 12 months. That figure rises to 51% among Gen Zers.
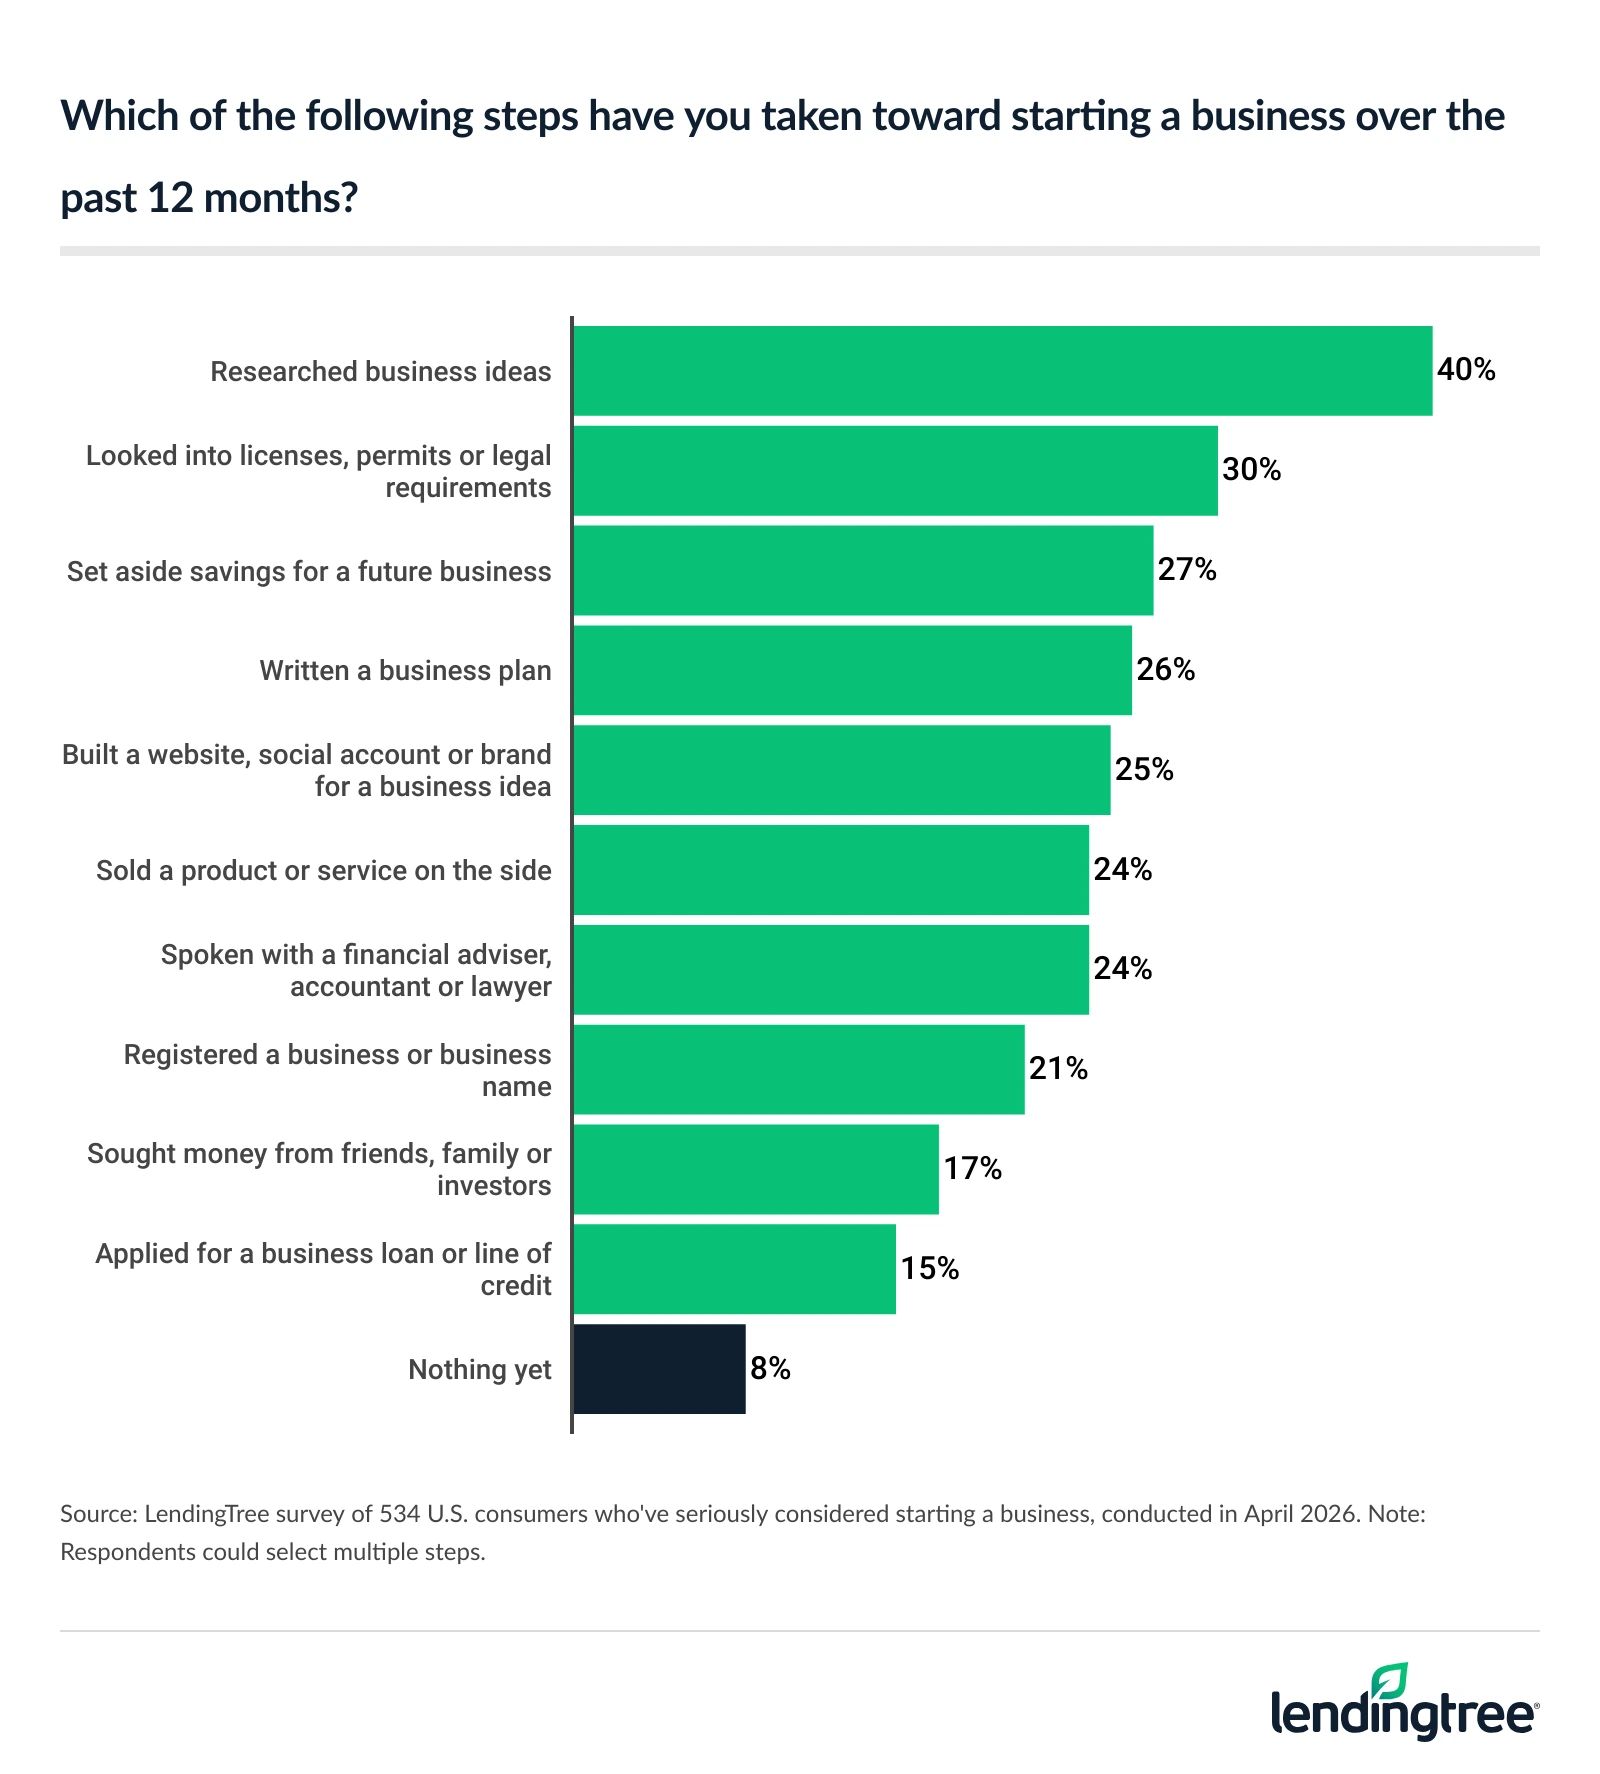
- Most prospective entrepreneurs are still in the early planning stages, with limited financing activity. Among those considering a business, the most common steps taken are researching ideas (40%) and exploring legal requirements (30%). Far fewer have pursued funding — just 15% have applied for loans or credit and 17% have sought external investments.
- Financial concerns remain the primary barrier despite relatively low startup cost expectations. Many prospective founders believe they can launch a business with less than $50,000 (61%), yet a lack of funds (28%) and economic uncertainty (29%) are the top obstacles. Among those not interested in entrepreneurship, stress is a key deterrent.
Wyoming leads in business applications per capita
Not all states are created equally when it comes to new business formation. From April 2025 through March 2026, Wyoming had the highest rate of business applications, with 13,873 per 100,000 residents.
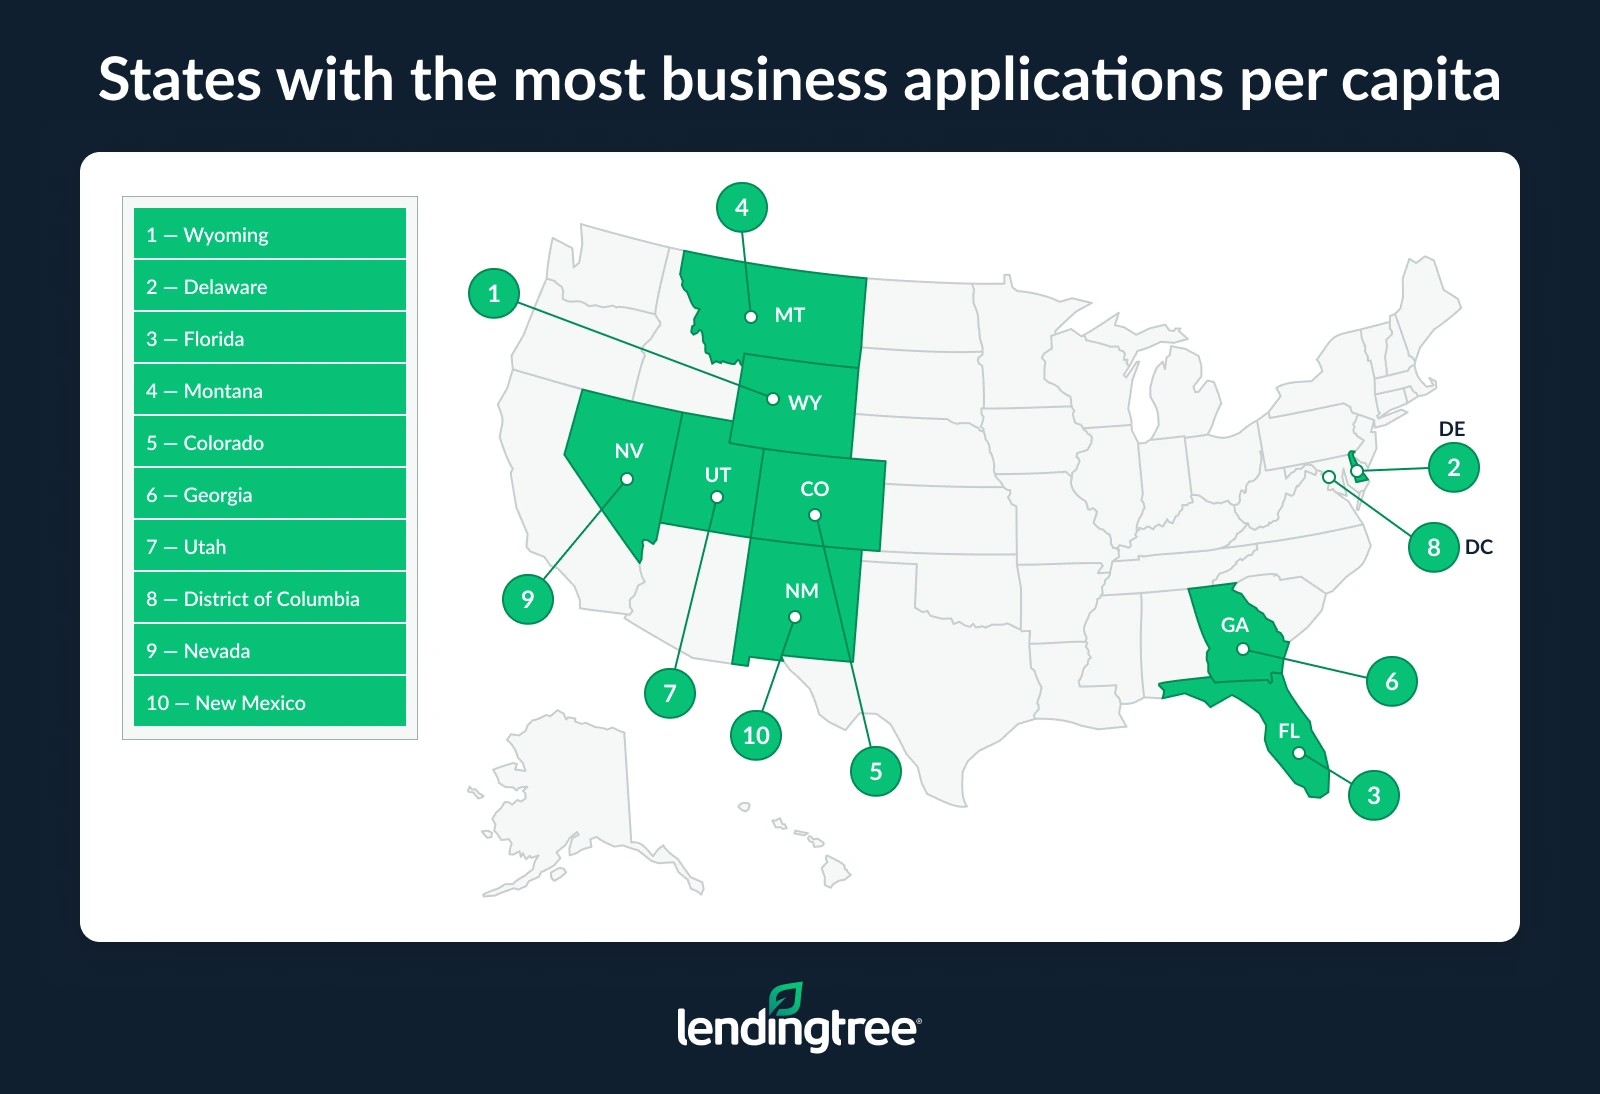
It also ranked first for high-propensity applications, at 3,546 per 100,000 residents. High-propensity applications refer to businesses that are highly likely to become employer businesses.
Delaware and Florida ranked next for both business applications and high-propensity applications. Delaware had a distant 5,656 business applications per 100,000 residents and 1,969 high-propensity applications per 100,000. Meanwhile, Florida had 2,832 business applications and 861 high-propensity applications per 100,000 residents, respectively.
Conversely, West Virginia ranked last in both business applications and high-propensity applications, at 978 and 293 per 100,000 residents, respectively. Maine (1,006 per 100,000) and Rhode Island (1,064) ranked next-lowest for business applications, while Iowa (305 per 100,000) and Wisconsin (327) had the next-lowest rates of high-propensity applications.
Full rankings: States with the most/least business applications
| Rank | State | Business applications per 100,000 residents |
|---|---|---|
| 1 | Wyoming | 13,873 |
| 2 | Delaware | 5,656 |
| 3 | Florida | 2,832 |
| 4 | Montana | 2,687 |
| 5 | Colorado | 2,470 |
| 6 | Georgia | 2,322 |
| 7 | Utah | 2,183 |
| 8 | District of Columbia | 2,157 |
| 9 | Nevada | 2,014 |
| 10 | New Mexico | 2,009 |
| 11 | Mississippi | 1,834 |
| 12 | Arizona | 1,830 |
| 13 | Texas | 1,769 |
| 14 | South Carolina | 1,737 |
| 15 | New Jersey | 1,719 |
| 16 | Missouri | 1,714 |
| 17 | North Carolina | 1,688 |
| 18 | Idaho | 1,684 |
| 19 | Louisiana | 1,678 |
| 20 | Maryland | 1,675 |
| 21 | Virginia | 1,619 |
| 22 | Oklahoma | 1,565 |
| 23 | Michigan | 1,563 |
| 24 | New York | 1,528 |
| 25 | Illinois | 1,518 |
| 26 | Washington | 1,511 |
| 27 | Kentucky | 1,505 |
| 28 | Tennessee | 1,478 |
| 29 | Alaska | 1,477 |
| 30 | Ohio | 1,467 |
| 31 | Oregon | 1,465 |
| 32 | California | 1,440 |
| 33 | Alabama | 1,417 |
| 34 | Connecticut | 1,380 |
| 35 | Hawaii | 1,360 |
| 36 | Indiana | 1,336 |
| 37 | Arkansas | 1,329 |
| 38 | South Dakota | 1,327 |
| 39 | Kansas | 1,326 |
| 40 | Minnesota | 1,267 |
| 41 | Pennsylvania | 1,255 |
| 42 | Wisconsin | 1,251 |
| 43 | New Hampshire | 1,239 |
| 44 | Vermont | 1,201 |
| 45 | Nebraska | 1,160 |
| 46 | North Dakota | 1,151 |
| 47 | Massachusetts | 1,126 |
| 48 | Iowa | 1,097 |
| 49 | Rhode Island | 1,064 |
| 50 | Maine | 1,006 |
| 51 | West Virginia | 978 |
Full rankings: States with the most/least high-propensity business applications
| Rank | State | High-propensity business applications per 100,000 residents |
|---|---|---|
| 1 | Wyoming | 3,546 |
| 2 | Delaware | 1,969 |
| 3 | Florida | 861 |
| 4 | Colorado | 719 |
| 5 | Montana | 698 |
| 6 | District of Columbia | 623 |
| 7 | Georgia | 618 |
| 8 | New York | 583 |
| 9 | Utah | 569 |
| 10 | California | 543 |
| 11 | Nevada | 542 |
| 12 | New Mexico | 521 |
| 13 | Idaho | 508 |
| 14 | New Jersey | 488 |
| 15 | Oklahoma | 487 |
| 16 | Arizona | 485 |
| 17 | Mississippi | 479 |
| 17 | Maryland | 479 |
| 19 | Texas | 477 |
| 20 | North Carolina | 463 |
| 21 | Illinois | 448 |
| 22 | South Carolina | 440 |
| 23 | Virginia | 429 |
| 24 | Tennessee | 420 |
| 25 | Missouri | 419 |
| 26 | Louisiana | 414 |
| 27 | Oregon | 408 |
| 28 | Massachusetts | 405 |
| 29 | Washington | 403 |
| 30 | Michigan | 402 |
| 31 | Hawaii | 398 |
| 32 | Alaska | 394 |
| 32 | Connecticut | 394 |
| 34 | Vermont | 393 |
| 35 | South Dakota | 386 |
| 36 | Indiana | 385 |
| 37 | Arkansas | 380 |
| 38 | Kansas | 374 |
| 39 | Minnesota | 367 |
| 40 | New Hampshire | 364 |
| 41 | North Dakota | 363 |
| 42 | Ohio | 360 |
| 43 | Kentucky | 359 |
| 44 | Rhode Island | 355 |
| 45 | Pennsylvania | 352 |
| 46 | Alabama | 350 |
| 47 | Maine | 340 |
| 48 | Nebraska | 332 |
| 49 | Wisconsin | 327 |
| 50 | Iowa | 305 |
| 51 | West Virginia | 293 |
2025 had a record number of new business applications
Americans are experiencing a surge in entrepreneurship. In 2025, there were 5.7 million business applications filed — the highest annual total in the decade analyzed.
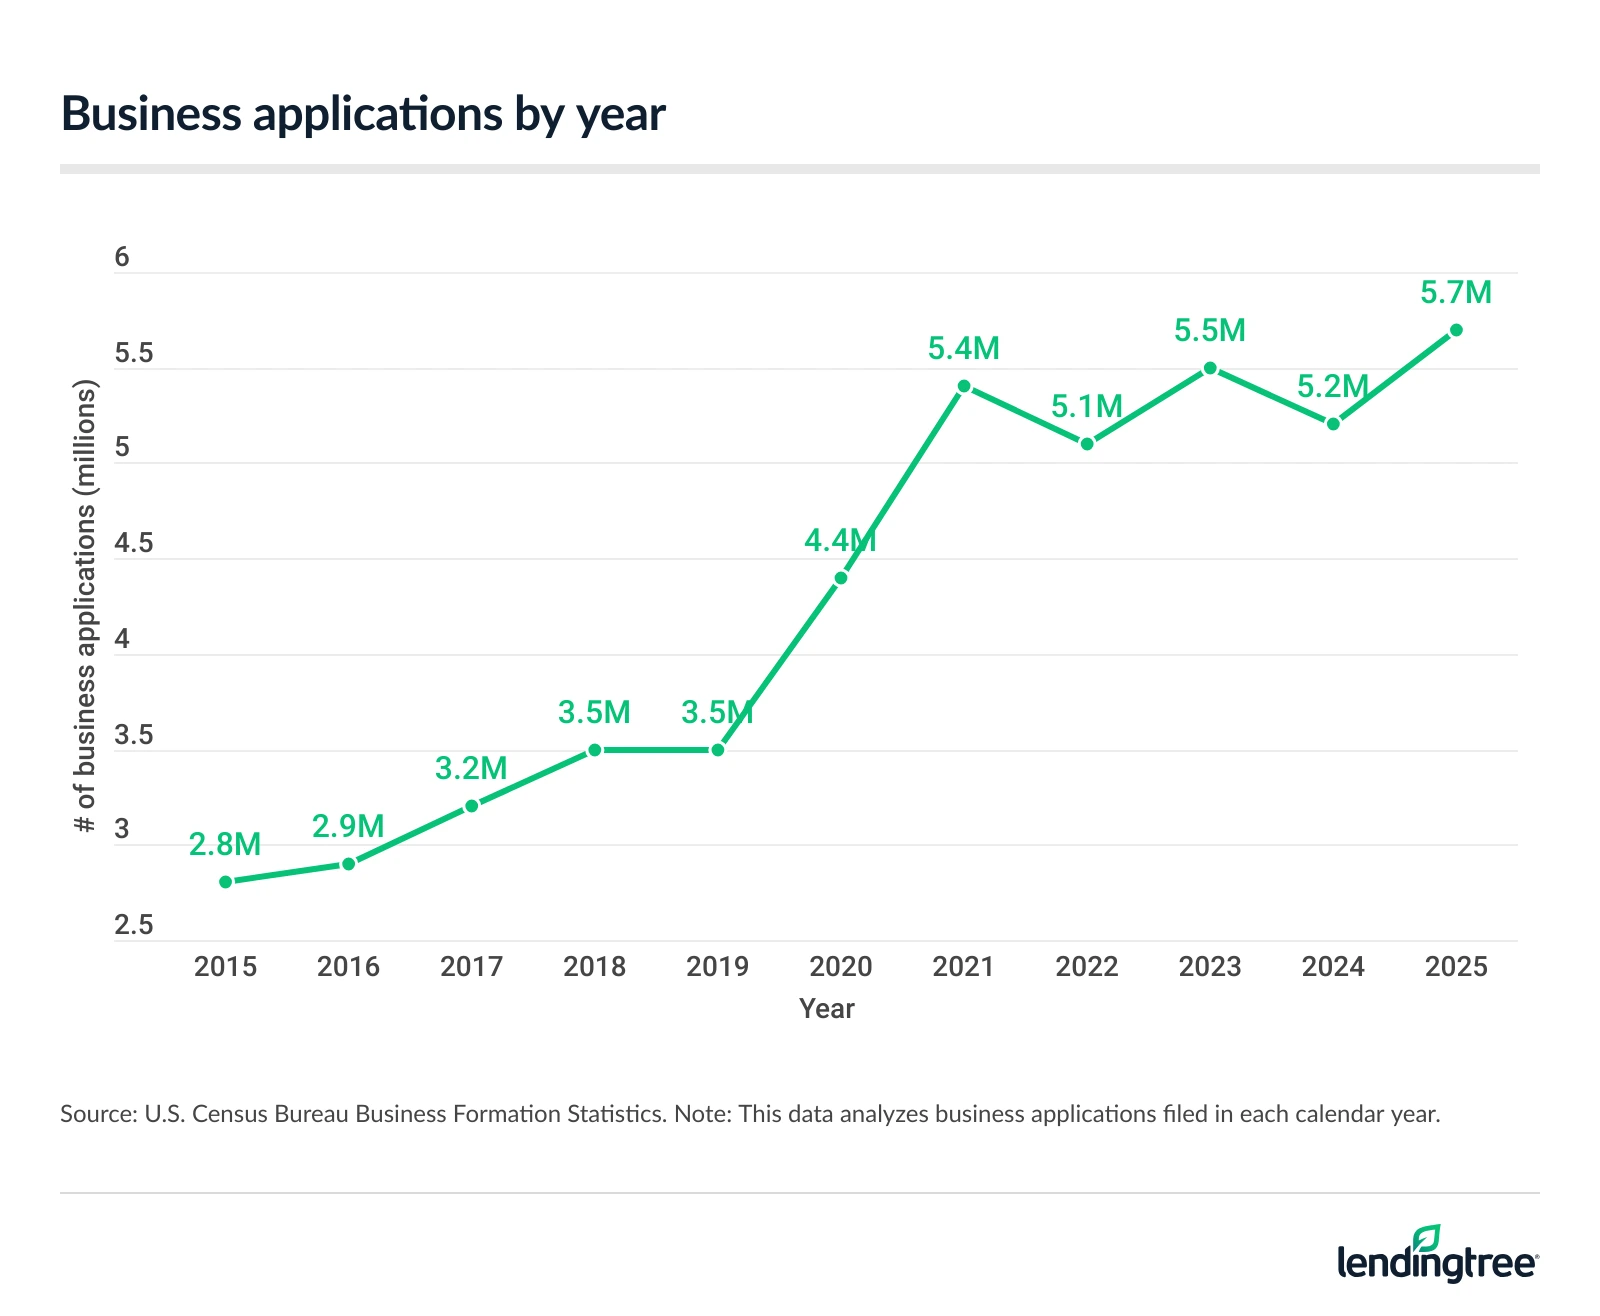
The next-highest years were 2023, with 5.5 million applications, and 2021, with 5.4 million.
Matt Schulz — LendingTree chief consumer finance analyst and author of “Ask Questions, Save Money, Make More: How to Take Control of Your Financial Life” — believes the surge in business applications says a lot about both the economy and the mindset of workers right now.
“Even in an environment where people continue to have concerns about inflation, interest rates and economic uncertainty, there’s clearly a strong belief that entrepreneurship remains one of the best paths to financial independence and flexibility,” he says. “Americans want more control over their income, and more people believe they can realistically build something of their own than at any point in recent memory. That combination of optimism and practicality can be pretty powerful.”
In 2025, the highest share of business applications came from the professional, scientific and technical services industry, which includes legal services, accounting and tax preparation, accounting for 18.8% of applications that year. Construction (12.8%) and other services except public administration (11.9%) — which includes repair and maintenance and personal and laundry services — followed.
Most common industries for business applications in 2025
| Industry | % of business applications |
|---|---|
| Professional, scientific and technical services | 18.8% |
| Construction | 12.8% |
| Other services (except public administration) | 11.9% |
| Administrative and support and waste management and remediation services | 9.3% |
| Healthcare and social assistance | 8.7% |
| Accommodation and food service | 7.4% |
| Real estate and rental and leasing | 6.7% |
| Finance and insurance | 5.7% |
| Arts, entertainment and recreation | 4.0% |
| Unclassified | 3.8% |
| Wholesale trade | 2.8% |
| Information | 2.7% |
| Educational services | 2.1% |
| Management of companies and enterprises | 1.6% |
| Agriculture, forestry, fishing and hunting | 1.2% |
| Utilities | 0.2% |
| Mining, quarrying, and oil and gas extraction | 0.1% |
Looking at business applications filed from April 2024 through March 2025 versus April 2025 through March 2026, Kentucky posted the highest growth, seeing the number of business applications jump from 51,834 to 69,343 — an increase of 33.8%. Missouri followed at 27.7%, with applications increasing from 84,148 to 107,450, while Wyoming ranked third at 25.1%, rising from 65,304 to 81,675.
Just one state saw a decrease: Washington, where applications fell 9.9% from 134,125 to 120,882.
Full rankings: States with the most/least growth in business applications
| Rank | State | Business applications, April 2024-March 2025 | Business applications, April 2025-March 2026 | % change |
|---|---|---|---|---|
| 1 | Kentucky | 51,834 | 69,343 | 33.8% |
| 2 | Missouri | 84,148 | 107,450 | 27.7% |
| 3 | Wyoming | 65,304 | 81,675 | 25.1% |
| 4 | Kansas | 31,585 | 39,490 | 25.0% |
| 5 | Wisconsin | 59,874 | 74,739 | 24.8% |
| 6 | New Mexico | 34,481 | 42,704 | 23.8% |
| 7 | Ohio | 141,676 | 174,606 | 23.2% |
| 8 | Alabama | 59,812 | 73,601 | 23.1% |
| 9 | Tennessee | 88,462 | 108,133 | 22.2% |
| 10 | Oklahoma | 53,271 | 64,513 | 21.1% |
| 11 | North Carolina | 156,600 | 189,045 | 20.7% |
| 12 | Michigan | 132,070 | 158,299 | 19.9% |
| 13 | West Virginia | 14,458 | 17,273 | 19.5% |
| 14 | Louisiana | 65,184 | 77,515 | 18.9% |
| 15 | Mississippi | 45,681 | 54,185 | 18.6% |
| 16 | Alaska | 9,236 | 10,889 | 17.9% |
| 17 | Utah | 66,129 | 77,239 | 16.8% |
| 17 | Virginia | 123,136 | 143,778 | 16.8% |
| 19 | Arkansas | 35,563 | 41,403 | 16.4% |
| 20 | Texas | 482,773 | 560,994 | 16.2% |
| 21 | Arizona | 120,707 | 139,487 | 15.6% |
| 22 | Pennsylvania | 142,138 | 163,923 | 15.3% |
| 23 | Illinois | 168,287 | 193,035 | 14.7% |
| 23 | Nebraska | 20,407 | 23,408 | 14.7% |
| 23 | South Carolina | 84,370 | 96,741 | 14.7% |
| 26 | Montana | 27,091 | 30,761 | 13.5% |
| 27 | Colorado | 130,985 | 148,533 | 13.4% |
| 28 | Maryland | 92,992 | 104,931 | 12.8% |
| 29 | New Hampshire | 15,689 | 17,539 | 11.8% |
| 30 | Georgia | 235,040 | 262,402 | 11.6% |
| 31 | Iowa | 31,899 | 35,539 | 11.4% |
| 32 | North Dakota | 8,263 | 9,198 | 11.3% |
| 33 | Minnesota | 66,585 | 73,857 | 10.9% |
| 34 | Connecticut | 46,291 | 50,902 | 10.0% |
| 35 | Idaho | 31,283 | 34,186 | 9.3% |
| 36 | South Dakota | 11,422 | 12,406 | 8.6% |
| 36 | California | 521,882 | 566,696 | 8.6% |
| 36 | New Jersey | 151,192 | 164,157 | 8.6% |
| 39 | Hawaii | 17,951 | 19,484 | 8.5% |
| 40 | Massachusetts | 74,645 | 80,583 | 8.0% |
| 41 | Rhode Island | 11,043 | 11,863 | 7.4% |
| 42 | Florida | 620,150 | 664,407 | 7.1% |
| 43 | Vermont | 7,245 | 7,742 | 6.9% |
| 44 | New York | 286,506 | 305,667 | 6.7% |
| 44 | Nevada | 61,978 | 66,106 | 6.7% |
| 46 | Indiana | 87,821 | 93,157 | 6.1% |
| 47 | District of Columbia | 14,133 | 14,959 | 5.8% |
| 48 | Oregon | 61,482 | 62,602 | 1.8% |
| 48 | Delaware | 58,911 | 59,946 | 1.8% |
| 50 | Maine | 14,003 | 14,240 | 1.7% |
| 51 | Washington | 134,125 | 120,882 | -9.9% |
Interest in starting a business is widespread
Serious consideration of starting a business is extremely common. In fact, 27% say they’ve seriously considered starting a business in the past 12 months, according to our survey of 2,000 U.S. consumers. That jumps to 51% among Gen Zers ages 18 to 29 — far higher than the next most likely age group, millennials ages 30 to 45 (37%).
Those with children younger than 18 (47%) and six-figure earners (37%) are also more likely to have seriously considered starting a business. Men (33%) are also more likely than women (21%) to say so.
Schulz believes that so many young Americans are pursuing entrepreneurship because they want more control over their financial futures.
“They’ve been hit hard by a difficult job market and maybe have even seen their friends and relatives experience the same thing,” he says. “They see entrepreneurship as a way to diversify their income and make themselves less vulnerable if they suddenly lose their day job. Yes, many people who start a small business simply have entrepreneurship in their blood, but a huge number of them start businesses out of necessity rather than passion.”
When it comes to motivation, there’s no single dominant driver. The most commonly cited reason is to earn more money (41%), while 40% say it’s to provide another source of income. That’s followed by:
- To create something of their own (39%)
- To have more purpose or do work they’re passionate about (38%)
- To be their own boss (36%)
- To turn a hobby or skill into income (35%)
- To have a more flexible schedule (33%)
- To have a better work-life balance (28%)
- To ease fears about the security of their current job (24%)
- To replace lost income (18%)
Of those who say they’ve considered starting a business in the past 12 months, 51% say it’s very likely they’ll start a business in the next 12 months, while another 35% say it’s somewhat likely. Meanwhile, 99% say the idea of starting a business is at least somewhat appealing.
Interest has only grown. Compared to 12 months ago, 79% of prospective entrepreneurs say their desire to start a business has grown at least somewhat.
When it comes to the type of business they’d start, online or e-commerce businesses (30%) and creative or media businesses (25%) are the most common. That’s followed by businesses in the following industries:
- Professional or business services (24%)
- Consumer products/physical goods (23%)
- Technology or software (23%)
- Restaurant, food or beverage (21%)
- Health, beauty or wellness (20%)
- Childcare, elder care or personal care (19%)
- Retail store (18%)
- Real estate-related business (15%)
- Construction or home services (12%)
Prospective entrepreneurs are in the early planning stages
Despite widespread interest, most aspiring founders haven’t gotten very far in the process. Among those considering starting a venture, the most common steps taken in the past 12 months are researching ideas (40%) and exploring legal requirements (30%).
Meanwhile, just 15% have applied for loans or credit, and 17% have sought external investments.
Schulz doesn’t think that means potential entrepreneurs aren’t serious about starting a business.
“Entrepreneurship is serious business, and though it has never been easier or cheaper to start a small business, there’s still a lot that goes into it,” he says. “I think it’s a good sign that many potential entrepreneurs are researching ideas and exploring legalities, but ideally those numbers would be higher. It’s somewhat troubling that so few have pursued funding, but that’s not necessarily a sign that they’re not serious. Depending on the type of business, you could start it in an afternoon with very little investment.”
That may also be due to where priorities lie. Among potential entrepreneurs, 67% say they prioritize a steady job with a steady income over owning their own business with less predictable income. Separately, 42% say they equally value income stability and independence and control over their work.
Financial concerns are the biggest barrier
Money worries are the biggest thing standing between aspiring entrepreneurs and their business dreams, even as many believe the financial bar to entry is lower than it may seem. More than 3 in 5 (61%) prospective founders believe they can launch a business with less than $50,000.
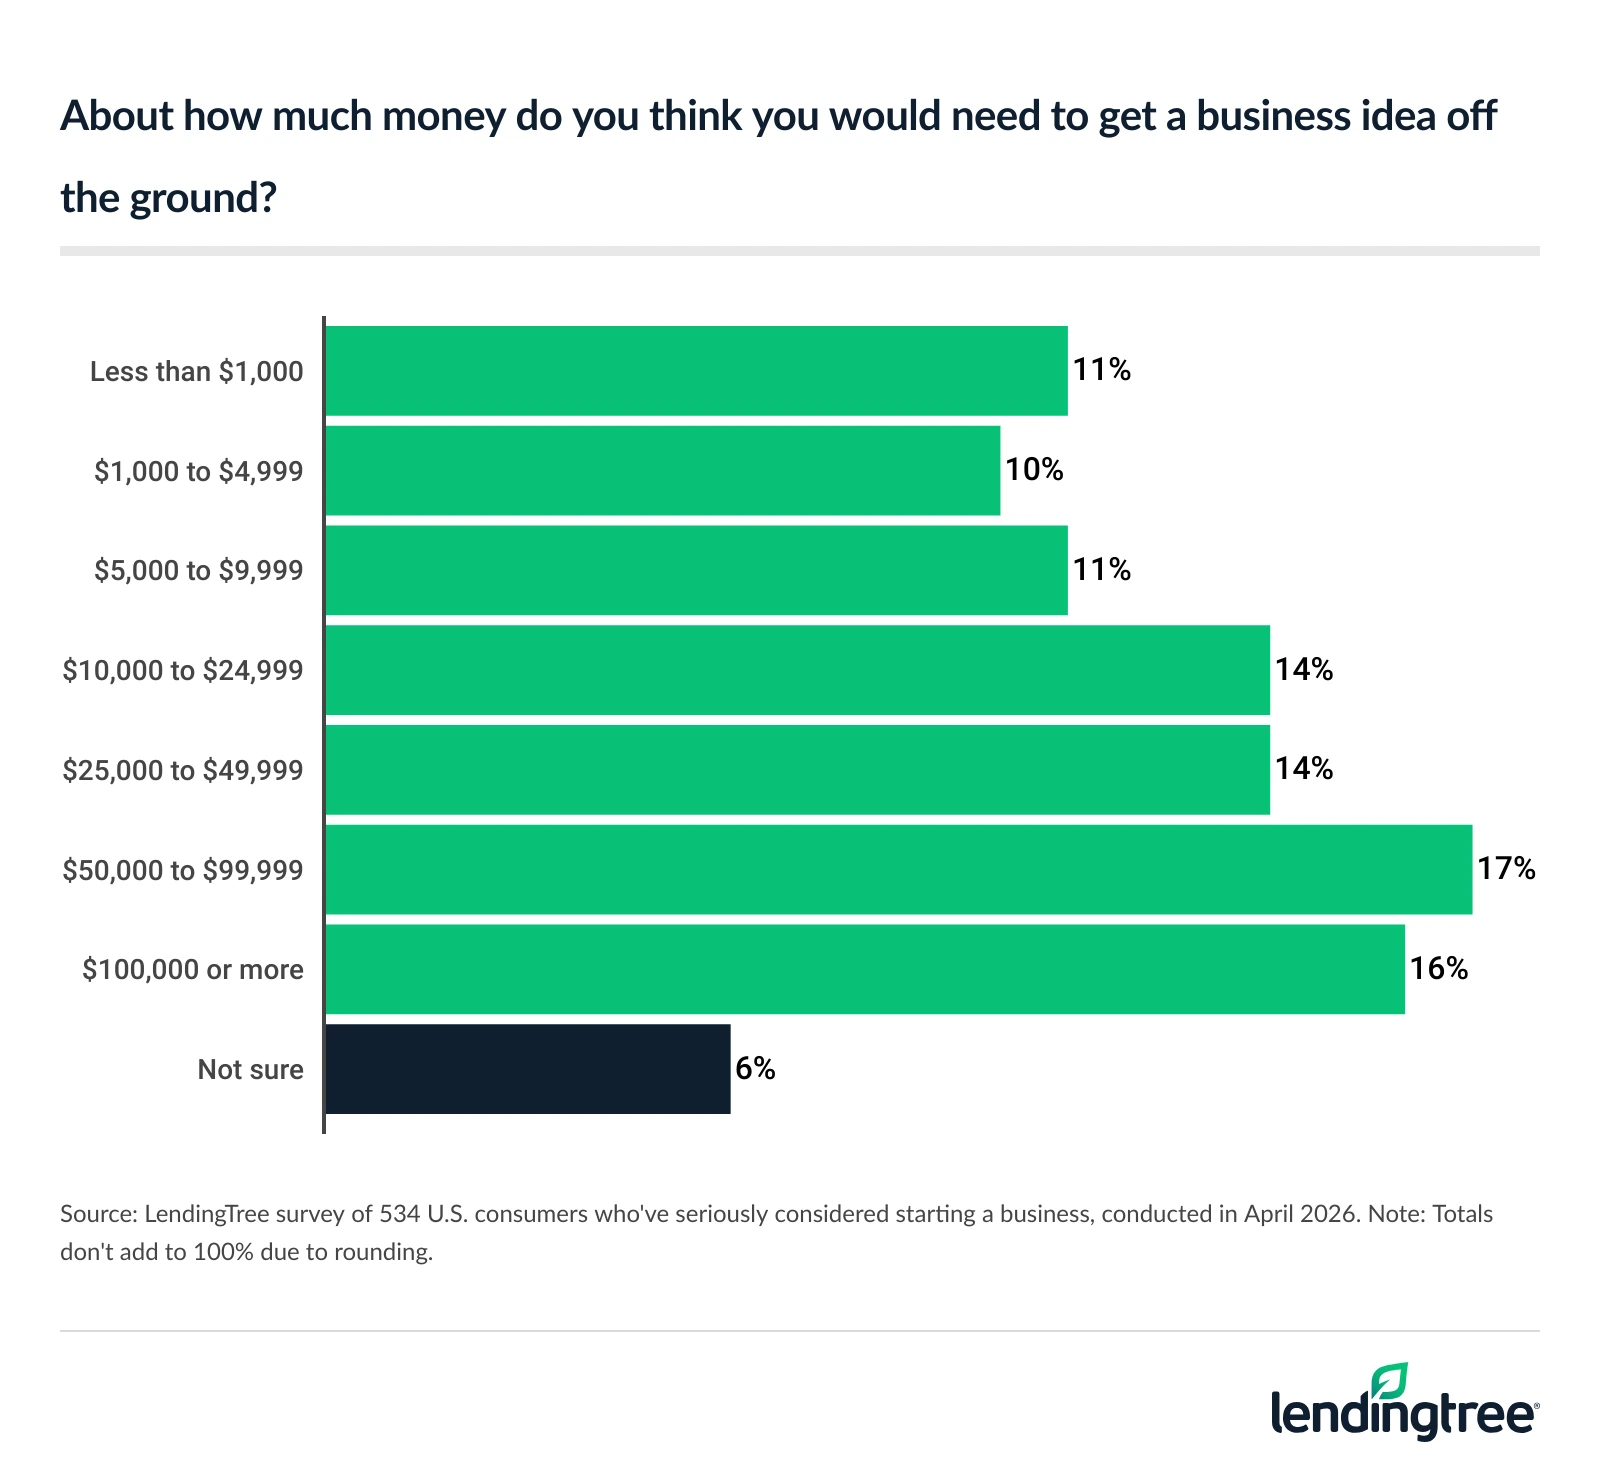
Schulz says it’s certainly possible to start a business with less than $50,000.
“An online store can be started quickly for very little money,” he says. “You can offer professional services quickly and cheaply as well, including freelance writing, lawn care, pet sitting, personal training and more. You can become a rideshare driver. There are loads of options. Economic uncertainty is definitely an issue. Starting a business is always a roll of the dice, but starting it during a volatile economic period can just stack the deck against you even more.”
If prospective entrepreneurs were to start a business in the next 12 months, 37% say the money would come from their personal savings — the most common response. Following that, income from their current job and credit cards tie for second, at 27% each. Other common funding options include:
- Money from friends or family (22%)
- A personal loan (22%)
- A business loan or line of credit (21%)
- A side hustle or gig income (20%)
- Investors (18%)
- Retirement savings (12%)
- An SBA loan (11%)
Most don’t want to take on significant debt, though. When asked how much debt they’d feel comfortable taking on for a business, 38% said less than $5,000, while 29% would take on $5,000 to $9,999. Another 32% would take on five-figure debt.
When it comes to the top obstacles, 29% say economic uncertainty is an obstacle to starting a business, while 28% cite a lack of funds. That’s followed by:
- They need the security of a steady income (25%)
- They worry the business would fail (24%)
- They have family or caregiving responsibilities (24%)
- They don’t know how to handle taxes or legal requirements (22%)
- They have health insurance/benefits concerns (21%)
- They don’t know where to start (20%)
- They don’t want to take on debt (19%)
- They don’t know how to get customers (16%)
- They don’t have enough time (15%)
- They don’t have the right business idea yet (14%)
Concerns aren’t limited to those who want to start a business. Among Americans not interested in entrepreneurship, 56% say they wouldn’t want to start a business even if they had the money, and 66% say it’s more stress than it’s worth. Still, 68% say they respect those who start businesses.
Top tips for aspiring entrepreneurs looking to take the leap
Starting a business can feel overwhelming, especially when there’s pressure to have everything figured out from day one. But entrepreneurship is often less about perfect timing and more about taking action, learning as you go and staying flexible when challenges arise. For aspiring business owners, focusing on steady progress instead of perfection can make the leap feel much more manageable. We offer the following advice:
- Start before you feel ready. Waiting for the perfect moment can keep great ideas from getting off the ground. Taking small, practical steps now can help build momentum and confidence over time.
- Focus on solving real problems. The strongest businesses are often built around helping people meet a genuine need. Listening to customer feedback and adapting along the way can be more valuable than having a flawless business plan.
- Stay consistent and adaptable. Entrepreneurship comes with setbacks and uncertainty, so persistence matters. Being willing to adjust your approach and keep showing up (even after the initial excitement fades) can set successful founders apart.
“Too many people wait for the perfect time to start a business, but there’s really no such thing,” Schulz says. “There’s almost always uncertainty. The people most likely to succeed aren’t necessarily the ones with the best ideas or the most money. Successful entrepreneurs tend to focus less on chasing perfection and more on solving real problems, listening to customers and improving little by little over time. The people who struggle most are often the ones who spend years thinking about starting instead of testing their ideas in the real world.”
Methodology
To rank states for business formation, we used data from the U.S. Census Bureau Business Formation Statistics (BFS). State-level rankings are based on the most recent 12-month period available, spanning April 2025 through March 2026. We calculated business applications per 100,000 residents by comparing total applications during this period with 2025 state population estimates from the Census Bureau. High-propensity business applications were analyzed using the same time frame and population-adjusted approach.
To assess growth trends, we measured year-over-year changes in business applications using the same April-through-March period for state-level comparisons.
For longer-term national trends, we analyzed annual business application totals from 2015 through 2025 using calendar-year (January through December) data. Industry-specific analyses use calendar-year 2025 data.
Separately, LendingTree commissioned QuestionPro to conduct an online survey of 2,000 U.S. consumers ages 18 to 80 from April 13 to 17, 2026. The survey was administered using a nonprobability-based sample, and quotas were used to ensure the sample base represented the overall population. Researchers reviewed all responses for quality control.
We defined generations as the following ages in 2026:
- Generation Z: 18 to 29
- Millennials: 30 to 45
- Generation X: 46 to 61
- Baby boomers: 62 to 80
Compare business loan offers
Recommended Articles
Only 27% of Gen Z Workers Earn Enough to Live Alone Comfortably — and in Many Metros, It’s Even Worse
More Than Half of Gen Zers and Millennials Have a Side Hustle, 80% of Whom Say They’re More Reliant on the Extra Money Due to the Current Economy
Young Entrepreneurs Remain Rare: Fewer Than 6% of Employer Firms Are Owned by Under-35s