America’s Tourism-Dependent Metros Aren’t Always the Obvious Ones


According to a LendingTree analysis, nowhere among the nation’s 100 biggest metros are small businesses more reliant on tourism than in New Orleans, Las Vegas, Nashville, Tenn., and Kiryas Joel, N.Y.
Surprised by that last one? Yeah, we were, too.
LendingTree ranked the 100 largest U.S metros across eight metrics to identify where small businesses appear to rely most heavily on tourism. (See the methodology section for a full description of each metric.) Taken together, these metrics provide a more complete picture of the metros where tourism serves as a fundamental driver of small business activity and the broader local economy. While the top three metros are among the nation’s best-known tourist destinations, several of the other highest-ranking metros are less obvious.
In a separate survey, we also found that Americans are far more likely to say they prefer to support small businesses over large national chains when they travel. However, the survey also revealed that their spending habits don’t always align with those preferences.
Here’s what we found.
- Small businesses in New Orleans, Las Vegas and Nashville, Tenn., are the most dependent on tourism. These three tourist hubs are joined in the top 10 by well-established destinations such as Memphis, Tenn. (sixth), Los Angeles (seventh) and New York (eighth). Tennessee and New York are the only states with multiple metros in the top 10.
- Several of the most tourism-dependent metros may surprise you. Kiryas Joel, N.Y., ranks fourth, while Scranton, Pa., and New Haven, Conn., rank ninth and 10th, respectively. Meanwhile, popular tourist destinations such as Orlando, Fla. (26th), Miami (38th), Boston (50th) and Washington, D.C. (96th), rank lower on the list.
- Americans are nearly three times as likely to prefer small, local businesses over large, national chains. 44% of consumers prefer supporting smaller businesses when traveling for leisure or vacation, including 21% who strongly prefer them. Just 15% say they prefer large companies and national chains, including 6% who strongly prefer them. Another 41% have no preference. Gen Zers are the most likely generation to prefer small businesses, while Gen Xers are the least likely.
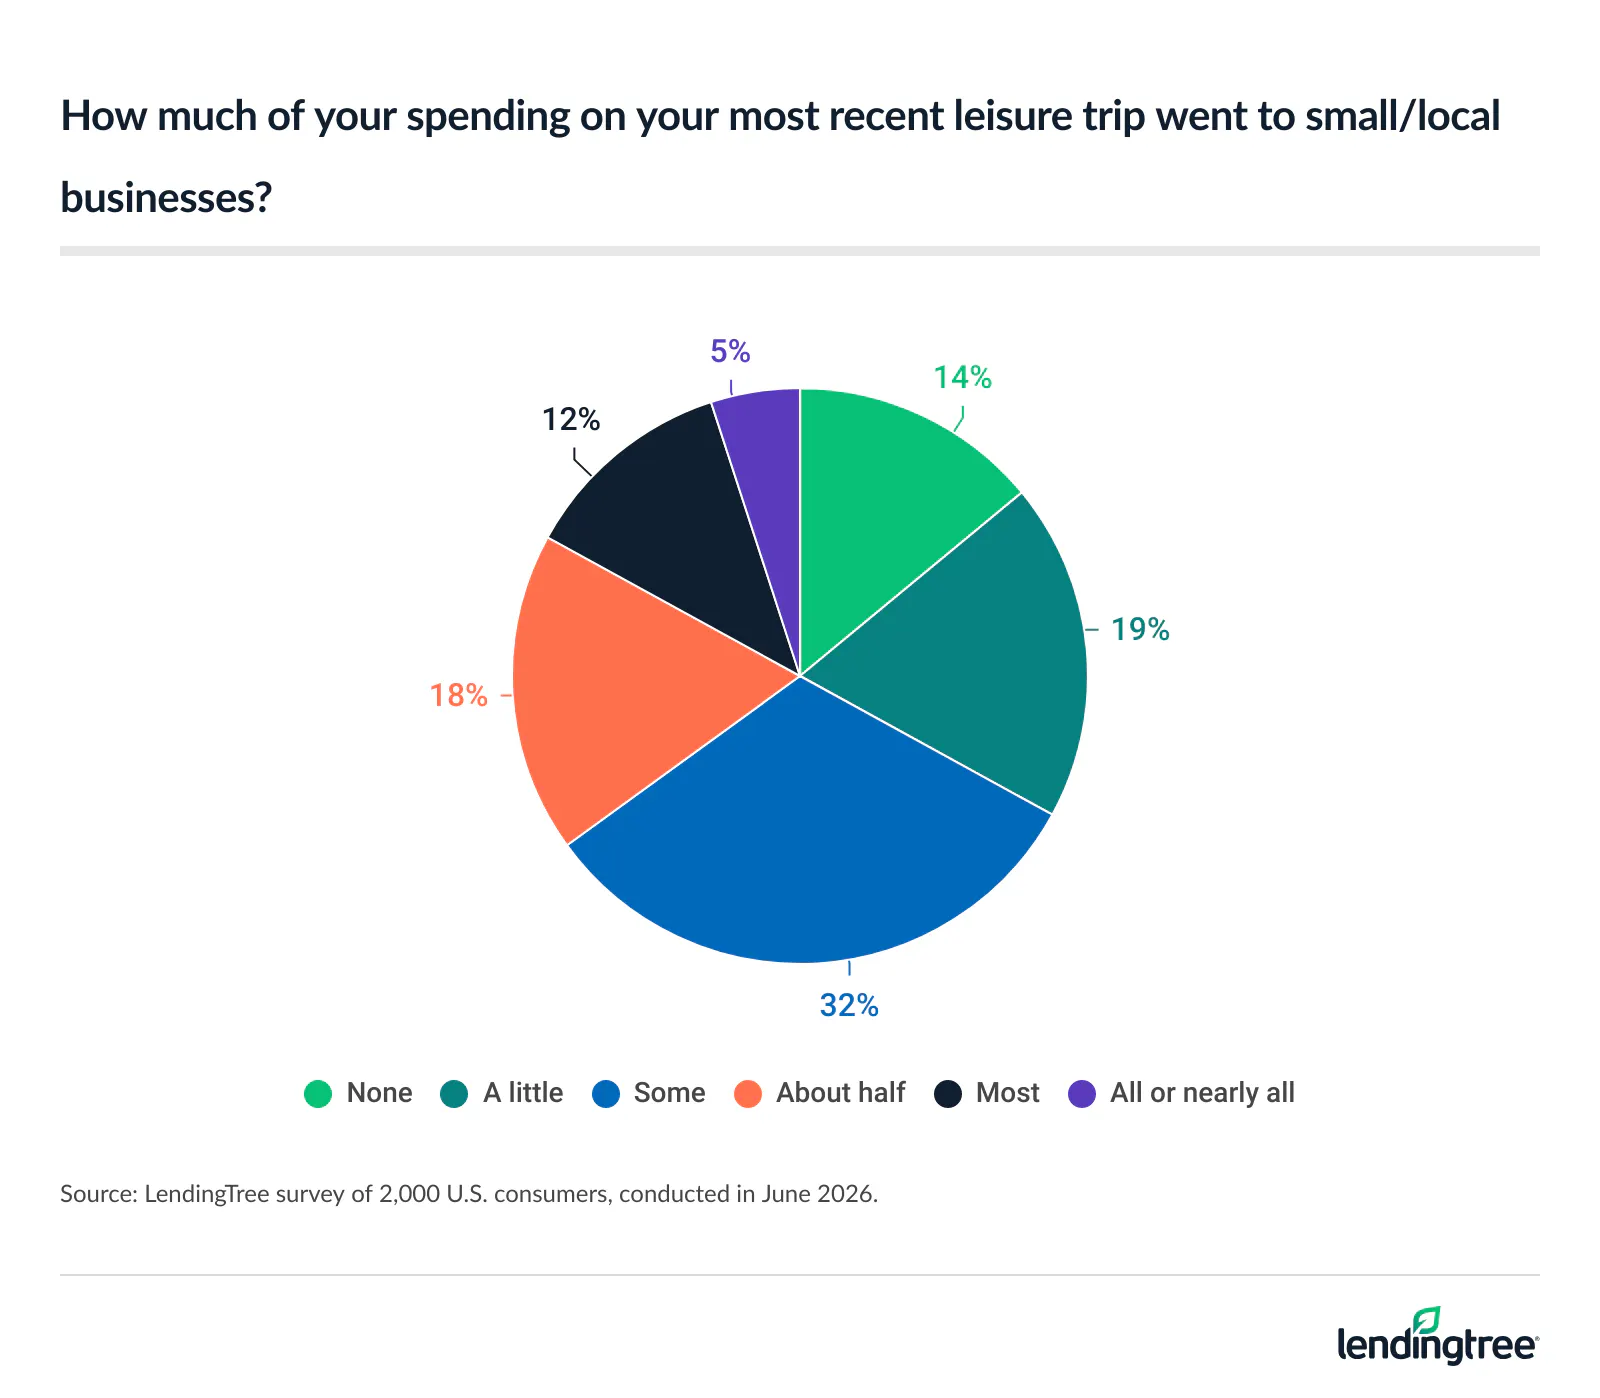
- Despite those preferences, Americans’ travel spending habits don’t match what they say they prefer. While Americans are far more likely to prefer spending with small, local businesses, just 36% say about half or more of their spending on their most recent trip went to those businesses. However, the more money consumers make, the more likely they are to say that about half or more of their spending goes to small businesses.
Small businesses in New Orleans and Las Vegas are the most dependent on tourism, but others atop the list may surprise you
When we started this analysis of the metros where small businesses appear to be most dependent on tourism, we expected several well-known tourist destinations to rank highly. We were right.
New Orleans, Las Vegas and Nashville, Tenn. — three of the country’s most recognizable tourism destinations — top the rankings. They’re joined in the top 10 by other well-known tourist destinations such as Portland, Maine (fifth); Memphis, Tenn. (sixth); Los Angeles (seventh); and New York (eighth). No one should be surprised to see any of those metros on any list of American tourism hotspots.
Still, the top 10 did pack a few surprises.
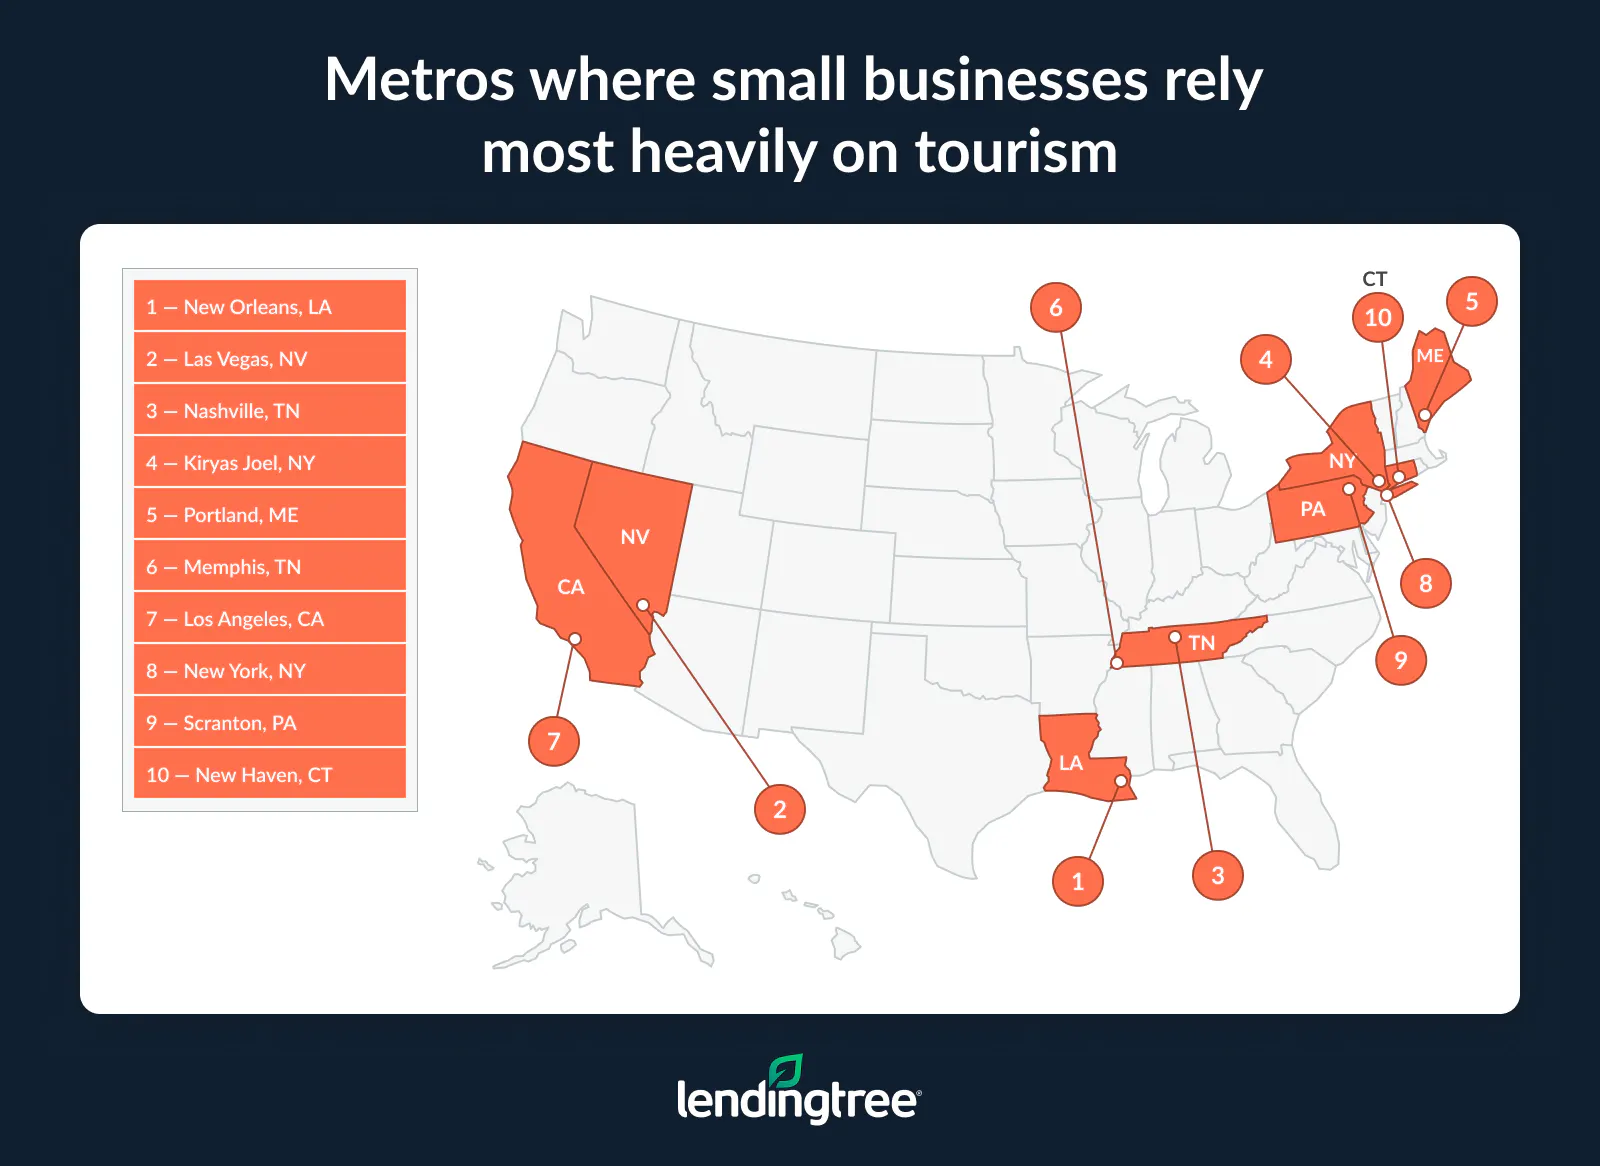
Kiryas Joel, N.Y., ranks fourth. The metro, which also includes Poughkeepsie and Newburgh, N.Y., sits about 90 minutes north of New York City but isn’t widely known as a tourism destination. The same could be said for Scranton, Pa., which places ninth. That area is likely better known as the setting of “The Office” and the fictional Dunder Mifflin Paper Co. than as a tourism hub.
New Haven, Conn., rounds out the top 10. Home to Yale University and a foodie favorite for its New Haven-style pizza, the city is widely considered the birthplace of the hamburger. Even so, it’s not typically considered one of the nation’s premier tourist destinations.
There were surprises at the bottom of the rankings, too. Salt Lake City, a popular destination for outdoor recreation and skiing, ranks last, indicating that its small businesses are the least dependent on tourism among the 100 largest metros. It’s followed by San Jose, Calif.; Phoenix; Minneapolis; and Washington, D.C.
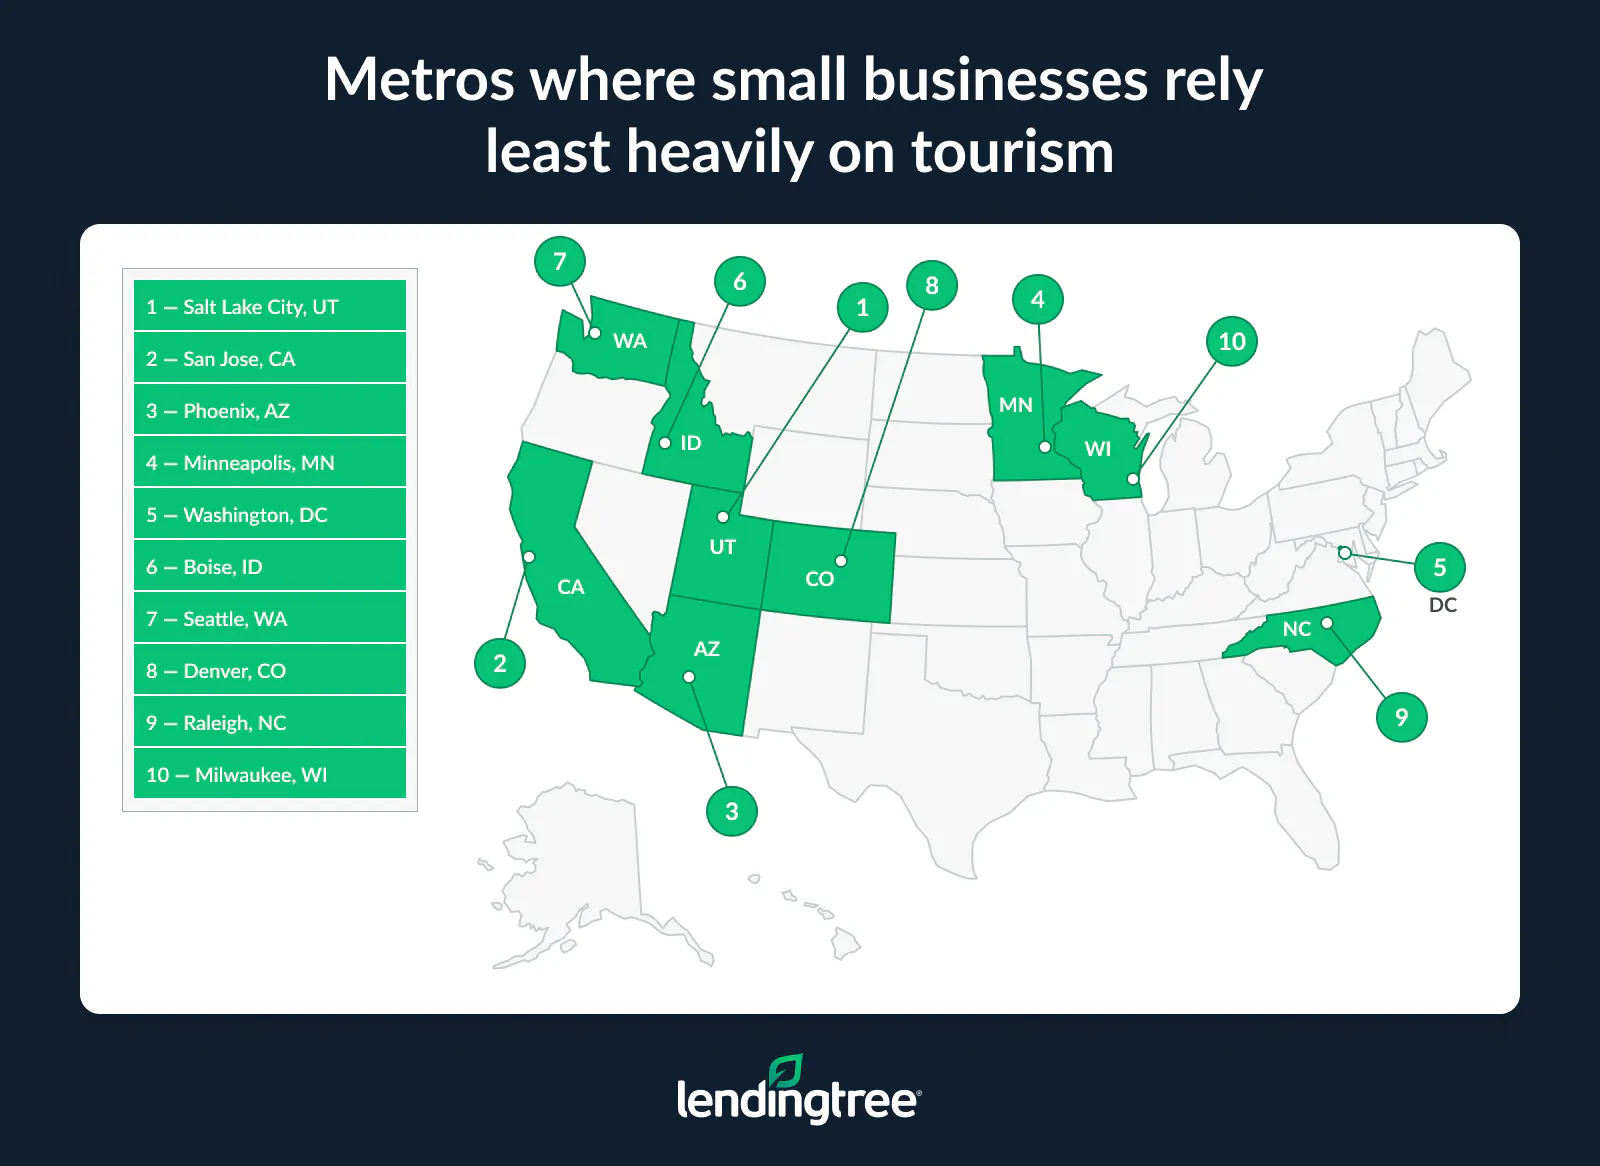
Other well-known tourist destinations appear throughout the rankings, including Orlando, Fla. (26th), Miami (38th), Boston (50th), Austin, Texas (71st), San Diego (83rd) and Chicago (86th).
The rankings don’t mean Kiryas Joel or Scranton attract more visitors than destinations such as Honolulu or Orlando. Rather, they indicate where small businesses appear to depend most heavily on tourism-related spending.
In many large metros, tourism represents a smaller share of the local economy because other industries play a larger role. For example, Washington, D.C., attracts millions of visitors each year, but the federal government is a dominant economic driver. Similarly, in metros such as San Francisco and San Diego, technology and other major industries generate substantial business activity alongside tourism.
Where small businesses depend on tourism the most
| Rank | Metro | Tourism reliance score | Small visitor businesses/1K | Small visitor business share | Visitor business share | Visitor employment share | Visitor payroll share | Business mix | Independent business density/100K | Leisure & hospitality concentration |
|---|---|---|---|---|---|---|---|---|---|---|
| 1 | New Orleans, LA | 68.6 | 265.4 | 93.7% | 28.3% | 29.1% | 17.1% | 0.82 | 1,689.8 | 1.45 |
| 2 | Las Vegas, NV | 65.3 | 231.8 | 90.8% | 25.5% | 42.6% | 31.9% | 0.88 | 1,572.4 | 2.46 |
| 3 | Nashville, TN | 62.1 | 246.8 | 92.6% | 26.6% | 24.1% | 13.9% | 0.90 | 2,089.8 | 1.13 |
| 4 | Kiryas Joel, NY | 61.5 | 258.9 | 95.1% | 27.2% | 28.3% | 17.4% | 0.82 | 1,319.7 | 0.92 |
| 5 | Portland, ME | 60.1 | 241.0 | 95.5% | 25.2% | 25.3% | 15.6% | 0.84 | 1,602.2 | 1.12 |
| 6 | Memphis, TN | 57.2 | 262.2 | 93.1% | 28.2% | 22.8% | 11.8% | 0.75 | 1,666.9 | 1.00 |
| 7 | Los Angeles, CA | 56.5 | 220.0 | 94.3% | 23.3% | 24.6% | 14.5% | 0.98 | 1,825.3 | 1.15 |
| 8 | New York, NY | 53.1 | 234.5 | 95.3% | 24.6% | 20.8% | 9.8% | 0.85 | 1,612.8 | 0.88 |
| 9 | Scranton, PA | 52.6 | 263.7 | 94.7% | 27.8% | 22.7% | 12.4% | 0.76 | 1,029.6 | 0.84 |
| 10 | New Haven, CT | 52.5 | 249.8 | 94.7% | 26.4% | 22.5% | 11.7% | 0.82 | 1,287.8 | 0.80 |
| 11 | Providence, RI | 52.4 | 241.9 | 94.3% | 25.6% | 26.4% | 14.3% | 0.82 | 1,230.4 | 1.11 |
| 12 | McAllen, TX | 52.3 | 249.5 | 91.4% | 27.3% | 30.2% | 21.9% | 0.72 | 1,600.4 | 0.95 |
| 13 | Honolulu, HI | 52.2 | 244.7 | 92.1% | 26.6% | 31.6% | 19.9% | 0.78 | 1,213.9 | 1.47 |
| 14 | Jackson, MS | 51.8 | 252.6 | 93.9% | 26.9% | 25.3% | 13.3% | 0.73 | 1,312.5 | 0.93 |
| 15 | Chattanooga, TN | 50.9 | 254.6 | 93.0% | 27.4% | 25.3% | 14.0% | 0.76 | 1,222.2 | 1.07 |
| 16 | Albany, NY | 50.6 | 251.0 | 94.0% | 26.7% | 24.5% | 12.3% | 0.83 | 1,142.9 | 0.79 |
| 17 | Buffalo, NY | 50.5 | 251.3 | 93.9% | 26.8% | 25.0% | 14.8% | 0.81 | 1,051.6 | 0.95 |
| 18 | El Paso, TX | 50.0 | 246.5 | 92.0% | 26.8% | 31.0% | 18.9% | 0.78 | 1,272.9 | 1.00 |
| 19 | Syracuse, NY | 49.7 | 251.1 | 94.1% | 26.7% | 23.3% | 12.0% | 0.83 | 1,079.7 | 0.84 |
| 20 | Charleston, SC | 49.1 | 227.3 | 92.7% | 24.5% | 31.2% | 17.4% | 0.82 | 1,384.3 | 1.31 |
| 21 (tie) | Rochester, NY | 47.6 | 241.5 | 94.3% | 25.6% | 23.0% | 12.1% | 0.83 | 1,157.3 | 0.84 |
| 21 (tie) | Winston-Salem, NC | 47.6 | 246.4 | 92.9% | 26.5% | 25.2% | 12.7% | 0.79 | 1,202.9 | 1.02 |
| 23 | Virginia Beach, VA | 47.5 | 244.4 | 92.4% | 26.5% | 29.0% | 14.2% | 0.80 | 1,171.7 | 1.00 |
| 24 | Toledo, OH | 46.9 | 251.0 | 92.7% | 27.1% | 24.2% | 11.4% | 0.80 | 1,077.7 | 1.06 |
| 25 | Greenville, SC | 46.2 | 236.5 | 93.3% | 25.3% | 25.3% | 12.9% | 0.79 | 1,238.4 | 1.09 |
| 26 | Orlando, FL | 46.0 | 201.3 | 91.3% | 22.0% | 33.9% | 20.2% | 0.84 | 1,637.7 | 1.89 |
| 27 | Bridgeport, CT | 45.5 | 223.9 | 94.4% | 23.7% | 23.1% | 9.7% | 0.86 | 1,343.9 | 1.00 |
| 28 | Hartford, CT | 44.5 | 239.0 | 94.0% | 25.4% | 20.9% | 9.5% | 0.81 | 1,186.9 | 0.79 |
| 29 (tie) | Knoxville, TN | 44.3 | 242.9 | 92.1% | 26.4% | 25.0% | 12.9% | 0.78 | 1,192.8 | 1.06 |
| 29 (tie) | Allentown, PA | 44.3 | 237.2 | 93.6% | 25.3% | 23.4% | 12.3% | 0.80 | 1,131.9 | 0.92 |
| 31 (tie) | Baton Rouge, LA | 43.2 | 234.8 | 92.9% | 25.3% | 23.3% | 10.6% | 0.77 | 1,317.2 | 1.00 |
| 31 (tie) | Dayton, OH | 43.2 | 243.5 | 92.9% | 26.2% | 23.7% | 11.3% | 0.78 | 1,059.7 | 0.97 |
| 33 | Columbia, SC | 43.0 | 235.8 | 92.5% | 25.5% | 27.4% | 14.5% | 0.77 | 1,177.8 | 0.95 |
| 34 | Birmingham, AL | 42.6 | 234.6 | 93.4% | 25.1% | 23.5% | 11.1% | 0.76 | 1,239.1 | 0.92 |
| 35 | San Antonio, TX | 42.3 | 230.4 | 91.4% | 25.2% | 27.7% | 15.1% | 0.80 | 1,252.9 | 1.20 |
| 36 (tie) | Riverside, CA | 41.9 | 221.8 | 92.4% | 24.0% | 31.4% | 20.7% | 0.80 | 1,114.1 | 1.03 |
| 36 (tie) | Detroit, MI | 41.9 | 228.3 | 93.8% | 24.3% | 21.6% | 10.5% | 0.78 | 1,288.9 | 0.90 |
| 38 (tie) | Greensboro, NC | 41.4 | 230.4 | 93.1% | 24.7% | 23.5% | 11.8% | 0.79 | 1,190.9 | 0.98 |
| 38 (tie) | Miami, FL | 41.4 | 176.7 | 93.0% | 19.0% | 28.2% | 16.5% | 0.83 | 2,236.8 | 1.15 |
| 40 | Lexington, KY | 41.2 | 223.1 | 92.2% | 24.2% | 25.7% | 13.6% | 0.83 | 1,309.2 | 1.06 |
| 41 | Reno, NV | 41.1 | 207.4 | 93.5% | 22.2% | 29.4% | 16.8% | 0.87 | 1,075.2 | 1.35 |
| 42 (tie) | Pittsburgh, PA | 39.9 | 223.2 | 93.6% | 23.9% | 21.8% | 10.8% | 0.82 | 1,166.8 | 1.01 |
| 42 (tie) | Lancaster, PA | 39.9 | 216.0 | 93.3% | 23.2% | 22.5% | 12.0% | 0.77 | 1,508.5 | 0.94 |
| 44 | Cleveland, OH | 39.8 | 224.0 | 93.2% | 24.0% | 22.3% | 11.8% | 0.81 | 1,229.1 | 0.94 |
| 45 | Atlanta, GA | 39.6 | 205.3 | 92.8% | 22.1% | 23.2% | 10.3% | 0.83 | 1,717.0 | 1.00 |
| 46 | Little Rock, AR | 39.3 | 223.2 | 93.5% | 23.9% | 23.9% | 12.3% | 0.75 | 1,224.2 | 0.93 |
| 47 | Worcester, MA | 39.2 | 221.5 | 93.9% | 23.6% | 22.3% | 11.4% | 0.80 | 1,204.3 | 0.82 |
| 48 | Oxnard, CA | 39.1 | 202.0 | 93.1% | 21.7% | 28.5% | 15.0% | 0.89 | 1,295.1 | 1.05 |
| 49 | Madison, WI | 38.5 | 221.6 | 92.6% | 23.9% | 22.4% | 10.3% | 0.86 | 1,250.4 | 0.89 |
| 50 | Boston, MA | 37.4 | 217.3 | 93.1% | 23.3% | 20.4% | 8.9% | 0.84 | 1,302.6 | 0.94 |
| 51 | Houston, TX | 37.1 | 217.1 | 92.1% | 23.6% | 24.3% | 10.2% | 0.78 | 1,402.9 | 1.03 |
| 52 | Cincinnati, OH | 36.8 | 227.1 | 91.8% | 24.7% | 22.8% | 11.0% | 0.80 | 1,115.7 | 1.10 |
| 53 | Harrisburg, PA | 36.7 | 223.3 | 92.6% | 24.1% | 22.4% | 11.4% | 0.81 | 1,175.7 | 0.86 |
| 54 | Louisville, KY | 36.5 | 220.8 | 92.7% | 23.8% | 22.3% | 11.6% | 0.80 | 1,165.2 | 0.98 |
| 55 | Columbus, OH | 36.2 | 222.5 | 91.9% | 24.2% | 22.4% | 11.4% | 0.81 | 1,232.2 | 0.95 |
| 56 (tie) | Tucson, AZ | 36.1 | 212.0 | 91.5% | 23.2% | 31.7% | 17.4% | 0.81 | 1,098.6 | 1.08 |
| 56 (tie) | Portland, OR | 36.1 | 196.7 | 94.2% | 20.9% | 22.4% | 11.2% | 0.84 | 1,426.6 | 0.91 |
| 58 | Albuquerque, NM | 35.9 | 217.0 | 91.6% | 23.7% | 28.2% | 15.9% | 0.81 | 1,112.4 | 1.05 |
| 59 | St. Louis, MO | 35.8 | 209.7 | 92.7% | 22.6% | 22.9% | 10.8% | 0.82 | 1,325.6 | 1.04 |
| 60 (tie) | Oklahoma City, OK | 35.7 | 207.1 | 92.5% | 22.4% | 28.4% | 15.3% | 0.79 | 1,199.5 | 1.11 |
| 60 (tie) | Colorado Springs, CO | 35.7 | 195.0 | 92.5% | 21.1% | 27.7% | 15.3% | 0.84 | 1,379.7 | 1.22 |
| 62 | Provo, UT | 35.6 | 190.0 | 94.2% | 20.2% | 22.0% | 11.5% | 0.84 | 1,598.6 | 0.90 |
| 63 | Tulsa, OK | 35.5 | 209.9 | 93.2% | 22.5% | 24.8% | 12.4% | 0.79 | 1,204.0 | 0.99 |
| 64 (tie) | Sacramento, CA | 35.3 | 207.0 | 93.2% | 22.2% | 27.2% | 13.8% | 0.82 | 1,105.5 | 0.96 |
| 64 (tie) | Sarasota, FL | 35.3 | 187.2 | 92.1% | 20.3% | 33.1% | 21.6% | 0.81 | 1,369.3 | 1.34 |
| 66 | Akron, OH | 35.3 | 217.3 | 92.1% | 23.6% | 23.7% | 11.9% | 0.80 | 1,209.9 | 0.96 |
| 67 | Fresno, CA | 35.0 | 222.4 | 93.3% | 23.8% | 26.0% | 15.2% | 0.77 | 835.2 | 0.80 |
| 68 (tie) | Wichita, KS | 34.8 | 217.4 | 92.6% | 23.5% | 24.7% | 12.0% | 0.78 | 1,093.0 | 1.02 |
| 68 (tie) | Richmond, VA | 34.8 | 207.0 | 92.2% | 22.5% | 24.5% | 11.4% | 0.81 | 1,412.1 | 0.95 |
| 70 | Jacksonville, FL | 34.5 | 204.9 | 92.5% | 22.2% | 26.0% | 14.5% | 0.80 | 1,225.0 | 1.13 |
| 71 (tie) | Austin, TX | 34.3 | 194.7 | 91.9% | 21.2% | 26.4% | 12.3% | 0.87 | 1,502.8 | 1.08 |
| 71 (tie) | Dallas, TX | 34.3 | 207.2 | 92.0% | 22.5% | 22.5% | 10.6% | 0.81 | 1,470.3 | 0.98 |
| 73 | Fayetteville, AR | 34.1 | 207.0 | 92.8% | 22.3% | 23.7% | 10.3% | 0.81 | 1,252.9 | 1.08 |
| 74 | Baltimore, MD | 34.0 | 206.9 | 92.0% | 22.5% | 23.2% | 11.5% | 0.82 | 1,439.1 | 0.89 |
| 75 | Philadelphia, PA | 33.7 | 213.0 | 92.7% | 23.0% | 20.8% | 9.9% | 0.82 | 1,219.8 | 0.90 |
| 76 (tie) | Des Moines, IA | 33.5 | 207.3 | 93.0% | 22.3% | 22.5% | 10.0% | 0.83 | 1,233.3 | 0.89 |
| 76 (tie) | Lakeland, FL | 33.5 | 210.4 | 92.3% | 22.8% | 25.7% | 15.3% | 0.75 | 1,214.4 | 0.93 |
| 78 | Charlotte, NC | 33.4 | 203.7 | 92.4% | 22.0% | 24.0% | 11.4% | 0.83 | 1,259.9 | 1.07 |
| 79 (tie) | Spokane, WA | 32.7 | 199.9 | 94.0% | 21.3% | 24.0% | 14.4% | 0.82 | 1,067.2 | 0.90 |
| 79 (tie) | Indianapolis, IN | 32.7 | 208.7 | 92.3% | 22.6% | 23.1% | 12.1% | 0.83 | 1,186.1 | 0.94 |
| 79 (tie) | Tampa, FL | 32.7 | 193.4 | 92.7% | 20.9% | 25.7% | 14.1% | 0.82 | 1,350.7 | 1.09 |
| 82 | San Francisco, CA | 31.9 | 199.8 | 93.9% | 21.3% | 19.3% | 6.5% | 0.85 | 1,247.3 | 0.96 |
| 83 | San Diego, CA | 31.7 | 190.9 | 92.5% | 20.6% | 26.3% | 13.2% | 0.85 | 1,261.6 | 1.22 |
| 84 | Stockton, CA | 31.1 | 216.5 | 93.0% | 23.3% | 24.9% | 14.4% | 0.76 | 830.8 | 0.78 |
| 85 | Grand Rapids, MI | 29.7 | 204.6 | 92.6% | 22.1% | 20.2% | 10.5% | 0.80 | 1,243.9 | 0.83 |
| 86 | Chicago, IL | 29.2 | 192.3 | 92.7% | 20.8% | 21.0% | 9.6% | 0.84 | 1,370.9 | 0.97 |
| 87 | Cape Coral, FL | 28.9 | 184.0 | 91.3% | 20.1% | 32.3% | 19.0% | 0.80 | 1,205.9 | 1.30 |
| 88 | Durham, NC | 28.8 | 205.3 | 92.3% | 22.2% | 18.0% | 6.5% | 0.84 | 1,297.8 | 0.77 |
| 89 | Omaha, NE | 28.3 | 196.6 | 92.2% | 21.3% | 23.9% | 11.5% | 0.85 | 1,085.5 | 1.05 |
| 90 | Kansas City, MO | 27.9 | 195.9 | 91.8% | 21.3% | 22.8% | 11.3% | 0.81 | 1,277.2 | 1.00 |
| 91 | Milwaukee, WI | 27.8 | 202.8 | 91.8% | 22.1% | 21.0% | 9.8% | 0.83 | 1,167.6 | 0.92 |
| 92 | Raleigh, NC | 26.1 | 193.1 | 91.0% | 21.2% | 25.4% | 11.3% | 0.83 | 1,247.0 | 1.02 |
| 93 | Denver, CO | 26.0 | 177.4 | 92.3% | 19.2% | 23.2% | 12.0% | 0.85 | 1,427.8 | 1.01 |
| 94 | Seattle, WA | 25.5 | 188.7 | 93.2% | 20.2% | 21.1% | 9.2% | 0.84 | 1,100.7 | 0.89 |
| 95 | Boise, ID | 23.7 | 170.3 | 93.1% | 18.3% | 24.7% | 13.1% | 0.83 | 1,274.1 | 0.97 |
| 96 | Washington, DC | 23.3 | 183.0 | 91.5% | 20.0% | 21.1% | 9.0% | 0.83 | 1,417.7 | 0.94 |
| 97 | Minneapolis, MN | 22.1 | 179.2 | 91.5% | 19.6% | 20.9% | 9.6% | 0.86 | 1,383.2 | 0.90 |
| 98 | Phoenix, AZ | 20.7 | 184.0 | 90.2% | 20.4% | 25.5% | 14.5% | 0.82 | 1,164.3 | 1.03 |
| 99 | San Jose, CA | 18.4 | 191.0 | 93.1% | 20.5% | 15.8% | 4.1% | 0.81 | 868.3 | 0.84 |
| 100 | Salt Lake City, UT | 17.9 | 173.7 | 91.7% | 18.9% | 20.6% | 10.3% | 0.83 | 1,267.1 | 0.81 |
Americans are nearly three times as likely to prefer small, local businesses as large, national chains
In addition to analyzing government data, we surveyed Americans about whether they prefer small, local businesses or large national chains when traveling.
The results were clear: 44% of consumers prefer to support smaller businesses when traveling for leisure or vacation, including 21% who strongly prefer them, while just 15% say they prefer large companies and national chains. That includes 6% who strongly prefer them. Another 41% have no preference.
Americans with children younger than 18 are among the most likely to prefer small businesses when traveling, with more than half (54%) doing so, compared with 40% of those without kids.
Gen Zers ages 18 to 29 are the most likely generation to prefer small businesses, while Gen Xers ages 46 to 61 are the least likely. More than half of Gen Zers (54%) say they prefer small or local businesses, while 45% of millennials ages 30 to 45, 41% of baby boomers ages 62 to 80 and 40% of Gen Xers say the same.
Millennials are the most likely generation to prefer large companies or national chains, with about 1 in 6 millennials (17%) saying so.
Unfortunately for small businesses, Americans’ travel spending habits don’t match their preferences
While consumers say they prefer small businesses over large national chains, our survey suggests those preferences don’t always translate into spending behavior. Just 36% of Americans say about half or more of their spending on their most recent trip went to small businesses. Just 17% say most or all of their spending on their most recent trip went to local businesses.
The gap doesn’t necessarily mean consumers are overstating their preferences. When traveling, large chains may be more convenient, more widely available or less expensive than local businesses, making them the easier choice.
Despite being the most likely age group to prefer small businesses, Gen Zers are also the most likely generation to report spending none or only a little of their travel budget at local businesses (38%). That compares with 30% of millennials, 31% of boomers and 34% of Gen Xers.
There’s good news, though: The more money consumers make, the more likely they are to say that about half or more of their spending goes to small businesses. Americans with children younger than 18 are also likely to follow through on that preference. About 1 in 5 (21%) spent most or all of their travel budget at local businesses, versus just 15% of those without children.
Turning good intentions into real spending
Tourism can be a lifeline for small businesses, but attracting visitors requires more than opening the doors. Vacationers have limited time, are unfamiliar with their surroundings and have dozens of competing options, many backed by national marketing budgets and prime locations. For independent businesses, success often comes from making it as easy as possible for visitors to discover, trust and choose them.
Travelers also have more influence than they may realize. Supporting local businesses doesn’t have to mean avoiding every chain restaurant or hotel or spending dramatically more money. In many cases, small decisions, such as where to grab breakfast or buy souvenirs, can redirect meaningful dollars into the local economy. With a little planning, businesses and travelers can help narrow the gap between consumers’ stated preferences and their spending.
Tips for small businesses hoping to attract more tourist spending
- Make it easy for visitors to find you online. Many travelers decide where they’ll eat, shop or stop while they’re already on the road. Keep your Google Business Profile current, encourage customer reviews and ensure your hours, address and contact information are accurate everywhere they appear online.
- Give visitors a reason to choose you over a chain. Tourists aren’t usually looking for the same experience they can get back home. Highlight local products, regional flavors, unique experiences or your business’s story. Authenticity is often one of the biggest competitive advantages independent businesses have.
- Build relationships with other local businesses. Hotels, visitor centers, tour operators and neighboring shops all interact with tourists. Working with them on promotions, referrals and events can help visitors discover businesses they otherwise might never have found.
- Think beyond peak tourism season. Many destinations experience sharp swings in visitor traffic throughout the year. Building loyalty with local customers and creating promotions during slower periods can help smooth revenue when tourist numbers inevitably decline.
Tips for travelers who want to support small businesses without overspending
- Choose a few purchases that’ll have the biggest local impact. You don’t have to avoid every national chain to make a difference. Eating at a locally owned restaurant, shopping at an independent bookstore or buying gifts from neighborhood artisans can help direct more of your travel dollars to the local economy.
- Plan one or two local stops before you leave home. Researching independent coffee shops, restaurants and other local businesses in advance can make supporting small businesses just as convenient as visiting familiar chains. It also reduces the temptation to default to the first recognizable brand you see.
- Look beyond the busiest tourist districts. Businesses just a few blocks away from major attractions often offer lower prices, shorter lines and a more authentic local experience. You may save money while discovering places many visitors overlook.
- Spend where it matters most to you. If your lodging or transportation stretches your budget, focus your local spending elsewhere. A meal, museum ticket or handmade souvenir from a small business can still have a meaningful impact without significantly increasing the cost of your trip.
- Remember that value isn’t always about the lowest price. Independent businesses may not always be the cheapest option, but they often provide products or experiences that national chains can’t replicate. Sometimes paying a little more can create a better memory while also supporting the community you’re visiting.
Methodology
LendingTree ranked the 100 largest U.S. metros across eight metrics to identify where small businesses appear to rely most heavily on tourism. Together, these metrics capture the extent to which a metro’s economy is oriented toward serving visitors.
We utilized 2024 annual averages from the U.S. Bureau of Labor Statistics (BLS) Quarterly Census of Employment and Wages (QCEW) — the latest full year available — and the U.S. Census Bureau’s 2023 County Business Patterns (CBP) — also the latest available.
For this study, visitor-facing establishments are defined as businesses in three industries: retail trade; arts, entertainment and recreation; and accommodation and food services (NAICS 44-45, 71 and 72). We selected these industries because they’re most directly supported by visitor spending and provide a strong proxy for businesses that benefit from tourism. They include restaurants, hotels, shops, attractions, galleries, entertainment venues and recreation businesses. References to small visitor-facing establishments are limited to establishments in these industries with fewer than 50 employees.
The eight metrics used in this analysis were:
- Small visitor-facing establishments per 1,000 private establishments: The number of visitor-facing establishments with fewer than 50 employees per 1,000 private establishments.
- Small visitor-facing establishment share: The share of visitor-facing establishments with fewer than 50 employees.
- Visitor-facing establishment share: The share of all private establishments that are visitor-facing.
- Visitor-facing employment share: The share of private employment in visitor-facing industries.
- Visitor-facing payroll share: The share of private annual payroll paid by visitor-facing industries.
- Visitor business mix: Measures how evenly small visitor-facing establishments are distributed across retail trade; arts, entertainment and recreation; and accommodation and food services. Scores range from 0.00 to 1.00, with higher scores indicating a more balanced mix of visitor-serving businesses across these sectors.
- Nonemployer visitor-facing business density: Measures the number of visitor-facing businesses without paid employees per 100,000 residents. Higher values indicate a greater concentration of self-employed and sole proprietor visitor-serving businesses relative to the local population.
- Leisure and hospitality employment concentration: Measures how concentrated leisure and hospitality employment is in a metro relative to the national average using a location quotient (LQ). An LQ of 1.00 indicates the metro matches the national average, while values above 1.00 indicate a greater reliance on the leisure and hospitality sector.
Each metro was scored across all metrics. To create our final score, we assigned a weight to each metric and ranked the metros based on the resulting weighted score.
Additionally, LendingTree commissioned QuestionPro to conduct an online survey of 2,000 U.S. consumers ages 18 to 80 from June 2 to 11, 2026. The survey was administered using a nonprobability-based sample, and quotas were used to help ensure the sample reflected the overall population. Researchers reviewed all responses for quality control.
We defined generations as the following ages in 2026:
- Generation Z: 18 to 29
- Millennial: 30 to 45
- Generation X: 46 to 61
- Baby boomer: 62 to 80
Compare business loan offers