Most Active Metros for Gen Z Homebuyers
Gen Z is steadily carving out its place in the housing market, accounting for 19.9% of mortgage requests nationally.
However, while younger buyers now make up a meaningful share of mortgage activity nationwide, their presence is much stronger in some markets than in others. Our study found that their influence is especially pronounced in more affordable Midwestern metros, and far less visible in high-cost coastal cities.
Here’s a closer look.
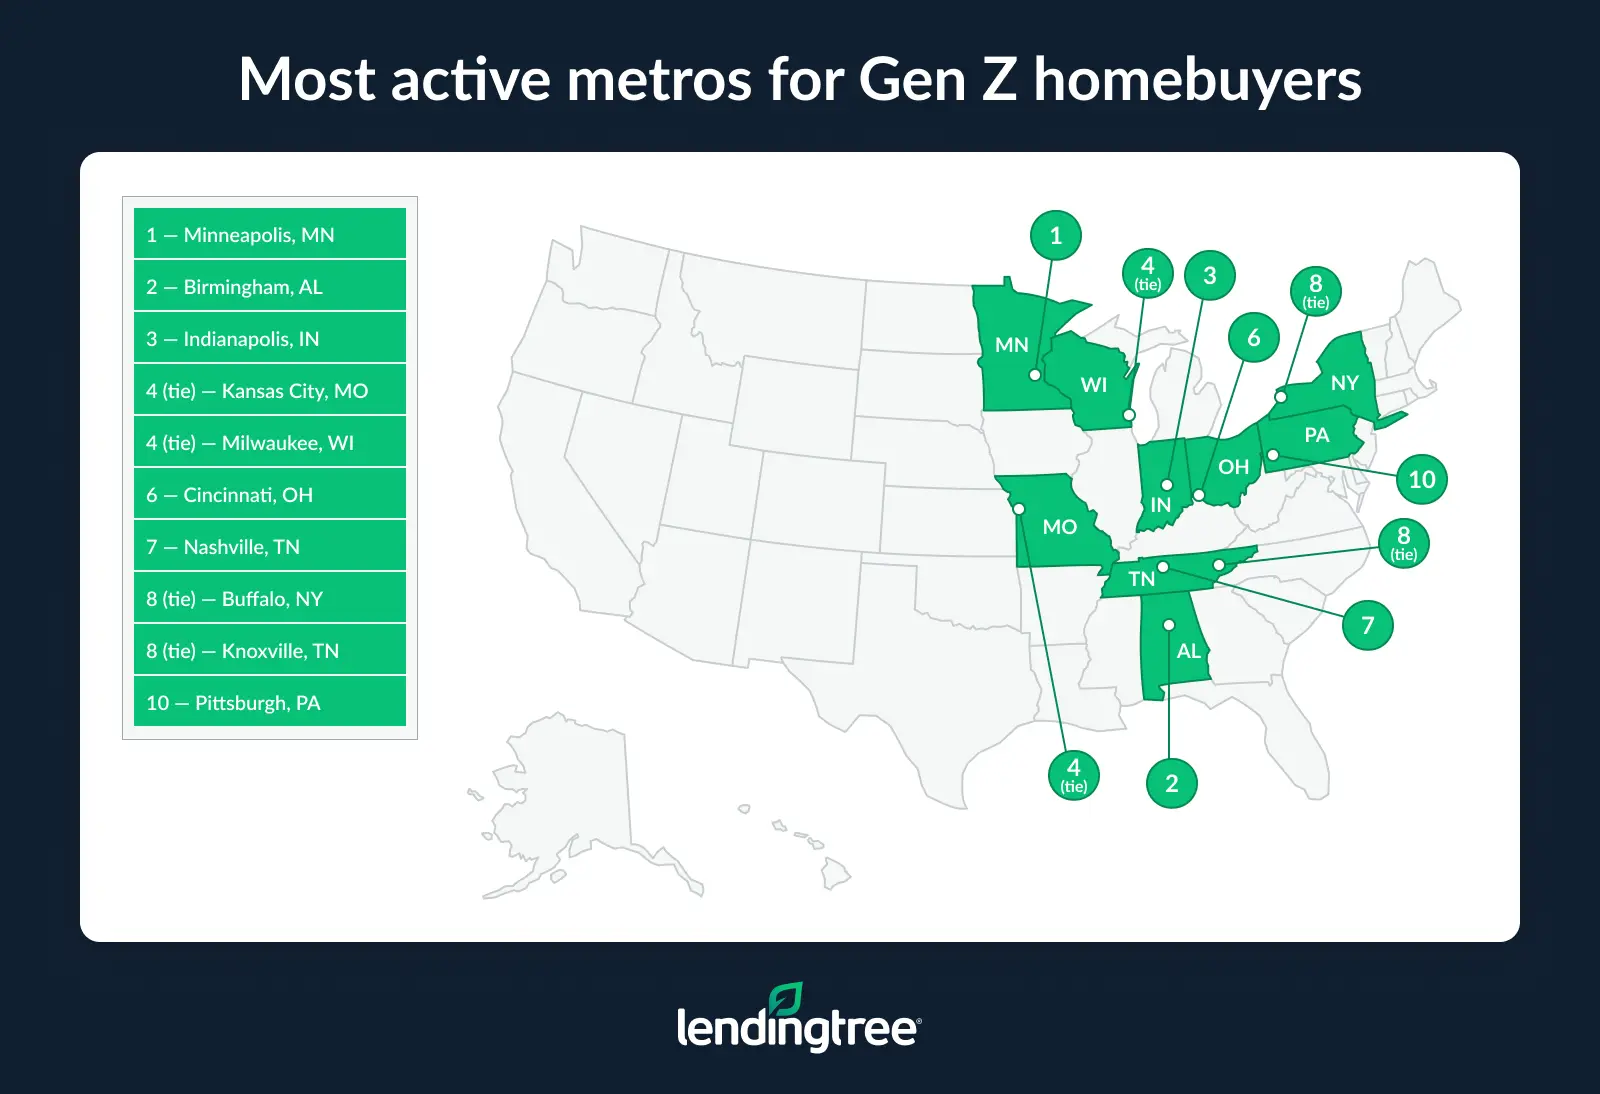
- Gen Zers account for nearly 1 in 5 (19.9%) mortgage purchase requests nationwide, with the highest shares concentrated in Midwestern metros. Minneapolis (26.4%), Birmingham, Ala. (25.7%), and Indianapolis (24.6%) have the largest Gen Z shares.
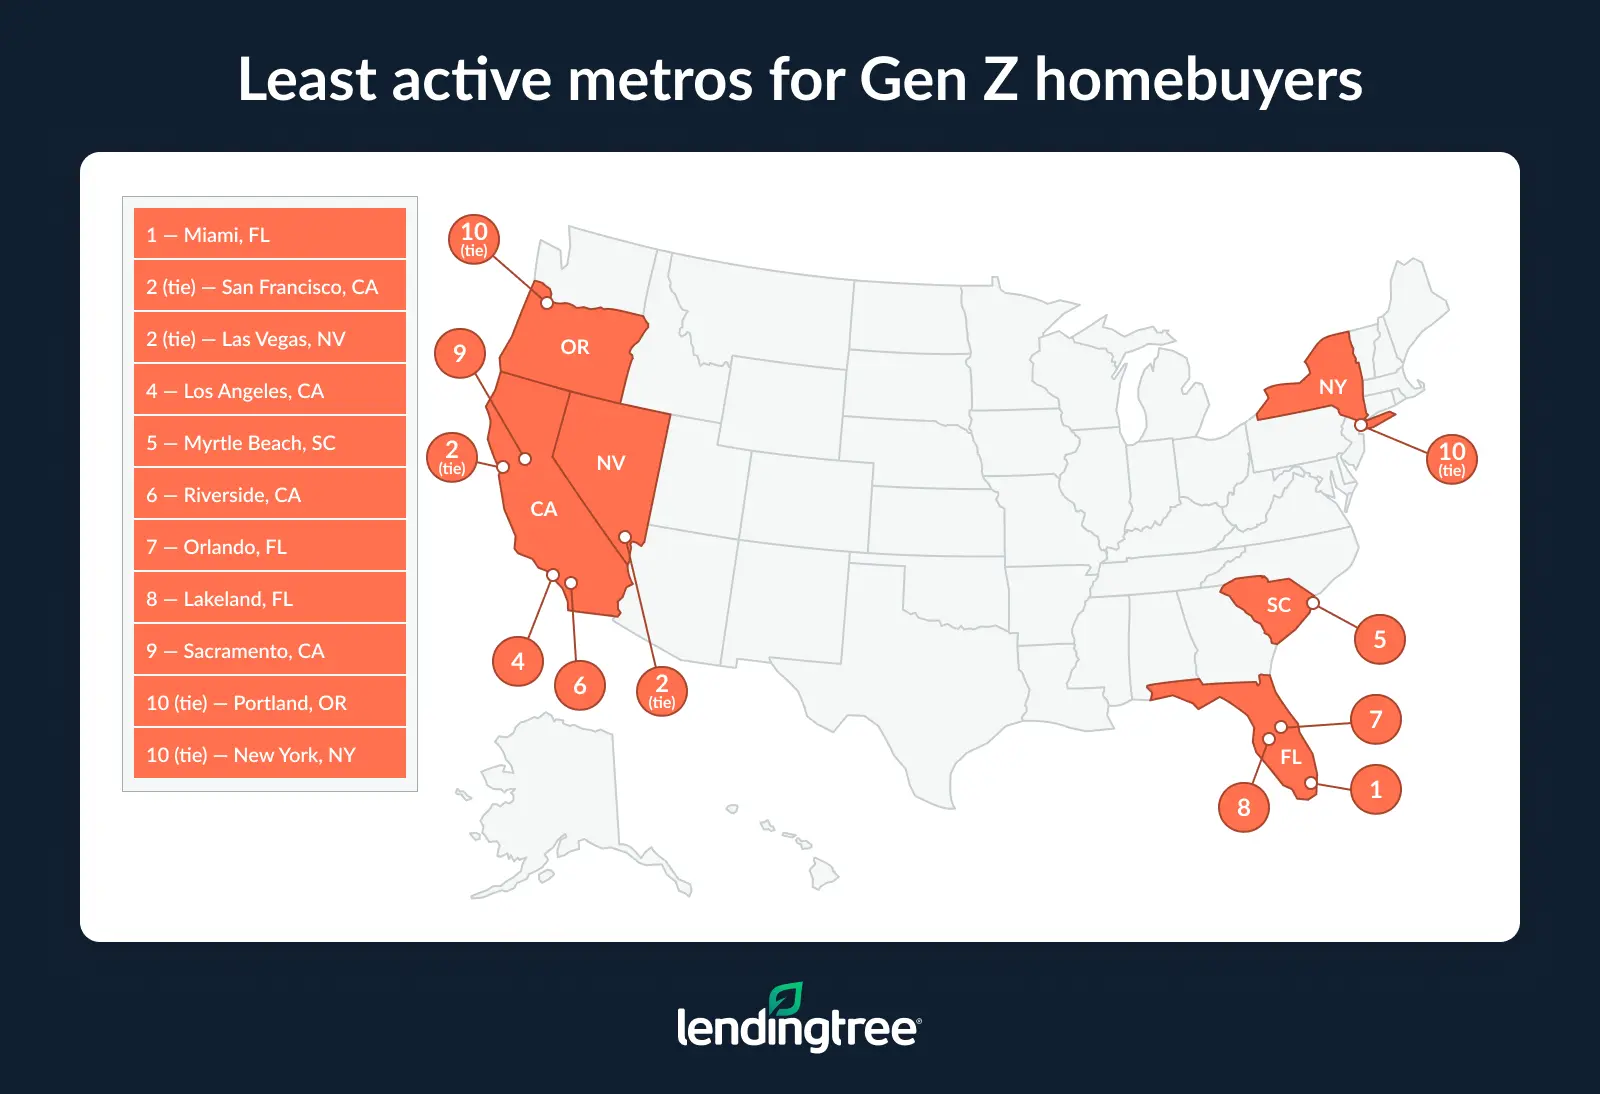
- High-cost coastal markets lag. Miami (12.4%), San Francisco (12.8%) and Las Vegas (12.8%) have the lowest shares of Gen Z buyers.
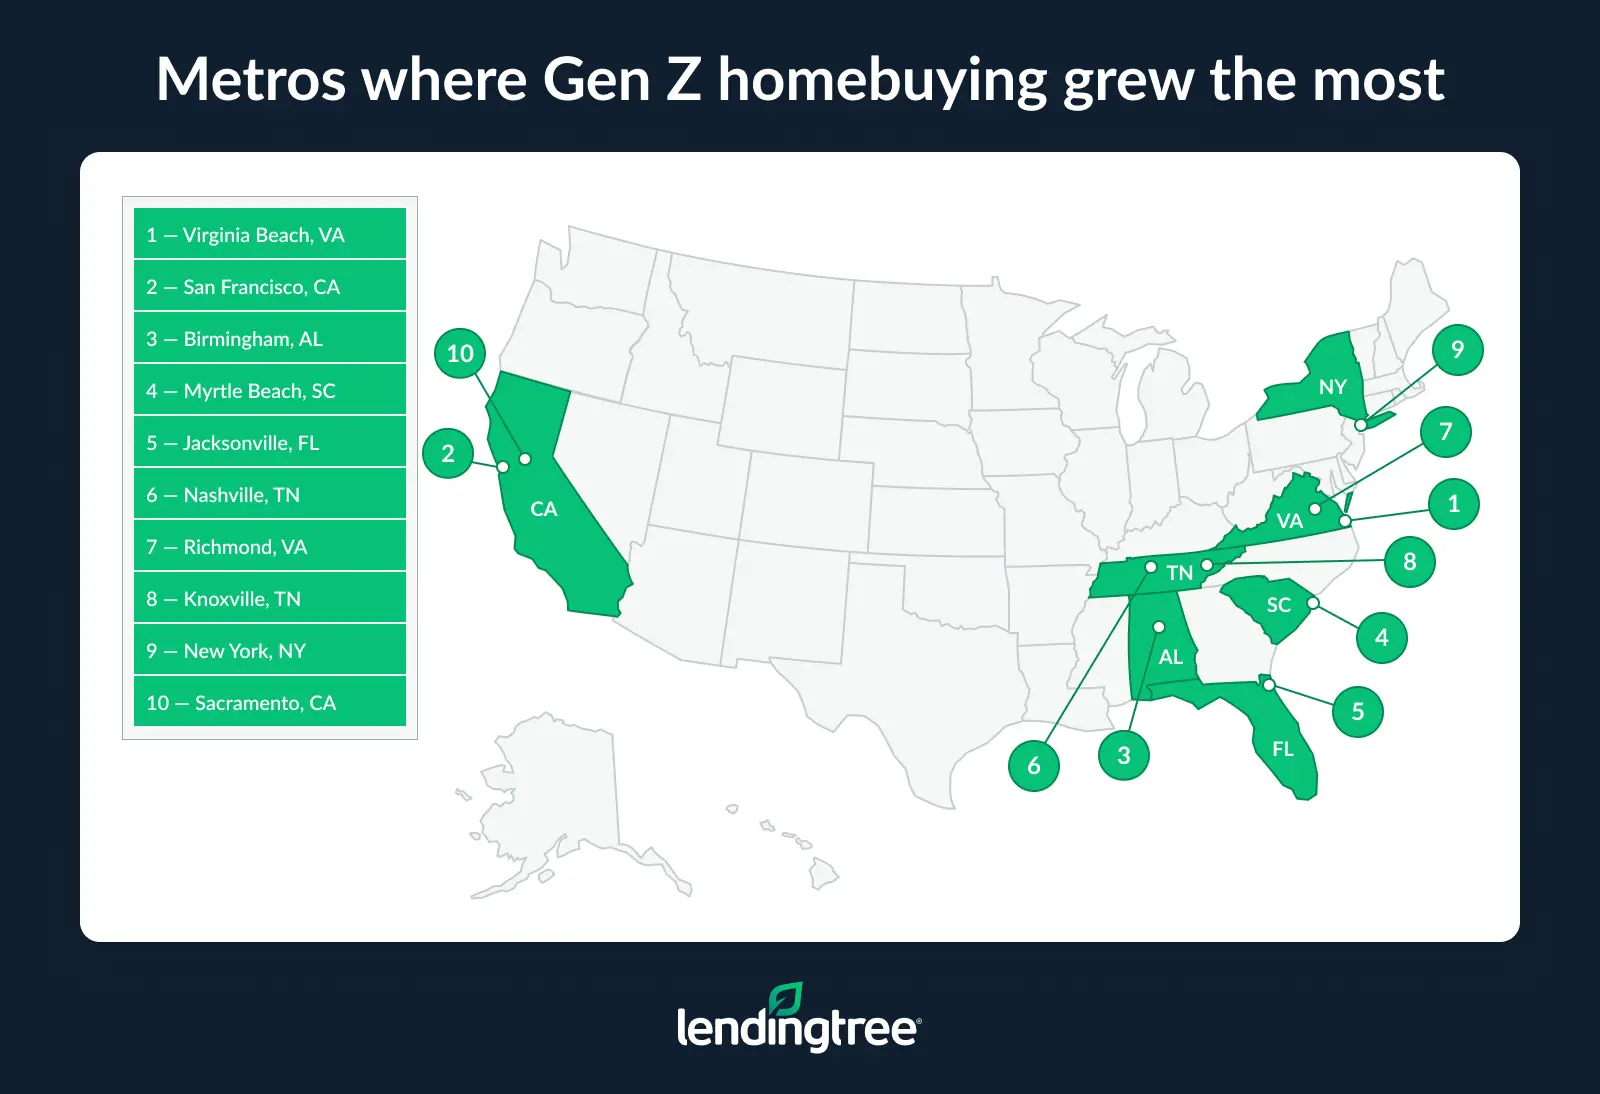
- Gen Z homebuying activity increased nationwide from 2024 to 2025. The national share rose by 9.9%, with Virginia Beach, Va. (37.1%), San Francisco (33.9%) and Birmingham (30.9%) seeing the largest increases.
- Millennials account for the largest share of mortgage requests, making up 40.5% in 2025, versus 19.9% for Gen Zers. Additionally, Gen Z buyers had lower down payments ($44,966 versus $72,412 among millennials) and smaller loan amounts ($274,794 versus $356,655).
Gen Zers account for 19.9% of mortgage requests
Gen Zers — those ages 18 to 28 in 2025, the focus of this analysis — comprise nearly 1 in 5 (19.9%) mortgage purchase requests nationwide. These Gen Zers have an average credit score of 674, with an average down payment of $44,966 and an average requested loan amount of $274,794.
Across the 50 largest U.S. metros, their presence is especially strong in the Midwest. Minneapolis ranks first, with Gen Zers accounting for 26.4% of mortgage purchase requests there. Birmingham, Ala. (25.7%), and Indianapolis (24.6%) follow.
Matt Schulz, LendingTree chief consumer finance analyst and author of “Ask Questions, Save Money, Make More: How to Take Control of Your Financial Life,” says that affordability definitely plays a role in the popularity of these metros.
“These three metros are considered affordable, though they’re quite different in terms of income levels,” he says. “Minneapolis has the highest incomes of the three, with Indianapolis next, and then Birmingham. Minneapolis also has the advantage of being in a state whose residents typically have high credit scores.”
The average credit score among Gen Z homebuyers in Minneapolis is 690, compared with 667 in Birmingham and 679 in Indianapolis. “Those higher scores mean they’re more likely to be able to get a mortgage if they want one,” Schulz says of Gen Z buyers in Minneapolis.
Expensive markets have lowest Gen Z interest
Conversely, high-cost coastal markets are less popular among Gen Zers. Miami (12.4%), San Francisco (12.8%) and Las Vegas (12.8%) have the lowest shares of Gen Z buyers.
That could be due to the financial hurdles that homebuyers in these areas face. San Francisco and Miami have among the top 10 highest average down payments for Gen Zers, at $140,005 and $64,393, respectively. San Francisco also has the largest average requested loan amount ($621,577) and the highest average credit score (699).
Still, Schulz says that Gen Zers’ presence in these areas could change over time.
“Right now, many Gen Zers may not yet have the credit scores, incomes or savings needed to afford homes in these markets,” he says. “But as they move into their prime earning years over the next couple of decades, more opportunities will open up.”
In the meantime, those eager to break into these markets may need to take a more flexible approach. “They could explore mortgages that require low or even no down payment, if they qualify,” Schulz says. “They might look in more affordable areas on the outskirts of a metro, consider smaller homes that better fit their budget or use high-yield savings accounts to build their down payment.”
None of these strategies makes buying in expensive markets easy, but for Gen Z buyers willing to adapt, they can improve the odds of getting their foot in the door.
Full rankings: Most popular metros for Gen Z homebuyers in 2025
| Rank | Metro | Share of mortgage purchase requests | Avg. credit score | Avg. down payment | Avg. requested loan amount |
|---|---|---|---|---|---|
| 1 | Minneapolis, MN | 26.4% | 690 | $46,849 | $288,483 |
| 2 | Birmingham, AL | 25.7% | 667 | $37,932 | $223,750 |
| 3 | Indianapolis, IN | 24.6% | 679 | $37,371 | $237,966 |
| 4 | Kansas City, MO | 24.5% | 677 | $38,459 | $247,056 |
| 4 | Milwaukee, WI | 24.5% | 684 | $43,777 | $257,503 |
| 6 | Cincinnati, OH | 24.1% | 679 | $35,312 | $222,219 |
| 7 | Nashville, TN | 24.0% | 685 | $55,212 | $331,382 |
| 8 | Buffalo, NY | 23.9% | 678 | $35,143 | $209,128 |
| 8 | Knoxville, TN | 23.9% | 675 | $40,276 | $265,596 |
| 10 | Pittsburgh, PA | 23.6% | 680 | $34,117 | $196,939 |
| 11 | St. Louis, MO | 23.5% | 674 | $35,388 | $205,928 |
| 12 | Louisville, KY | 23.4% | 672 | $34,810 | $221,418 |
| 12 | Columbus, OH | 23.4% | 678 | $41,654 | $248,536 |
| 14 | Greenville, SC | 23.1% | 673 | $33,734 | $230,766 |
| 15 | Charleston, SC | 22.1% | 680 | $47,756 | $321,961 |
| 16 | Oklahoma City, OK | 21.8% | 668 | $30,445 | $215,795 |
| 17 | Detroit, MI | 21.6% | 680 | $39,186 | $219,070 |
| 18 | Charlotte, NC | 21.2% | 680 | $50,479 | $292,938 |
| 19 | Virginia Beach, VA | 21.1% | 672 | $36,934 | $273,525 |
| 20 | Cleveland, OH | 20.9% | 682 | $35,341 | $202,361 |
| 21 | Denver, CO | 20.5% | 690 | $66,560 | $396,187 |
| 22 | Philadelphia, PA | 19.9% | 676 | $52,706 | $295,859 |
| 23 | Jacksonville, FL | 19.7% | 668 | $40,017 | $262,387 |
| 24 | Phoenix, AZ | 19.3% | 675 | $53,302 | $338,234 |
| 24 | Raleigh, NC | 19.3% | 690 | $54,000 | $310,586 |
| 24 | Chicago, IL | 19.3% | 685 | $55,349 | $280,590 |
| 27 | Dallas, TX | 19.0% | 675 | $48,669 | $292,872 |
| 28 | Boston, MA | 18.6% | 697 | $97,467 | $470,873 |
| 29 | Baltimore, MD | 18.3% | 685 | $47,956 | $295,688 |
| 30 | Richmond, VA | 18.2% | 683 | $45,109 | $277,012 |
| 31 | Austin, TX | 17.6% | 686 | $58,860 | $342,383 |
| 32 | San Antonio, TX | 17.4% | 667 | $36,713 | $252,493 |
| 33 | Memphis, TN | 17.2% | 668 | $36,193 | $236,007 |
| 34 | San Diego, CA | 16.6% | 689 | $95,513 | $572,894 |
| 35 | Houston, TX | 16.5% | 666 | $40,789 | $266,155 |
| 36 | Atlanta, GA | 16.4% | 673 | $50,262 | $300,729 |
| 37 | Seattle, WA | 16.3% | 689 | $85,016 | $450,406 |
| 38 | Washington, DC | 16.2% | 690 | $73,575 | $399,476 |
| 39 | Tampa, FL | 16.0% | 674 | $44,894 | $284,746 |
| 40 | New York, NY | 15.6% | 688 | $92,504 | $447,608 |
| 40 | Portland, OR | 15.6% | 679 | $57,978 | $361,915 |
| 42 | Sacramento, CA | 15.4% | 687 | $59,140 | $402,309 |
| 43 | Lakeland, FL | 14.6% | 658 | $34,216 | $240,711 |
| 44 | Orlando, FL | 14.5% | 672 | $44,300 | $285,386 |
| 45 | Riverside, CA | 14.3% | 672 | $56,710 | $417,337 |
| 46 | Myrtle Beach, SC | 13.3% | 671 | $35,375 | $248,020 |
| 47 | Los Angeles, CA | 13.1% | 686 | $106,785 | $558,700 |
| 48 | Las Vegas, NV | 12.8% | 672 | $48,042 | $341,781 |
| 48 | San Francisco, CA | 12.8% | 699 | $140,005 | $621,577 |
| 50 | Miami, FL | 12.4% | 677 | $64,393 | $364,235 |
Gen Z mortgage requests have risen 9.9%
While Gen Z homebuying activity varies widely by metro, the generation is generally gaining momentum in the housing market. The overall share of Gen Z mortgage requests increased by 9.9% from 2024 to 2025, from 18.1% to 19.9%.
Virginia Beach, Va. (37.1%), saw the largest increase in the share of mortgage requests by Gen Z buyers, followed by San Francisco (33.9%) and Birmingham (30.9%).
Some high-cost coastal metros are still seeing faster growth in Gen Z homebuying despite lower overall shares. In San Francisco, for example, the share of Gen Z buyers rose from 9.5% to 12.8% — a 3.2 percentage point increase. New York saw a similar trend, with its share climbing 2.5 points to 15.6%.
Schulz believes some of that growth reflects who is in the housing market.
“Many older Americans are stuck on the sidelines, unwilling to trade their old, low-rate mortgage for one with today’s higher rates,” he says. “That likely means more first-time buyers in the market, and many of those are Gen Zers.”
Conversely, six metros saw the share of Gen Z mortgage requests decline, led by Miami with a whopping 10.5% decrease. Portland, Ore. (-3.7%), and Orlando, Fla. (-3.1%), distantly followed.
Full rankings: Metros where Gen Z homebuying is growing fastest
| Rank | Metro | Share of mortgage purchase requests, 2024 | Share of mortgage purchase requests, 2025 | % point change | % change |
|---|---|---|---|---|---|
| 1 | Virginia Beach, VA | 15.4% | 21.1% | 5.7 | 37.1% |
| 2 | San Francisco, CA | 9.5% | 12.8% | 3.2 | 33.9% |
| 3 | Birmingham, AL | 19.6% | 25.7% | 6.1 | 30.9% |
| 4 | Myrtle Beach, SC | 10.7% | 13.3% | 2.6 | 24.5% |
| 5 | Jacksonville, FL | 16.1% | 19.7% | 3.6 | 22.3% |
| 6 | Nashville, TN | 19.6% | 24.0% | 4.3 | 22.1% |
| 7 | Richmond, VA | 15.2% | 18.2% | 3.0 | 19.9% |
| 8 | Knoxville, TN | 20.1% | 23.9% | 3.9 | 19.2% |
| 9 | New York, NY | 13.1% | 15.6% | 2.5 | 19.1% |
| 10 | Sacramento, CA | 13.2% | 15.4% | 2.1 | 16.2% |
| 11 | St. Louis, MO | 20.4% | 23.5% | 3.1 | 15.0% |
| 12 | San Diego, CA | 14.5% | 16.6% | 2.1 | 14.7% |
| 13 | Raleigh, NC | 16.9% | 19.3% | 2.5 | 14.6% |
| 14 | Pittsburgh, PA | 20.6% | 23.6% | 3.0 | 14.5% |
| 14 | Philadelphia, PA | 17.4% | 19.9% | 2.5 | 14.5% |
| 16 | Chicago, IL | 17.1% | 19.3% | 2.2 | 12.8% |
| 17 | Denver, CO | 18.4% | 20.5% | 2.1 | 11.6% |
| 18 | Minneapolis, MN | 23.6% | 26.4% | 2.7 | 11.5% |
| 19 | Las Vegas, NV | 11.5% | 12.8% | 1.2 | 10.6% |
| 20 | Kansas City, MO | 22.2% | 24.5% | 2.3 | 10.4% |
| 21 | Dallas, TX | 17.2% | 19.0% | 1.8 | 10.3% |
| 22 | Cleveland, OH | 19.0% | 20.9% | 1.9 | 10.2% |
| 23 | Washington, DC | 14.8% | 16.2% | 1.4 | 9.4% |
| 24 | Baltimore, MD | 16.8% | 18.3% | 1.6 | 9.3% |
| 25 | Indianapolis, IN | 22.6% | 24.6% | 2.0 | 8.7% |
| 25 | Oklahoma City, OK | 20.1% | 21.8% | 1.7 | 8.7% |
| 27 | Charlotte, NC | 19.5% | 21.2% | 1.6 | 8.4% |
| 28 | Seattle, WA | 15.1% | 16.3% | 1.2 | 8.2% |
| 29 | Buffalo, NY | 22.2% | 23.9% | 1.7 | 7.7% |
| 30 | Columbus, OH | 21.9% | 23.4% | 1.5 | 6.8% |
| 31 | Phoenix, AZ | 18.2% | 19.3% | 1.2 | 6.4% |
| 32 | Boston, MA | 17.6% | 18.6% | 1.0 | 5.9% |
| 33 | Louisville, KY | 22.3% | 23.4% | 1.2 | 5.3% |
| 34 | Greenville, SC | 21.9% | 23.1% | 1.1 | 5.2% |
| 35 | Atlanta, GA | 15.6% | 16.4% | 0.8 | 5.1% |
| 36 | Memphis, TN | 16.4% | 17.2% | 0.8 | 4.8% |
| 37 | Detroit, MI | 20.8% | 21.6% | 0.9 | 4.3% |
| 38 | Riverside, CA | 13.7% | 14.3% | 0.6 | 4.2% |
| 39 | Houston, TX | 15.9% | 16.5% | 0.6 | 4.0% |
| 40 | Tampa, FL | 15.6% | 16.0% | 0.4 | 2.7% |
| 41 | Cincinnati, OH | 23.6% | 24.1% | 0.5 | 2.2% |
| 42 | Austin, TX | 17.2% | 17.6% | 0.4 | 2.1% |
| 43 | San Antonio, TX | 17.0% | 17.4% | 0.3 | 2.0% |
| 44 | Milwaukee, WI | 24.2% | 24.5% | 0.2 | 1.0% |
| 45 | Charleston, SC | 22.2% | 22.1% | -0.1 | -0.3% |
| 46 | Lakeland, FL | 15.0% | 14.6% | -0.3 | -2.2% |
| 47 | Los Angeles, CA | 13.5% | 13.1% | -0.4 | -3.0% |
| 48 | Orlando, FL | 15.0% | 14.5% | -0.5 | -3.1% |
| 49 | Portland, OR | 16.2% | 15.6% | -0.6 | -3.7% |
| 50 | Miami, FL | 13.9% | 12.4% | -1.5 | -10.5% |
Millennials still dominate the homebuying market
While Gen Z is starting to show up, millennials (ages 29 to 44 in 2025) continue to dominate the housing market, accounting for 40.5% of mortgage purchase requests in 2025. Gen Xers (ages 45 to 60) rank second at 26.3%, followed by Gen Zers at 19.9% and baby boomers (ages 61 to 79) at 12.7%.
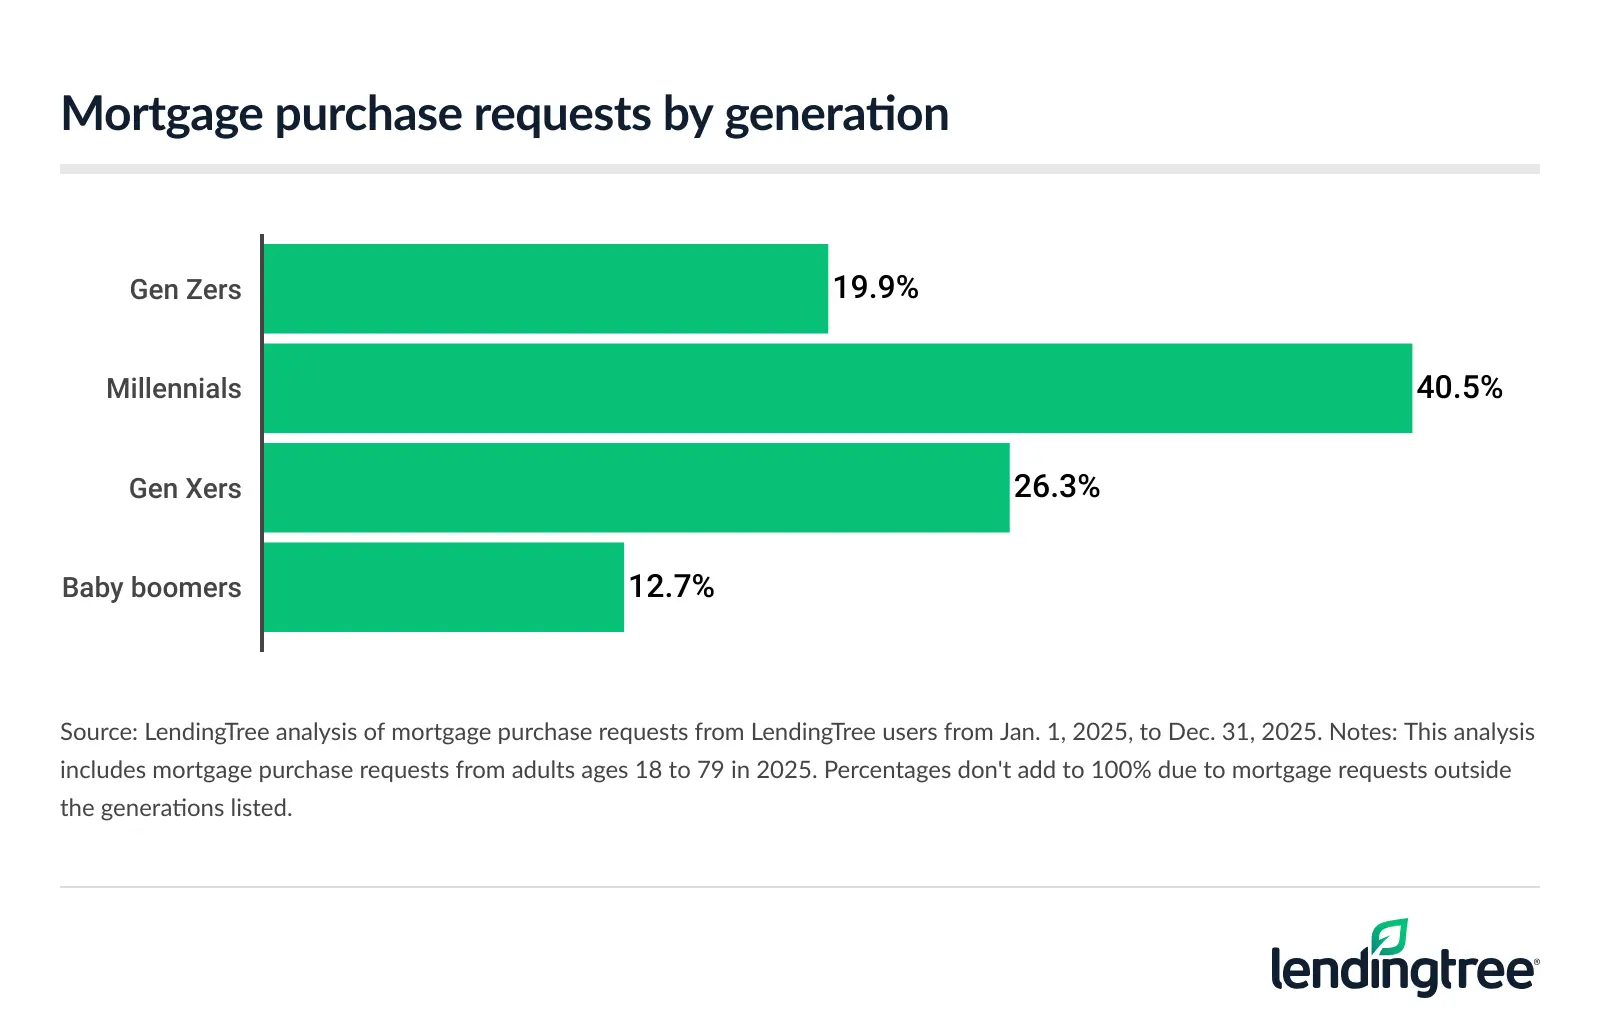
Further, Gen Z buyers are generally entering the market with smaller financial commitments than millennials are making. Their average down payments ($44,966) and loan amounts ($274,794) are notably lower than those of millennials ($72,412 and $356,655, respectively).
Lower down payments and smaller loan amounts mean fewer options for Gen Zers who want to buy, Schulz says.
“That can be frustrating for young people who want to buy a home, but it shouldn’t be surprising that Gen Zers are making smaller down payments and taking out smaller mortgages than millennials,” he says. “Millennials tend to earn more and have higher credit scores, making them far more likely to successfully apply for a mortgage and to get better terms when they do. Gen Zers will certainly catch up as the years pass, but for right now, millennials are far, far better situated for homeownership than Gen Zers are.”
Homebuying as a Gen Zer: Top expert tips
Buying your first home can feel out of reach — especially in today’s market — but preparation and flexibility can go a long way. While Gen Z buyers often face hurdles like lower savings and limited credit history, there are still some steps they can take to improve their chances.
Here’s what we recommend:
- Be flexible. “Your first home doesn’t have to be — and probably shouldn’t be — your dream home,” Schulz says. “If you want to buy a home, understand what matters to you most and focus on that. If location matters most, consider compromising on size and other factors. If having enough square footage is the most important, consider expanding the area that you’d be willing to explore.” Considering the full range of mortgage options, outside of just a traditional 30-year, fixed-rate mortgage, can also be worthwhile. “Other options are out there and can work, but you need to make sure you understand what you’re getting into before you apply.”
- Remember that it’s never too early to start planning to buy a home. “Start saving for your down payment today,” he says. “Focus on improving your credit and paying down other types of debt. Research the various types of mortgage options. There’s an awful lot that goes into the homebuying process, and it can be overwhelming. Taking the time to educate yourself about how it all works can make the process a little less stressful.”
- Look into first-time buyer programs. Many local, state and federal programs offer down payment assistance, grants or favorable loan terms for first-time buyers. Taking advantage of these resources can help make homeownership more attainable sooner than you might expect.
Methodology
Researchers analyzed mortgage purchase requests from LendingTree users across the 50 largest U.S. metros by request volume from Jan. 1, 2024, through Dec. 31, 2025.
Gen Z buyers were defined as adults ages 18 to 28 in 2025. For year-over-year comparisons, the Gen Z age range was held constant within each year (ages 18 to 27 in 2024 and 18 to 28 in 2025) to avoid shifting cohorts.
Researchers calculated the share of mortgage purchase requests from Gen Z buyers overall and by metro, along with average credit scores, down payments and requested loan amounts. Metros were ranked based on the percentage of requests from Gen Z buyers.
Year-over-year changes were calculated by comparing each metro’s Gen Z share in 2024 and 2025, reported as both percentage-point and percentage changes. A separate analysis grouped all requests by generation (Gen Z, millennial, Gen X, baby boomer and other/unknown) to calculate each group’s share and average borrower characteristics.
View mortgage loan offers from up to 5 lenders in minutes