Men Account for Nearly 4 in 5 Fatal Crashes Linked to Unsafe Driving Behaviors
A single instance of risky driving can have deadly consequences. Across the U.S., aggressive driving, inattentiveness, careless operation and other dangerous behaviors contribute to fatal crashes.
Some demographic groups, vehicle models and states are associated with these crashes more frequently than others. For example, LendingTree research found that men accounted for nearly 4 in 5 fatal crashes involving aggressive or careless driving in 2024.
Read on for more on our findings, and tips for reducing risky driving.
For this study, fatal crashes were categorized as involving unsafe driving behaviors if they included at least one of the following driver-related factors:
- Aggressive driving
- Careless driving
- Inattentive operation
- Improper driving
- Driving without due care
- Men account for nearly 4 in 5 fatal crashes involving aggressive or careless driving. In 2024, the latest year for which data is available, male drivers accounted for 78.6% of these fatal crashes, compared with 20.0% for female drivers.
- Millennials account for the largest share of drivers involved in fatal crashes tied to aggressive or careless driving. Millennials made up nearly one-third (31.5%) of the 2024 total, with Gen Z drivers close behind at 27.7%. Together, millennial and Gen Z drivers accounted for 59.2% of these fatal crashes.
- The Chevrolet Silverado is most commonly involved in fatal crashes tied to aggressive or careless driving. Silverado drivers were involved in 3.2% of these fatal crashes in 2024, ahead of Ford F-150 drivers at 3.1% and Toyota Camry drivers at 2.0%.
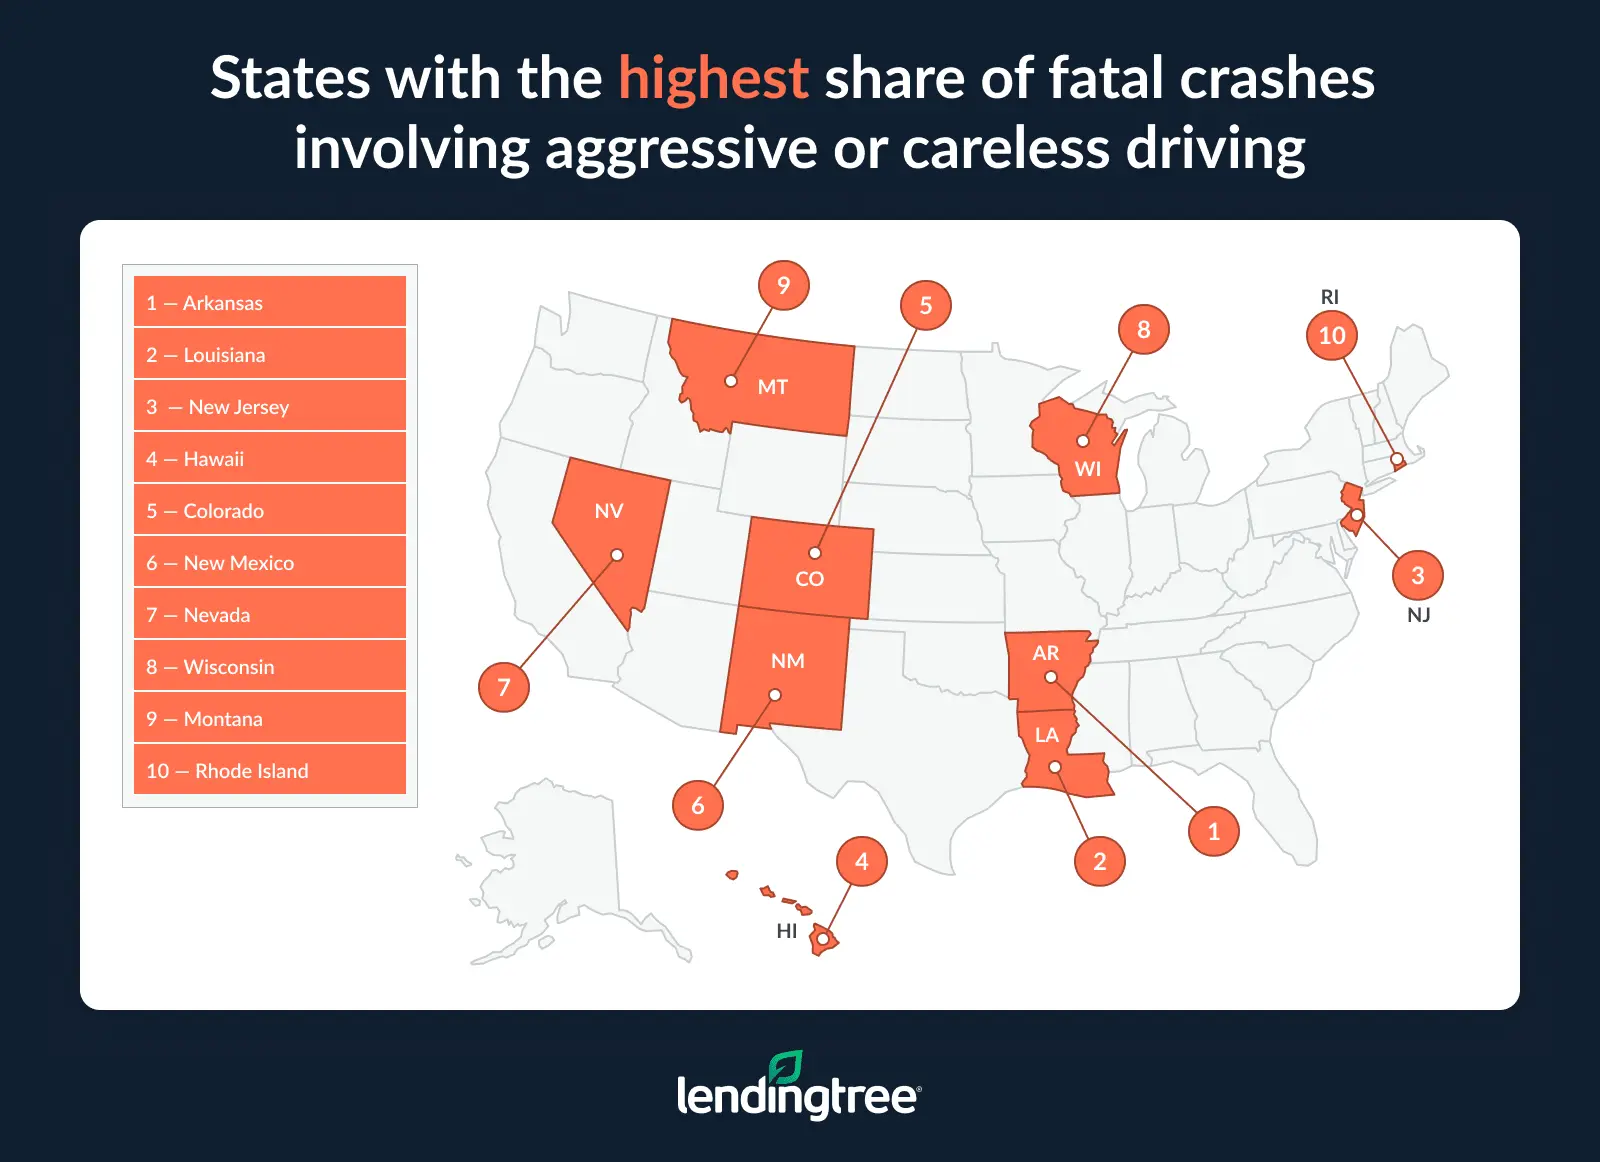
- Arkansas has the highest share of fatal crashes involving aggressive or careless driving. Of Arkansas’ 547 fatal crashes in 2024, 258 involved at least one unsafe driving factor included in this study, representing 47.2% of all fatal crashes in the state. Louisiana ranked second at 46.2%, followed by New Jersey at 45.1%.
Men account for nearly 4 in 5 fatal crashes tied to unsafe driving behaviors
Men are involved in a substantially larger share of fatal crashes linked to aggressive or careless driving behaviors than women. In 2024 — the latest year for which data is available — male drivers accounted for 78.6% of these fatal crashes, versus 20.0% for female drivers.
Fatal crashes involving aggressive or careless driving (by gender)
| Gender | Fatal crashes | % of fatal crashes |
|---|---|---|
| Men | 3,753 | 78.6% |
| Women | 955 | 20.0% |
The disparity is substantial, with men accounting for nearly 4 in 5 fatal crashes involving these behaviors.
Why? Several factors may help explain the gap. According to the Insurance Institute for Highway Safety (IIHS), men drive more miles on average than women and are more likely to engage in risky driving behaviors such as speeding and impaired driving. Research has also found that men, on average, are more likely to engage in risk-taking behavior. Some researchers theorize that this difference may stem from a combination of biological, cultural and evolutionary factors.
Millennial and Gen Z drivers account for most fatal crashes involving aggressive or careless driving
Among generations, millennials (ages 28 to 43 in 2024) were involved in the largest share of fatal crashes linked to aggressive or careless driving, accounting for 31.5% of the total in 2024.
Gen Z drivers (ages 18 to 27) followed at 27.7%. Together, the two generations were involved in nearly 60.0% of fatal crashes associated with aggressive or careless driving.
Fatal crashes involving aggressive or careless driving (by generation)
| Generation | Fatal crashes | % of fatal crashes |
|---|---|---|
| Millennials | 1,506 | 31.5% |
| Gen Zers | 1,323 | 27.7% |
| Gen Xers | 871 | 18.2% |
| Baby boomers | 629 | 13.2% |
| Silent generation | 185 | 3.9% |
According to Lindsay Bishop, LendingTree’s car insurance expert, driver behavior often plays a larger role in fatal crashes than demographic characteristics.
“Millennial and Gen Z drivers often spend more time commuting, driving for work or traveling during rush hour and late-night hours than older generations,” Bishop said. “That can increase their risk of being involved in a fatal crash. Regardless of age or gender, drivers who speed or disregard traffic laws more frequently are more likely to be involved in a fatal collision.”
Older generations accounted for smaller shares of these fatal crashes. Gen X drivers (ages 44 to 59) accounted for 18.2% of the total, while baby boomers (ages 60 to 78) accounted for 13.2%.
Chevrolet Silverado leads vehicle model rankings
Pickup trucks accounted for several of the vehicle models most frequently involved in fatal crashes linked to aggressive or careless driving. Chevy Silverado drivers accounted for 3.2% of these fatal crashes in 2024, while Ford F-150 drivers accounted for 3.1%.
One likely explanation is their prevalence on U.S. roads. According to Car and Driver, the Ford F-Series was the bestselling vehicle in the U.S. in 2025, and the Chevy Silverado was the second bestselling. Pickup trucks accounted for five of the 10 bestselling vehicles in 2025.
Research also suggests that the increasing size and weight of pickup trucks may contribute to crash severity. Consumer Reports notes that larger, heavier pickups may contribute to the deadliness of crashes.
Fatal crashes involving aggressive or careless driving (by vehicle model)
| Rank | Vehicle model | Fatal crashes | % of fatal crashes |
|---|---|---|---|
| 1 | Chevrolet Silverado | 153 | 3.2% |
| 2 | Ford F-150 | 146 | 3.1% |
| 3 | Toyota Camry | 94 | 2.0% |
| 4 | Honda Accord | 92 | 1.9% |
| 5 | GMC Sierra | 74 | 1.5% |
| 5 | Dodge Ram | 70 | 1.5% |
| 7 | Honda Civic | 67 | 1.4% |
| 8 | Toyota Corolla | 64 | 1.3% |
| 9 | Nissan Altima | 57 | 1.2% |
| 10 | Ram 1500 | 53 | 1.1% |
| 11 | Dodge Charger | 50 | 1.0% |
| 11 | Jeep Grand Cherokee | 49 | 1.0% |
| 11 | Freightliner Cascadia | 48 | 1.0% |
| 14 | Ford Escape | 44 | 0.9% |
| 14 | Ford F-250 | 44 | 0.9% |
| 14 | Ford Mustang | 44 | 0.9% |
| 14 | Chevrolet Tahoe | 43 | 0.9% |
| 14 | Chevrolet Equinox | 42 | 0.9% |
| 19 | Chevrolet Malibu | 38 | 0.8% |
| 19 | Nissan Rogue | 38 | 0.8% |
| 19 | Ford Explorer | 36 | 0.8% |
| 19 | Honda CR-V | 36 | 0.8% |
| 19 | Jeep Wrangler | 36 | 0.8% |
| 24 | Hyundai Sonata | 35 | 0.7% |
| 24 | Ford Fusion | 33 | 0.7% |
Among sedans, Toyota Camry drivers accounted for 2.0% of these fatal crashes, while Honda Accord drivers accounted for 1.9%.
Their ranking may be partly explained by their popularity. The Toyota Camry was the eighth bestselling vehicle in 2025, though the Honda Accord didn’t make the top 25.
A similar pattern appears at the brand level. Chevrolet drivers were involved in 11.6% of fatal crashes involving aggressive or careless driving, with Ford drivers at 11.3%, Toyota drivers at 8.1% and Honda drivers at 7.8%. According to Car Sales Statistics, these four makes were also the top four bestselling car brands in 2025.
Fatal crashes involving aggressive or careless driving (by vehicle make)
| Rank | Vehicle make | Fatal crashes | % of fatal crashes |
|---|---|---|---|
| 1 | Chevrolet | 555 | 11.6% |
| 2 | Ford | 542 | 11.3% |
| 3 | Toyota | 385 | 8.1% |
| 4 | Honda | 372 | 7.8% |
| 5 | Nissan | 246 | 5.1% |
| 6 | Dodge | 233 | 4.9% |
| 7 | Harley-Davidson | 206 | 4.3% |
| 8 | GMC | 174 | 3.6% |
| 9 | Jeep | 138 | 2.9% |
| 10 | Hyundai | 133 | 2.8% |
Arkansas has the highest share of fatal crashes involving unsafe driving behaviors
The share of fatal crashes involving unsafe driving behaviors varied widely by state in 2024, with Arkansas recording the highest rate. Of the state’s 547 fatal crashes that year, 258 (47.2%) involved at least one driver-related factor. Louisiana followed with 46.2%, and New Jersey with 45.1%. Each was well above the national average of 12.9%.
There’s no single explanation for the higher rates in these states. Factors such as roadway design, traffic patterns, enforcement practices and driver behavior may all contribute.
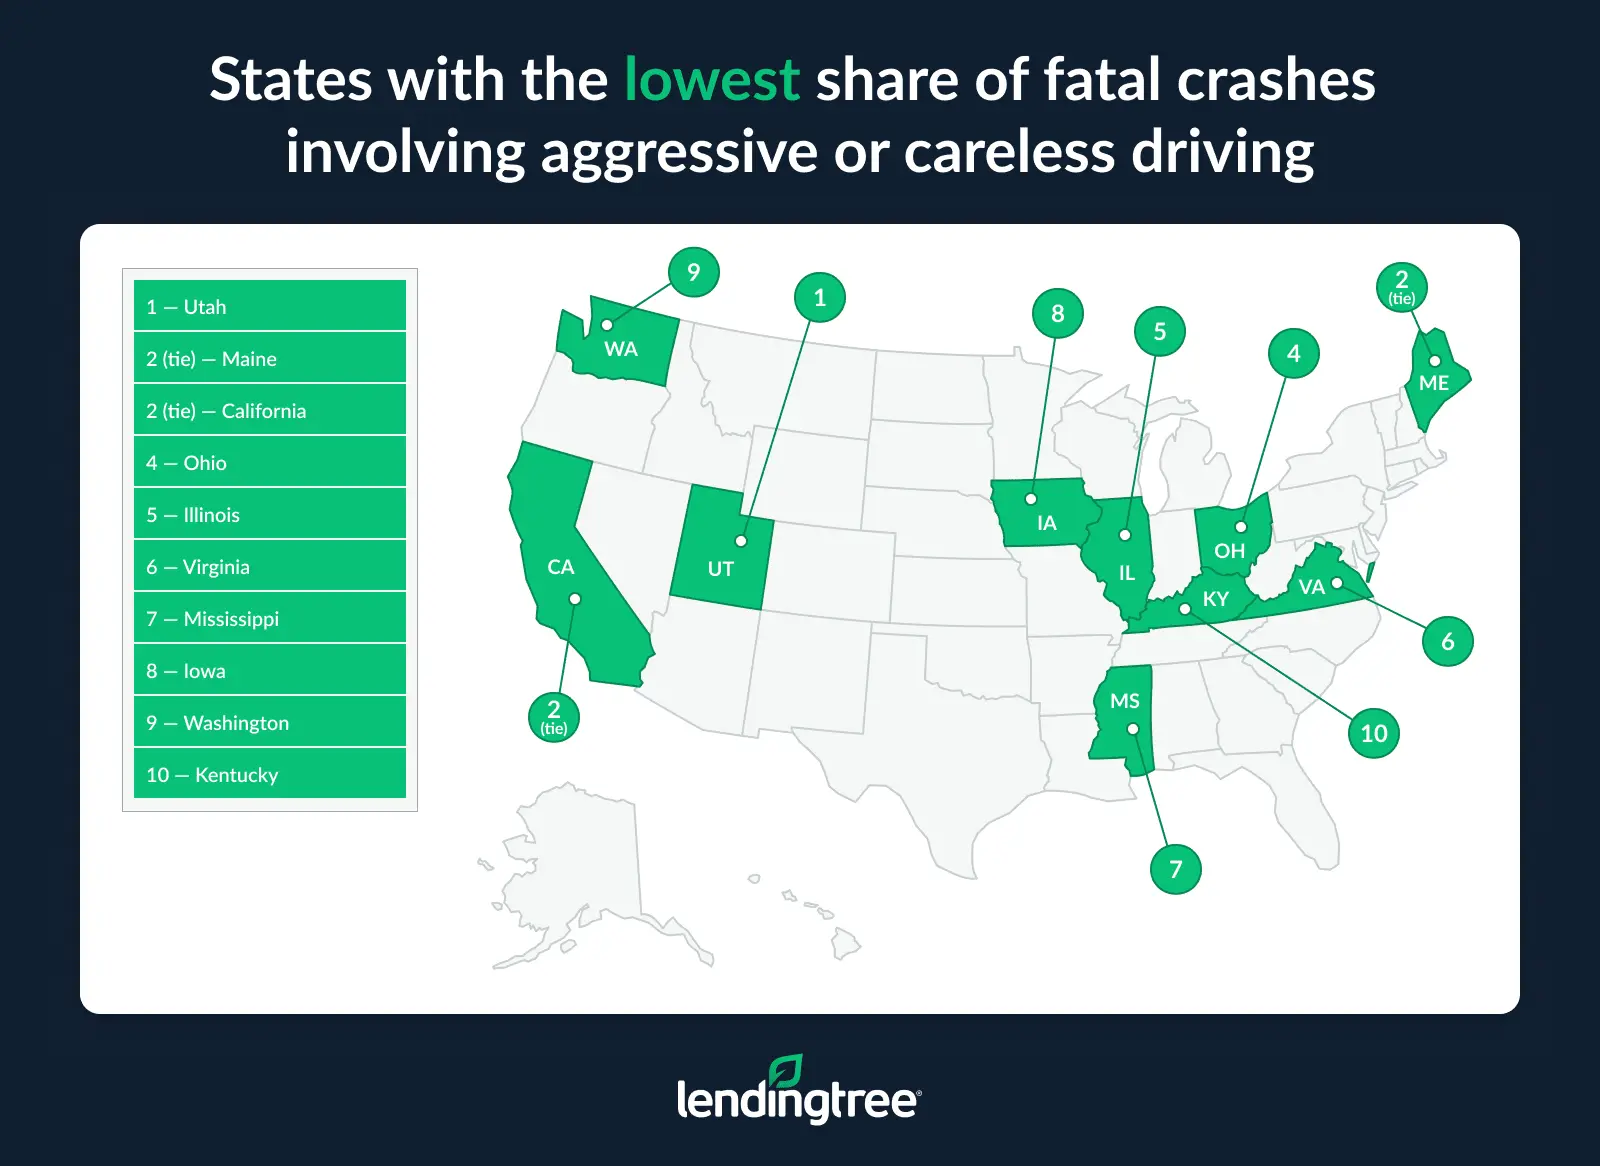
At the other end of the spectrum, Utah reported no fatal crashes involving these unsafe driving behaviors among its 251 fatal crashes in 2024. Maine and California followed, with each reporting rates of 0.6%.
States with the highest/lowest shares of fatal crashes involving aggressive or careless driving
| Rank | State | Fatal crashes | Fatal crashes involving aggressive or careless driving | % of fatal crashes |
|---|---|---|---|---|
| 1 | Arkansas | 547 | 258 | 47.2% |
| 2 | Louisiana | 705 | 326 | 46.2% |
| 3 | New Jersey | 638 | 288 | 45.1% |
| 4 | Hawaii | 97 | 42 | 43.3% |
| 5 | Colorado | 642 | 255 | 39.7% |
| 6 | New Mexico | 378 | 141 | 37.3% |
| 7 | Nevada | 378 | 121 | 32.0% |
| 8 | Wisconsin | 529 | 169 | 31.9% |
| 9 | Montana | 193 | 58 | 30.1% |
| 10 | Rhode Island | 48 | 12 | 25.0% |
| 11 | North Carolina | 1,509 | 364 | 24.1% |
| 12 | Florida | 2,931 | 667 | 22.8% |
| 13 | Maryland | 552 | 118 | 21.4% |
| 14 | Wyoming | 102 | 20 | 19.6% |
| 15 | Pennsylvania | 1,060 | 192 | 18.1% |
| 16 | Connecticut | 285 | 51 | 17.9% |
| 17 | District of Columbia | 46 | 8 | 17.4% |
| 17 | Idaho | 219 | 38 | 17.4% |
| 19 | Minnesota | 431 | 70 | 16.2% |
| 20 | Nebraska | 223 | 35 | 15.7% |
| 21 | North Dakota | 84 | 12 | 14.3% |
| 22 | Kansas | 314 | 40 | 12.7% |
| 23 | New York | 1,036 | 130 | 12.5% |
| 23 | Indiana | 785 | 98 | 12.5% |
| 25 | Tennessee | 1,093 | 134 | 12.3% |
| 26 | Massachusetts | 349 | 39 | 11.2% |
| 27 | Alabama | 895 | 92 | 10.3% |
| 28 | Texas | 3,774 | 376 | 10.0% |
| 29 | Vermont | 53 | 5 | 9.4% |
| 30 | Georgia | 1,312 | 108 | 8.2% |
| 31 | Oregon | 491 | 39 | 7.9% |
| 31 | Alaska | 63 | 5 | 7.9% |
| 33 | Missouri | 882 | 66 | 7.5% |
| 34 | West Virginia | 238 | 16 | 6.7% |
| 35 | South Carolina | 948 | 60 | 6.3% |
| 36 | Delaware | 121 | 7 | 5.8% |
| 37 | Michigan | 1,011 | 56 | 5.5% |
| 38 | New Hampshire | 120 | 5 | 4.2% |
| 39 | Oklahoma | 594 | 23 | 3.9% |
| 40 | South Dakota | 134 | 5 | 3.7% |
| 41 | Arizona | 1,118 | 35 | 3.1% |
| 42 | Kentucky | 663 | 16 | 2.4% |
| 43 | Washington | 674 | 14 | 2.1% |
| 44 | Iowa | 324 | 6 | 1.9% |
| 45 | Mississippi | 678 | 11 | 1.6% |
| 46 | Virginia | 867 | 12 | 1.4% |
| 47 | Illinois | 1,085 | 14 | 1.3% |
| 48 | Ohio | 1,077 | 9 | 0.8% |
| 49 | California | 3,583 | 22 | 0.6% |
| 49 | Maine | 167 | 1 | 0.6% |
| 51 | Utah | 251 | 0 | 0.0% |
6 ways drivers can reduce unsafe driving behaviors
While not every crash can be prevented, drivers can take steps to reduce risk behind the wheel. One of the most important is avoiding driving under the influence of alcohol or drugs.
Alcohol and drug impairment are common factors in fatal crashes. Our analysis found alcohol was a factor in 29.9% of fatal aggressive/careless driving crashes in 2024, while drugs were involved in 25.6%.
Here are six additional ways to reduce unsafe driving behaviors:
- Avoid distractions and keep phones out of reach. Even a brief glance at a text message can have serious consequences. According to the National Highway Traffic Safety Administration (NHTSA), 315,167 people were injured in crashes involving distracted driving in 2024. The NHTSA says sending or reading a text message takes a driver’s eyes off the road for about five seconds — enough time to travel the length of a football field at 55 mph. Phones aren’t the only distraction. Adjusting music, eating, drinking or interacting with your navigation system can also divert your attention. Avoid activities that take your eyes, hands or attention away from driving.
- Leave extra travel time and avoid speeding. Slow down. Speeding remains one of the leading contributors to traffic deaths. According to the National Safety Council, 29% of all traffic fatalities in 2024 were related to speed. That equates to 11,288 deaths, or more than 31 fatalities per day on average. Give yourself extra time to reach your destination so you don’t feel pressured to speed or make risky decisions. Allowing extra time can help reduce stress and encourage safer driving decisions.
- Maintain a safe following distance. Tailgating reduces your time to react if traffic slows or stops. Safety experts suggest following the three-second rule to determine the minimum safe following distance. Choose a fixed point ahead such as a mile marker or sign. When the vehicle in front of you passes it, you should be able to count three full seconds before your vehicle reaches that same point. Increase that distance in poor weather, heavy traffic or when following large vehicles.
- Avoid escalating conflicts with other drivers. If someone is tailgating you, speeding or otherwise being aggressive on the road, don’t respond in kind. Give them plenty of space, allow them to pass and avoid gestures that could escalate the situation. Contact law enforcement if you believe your safety is at risk.
- Stay alert and take breaks during long trips. Fatigue can impair decision-making and awareness behind the wheel. In 2024, 644 people died in crashes related to drowsy driving, and those are only the ones reported as such. Get adequate sleep before driving and schedule regular breaks on longer trips. If you start to feel drowsy while driving, pull over in a safe location. The NHTSA suggests consuming caffeine and taking a 20-minute nap before continuing your drive.
- Use driver-assistance features when available, but remain attentive. Driver-assistance technologies can help reduce risk, but they aren’t a substitute for an attentive driver. The NHTSA says they have the potential to save thousands of lives each year. Examples include forward-collision warnings, blind-spot monitoring, lane-departure alerts and automatic emergency braking. Make sure you understand the safety systems in your vehicle and how they work. Drivers should remain engaged and ready to take control of the vehicle at all times.
Methodology
LendingTree researchers analyzed and combined data from multiple National Highway Traffic Safety Administration (NHTSA) Fatality Analysis Reporting System (FARS) datasets to identify fatal crashes involving aggressive or careless driving by state and across several demographic categories.
For 2024, researchers calculated the share of fatal crashes in each state that involved one or more of the following contributing factors: aggressive driving, careless driving, inattentive operation, improper driving or driving without due care. States were then ranked based on the percentage of fatal crashes involving at least one of these factors.
At the national level, researchers analyzed fatal crashes involving aggressive or careless driving across the following categories in 2024:
- Gender
- Generation
- Vehicle model
- Vehicle make
- Alcohol/drug involvement
Generational categories were defined using Pew Research Center age ranges:
- Gen Zers: 18 to 27
- Millennials: 28 to 43
- Gen Xers: 44 to 59
- Baby boomers: 60 to 78
- Silent generation: 79 to 96