More Than 1 in 3 US Borrowers Have Auto Loan Terms Over 6 Years — Costing Nearly $6K More in Interest
As of the fourth quarter of 2025, the average used car costs almost $26,000. It’s no wonder, then, that buying a car often means taking out a loan, which involves balancing monthly payments against interest over time. For many Americans, the scales are tipping toward longer loan terms in an effort to keep those monthly payments more manageable.
Today, more than a third of U.S. borrowers with active auto loans are financing their vehicles for longer than six years — which can significantly increase the amount of interest they pay over the life of the loan. This LendingTree study explores auto loan terms by state, monthly payment totals and more.
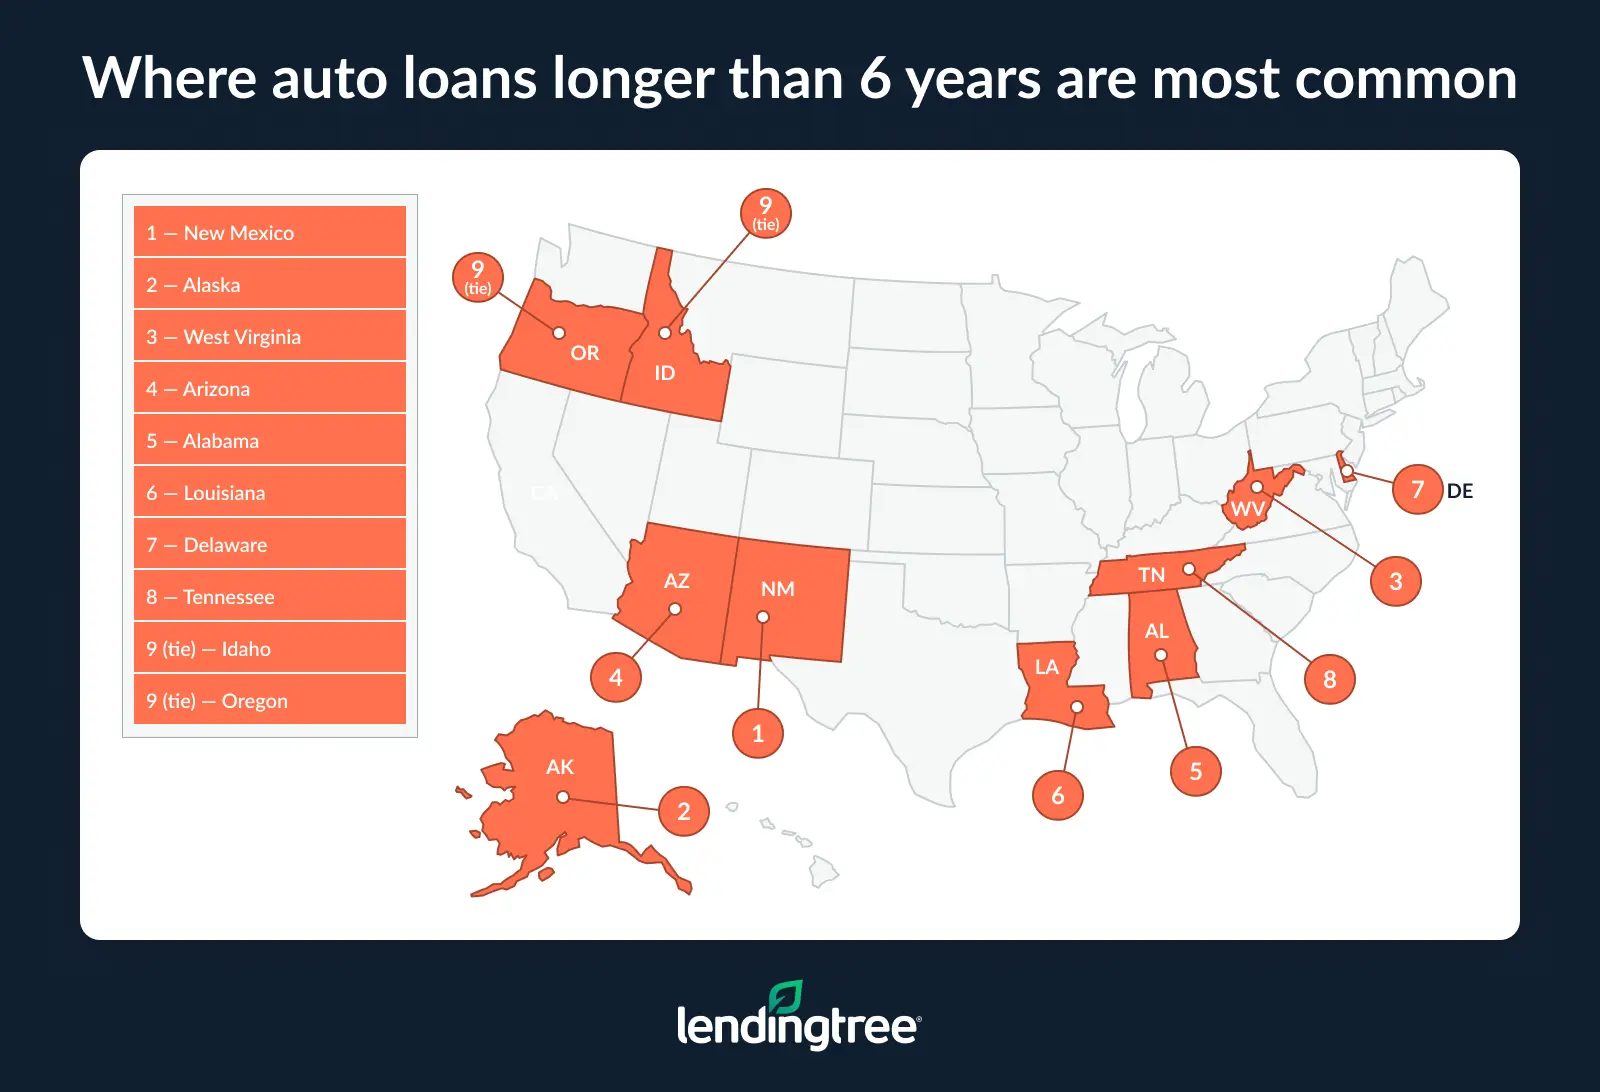
- More than 1 in 3 U.S. borrowers with active auto loans finance their vehicles for terms longer than six years. Nationwide, 34.9% of borrowers have loan terms of longer than six years. The share climbs to 45.8% in New Mexico, 44.9% in Alaska and 43.7% in West Virginia.
- Borrowers with auto loans longer than six years pay significantly more in estimated total interest over the life of the loan. Nationwide, those with longer loans pay an estimated $13,272 in total interest, compared with $7,298 for borrowers with loans lasting six years or less. That’s a difference of $5,974, or 81.9% more.
- In some states, the estimated interest gap associated with longer loan terms is even larger. Alaska shows the largest dollar difference, at $8,625 more in estimated interest for loans longer than six years. Wyoming ($7,359) and Vermont ($7,084) follow.
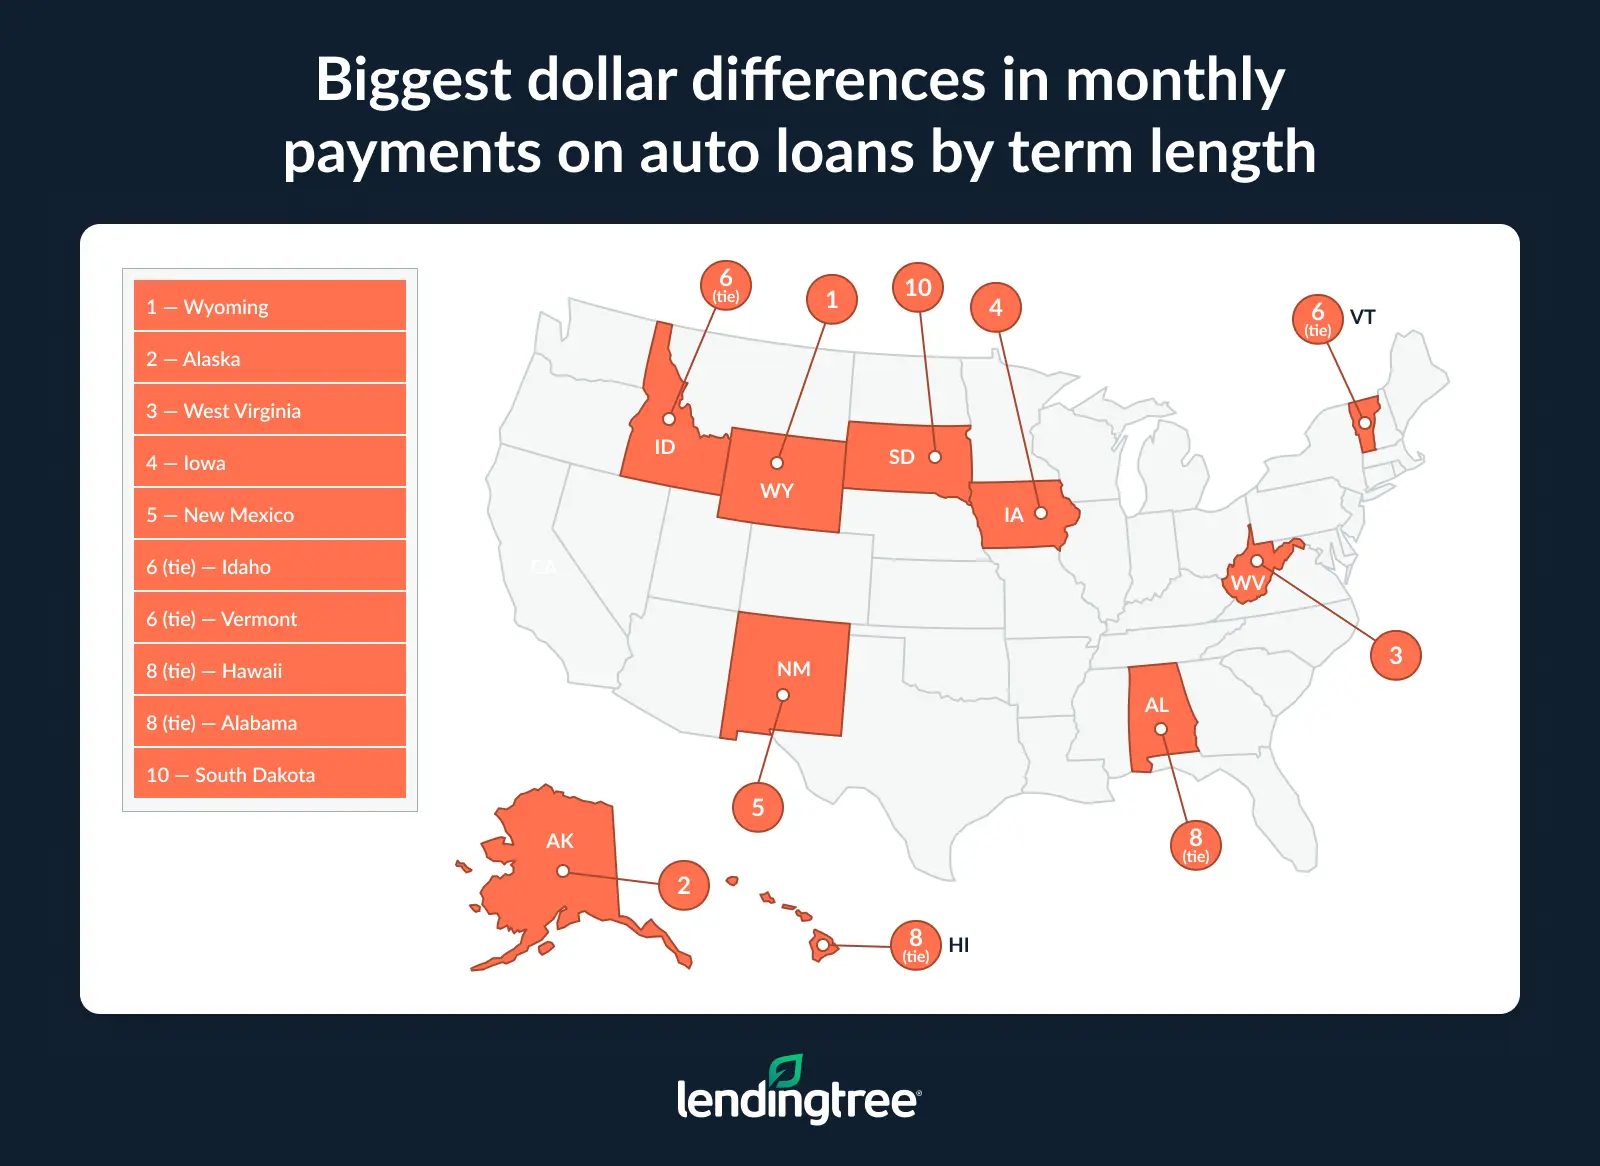
- Borrowers with longer auto loan terms also tend to carry higher monthly payments and larger financed amounts. Nationwide, borrowers with loans longer than six years pay an average of $652 per month, versus $581 for those with shorter loans, and they finance $38,691 on average, compared with $29,941.
34.9% of borrowers have loan terms longer than 6 years
Across the U.S., more than a third of borrowers with active auto loans — 34.9% — have loan terms longer than six years.
The reason, says Matt Schulz, LendingTree chief consumer finance analyst and author of “Ask Questions, Save Money, Make More: How to Take Control of Your Financial Life,” is quite simple: “Vehicles continue to get more and more expensive.” Combine the high price tag with high interest rates, and “many people need to drag out the payoff period to get the monthly payments low enough to be manageable,” Schulz says.
The trend is, however, “troubling,” he admits, “especially since vehicles tend to depreciate so rapidly.”
“Extending the loan out to six or seven years means that a lot of people are likely underwater on their vehicles, and that’s not a situation anyone wants to be in,” Schulz says.
While long loans are common nationwide, some states fare worse than others in this regard. In New Mexico, the state that leads the charge, nearly half of borrowers with active auto loans — 45.8% — have auto loan terms longer than six years. Alaska comes in second at 44.9% of borrowers, followed by West Virginia at 43.7%.
Longer loan terms in certain states, says Schulz, may have something to do with the credit of those borrowing there. “Low credit scores mean higher interest rates, which mean higher costs, which require more time to pay off.” (According to Experian, the average credit score in New Mexico was 702 in late 2024, which puts it in the “good” category but lower than the national average at the time of 715.)
Income can also play a role since longer loan terms tend to mean lower monthly payments (or are at least thought to — more on that later). The median household income in New Mexico is just $64,059, compared with a national median income of $80,734. The same holds true in West Virginia, where the median household income is $59,608. In Alaska, while the median household income is higher than the national median, it’s also true that the state has a higher overall cost of living than many others.
Meanwhile, at the other end of the spectrum, Minnesota, Massachusetts and Connecticut have the lowest proportions of borrowers with loans longer than six years: 25.3%, 26.8% and 27.0%, respectively.
Loans longer than 7 years are less common
While loans longer than six years are quite common, loans that extend beyond seven years are far less so. Nationwide, just 2.8% of active borrowers have loans with terms this long — though again, in certain states, the percentage is much higher, including in Alaska (9.6%), Oregon (6.1%) and Tennessee (5.8%).
These states, with their rugged countrysides, lend credence to another of Schulz’s hypotheses about what’s driving up loan term lengths: “Americans’ love for big vehicles.” Pickup trucks and full-size SUVs are even more expensive than already expensive cars, which may be one reason states like these see more borrowers with longer-than-average auto loan terms.
Full rankings: Where auto loans longer than 6 years are most common
| Rank | State | % of borrowers with auto loan longer than 6 years |
|---|---|---|
| 1 | New Mexico | 45.8% |
| 2 | Alaska | 44.9% |
| 3 | West Virginia | 43.7% |
| 4 | Arizona | 41.9% |
| 5 | Alabama | 41.4% |
| 6 | Louisiana | 41.0% |
| 7 | Delaware | 40.1% |
| 8 | Tennessee | 39.9% |
| 9 | Idaho | 39.8% |
| 9 | Oregon | 39.8% |
| 11 | Florida | 39.1% |
| 12 | South Carolina | 37.8% |
| 13 | Nevada | 37.3% |
| 14 | Georgia | 37.0% |
| 15 | Arkansas | 36.9% |
| 16 | Washington | 36.8% |
| 16 | Ohio | 36.8% |
| 18 | North Carolina | 36.7% |
| 19 | Oklahoma | 36.5% |
| 20 | Texas | 36.4% |
| 21 | Maryland | 36.2% |
| 22 | Mississippi | 36.1% |
| 23 | Wyoming | 35.8% |
| 24 | Virginia | 35.2% |
| 25 | Kentucky | 35.1% |
| 26 | Indiana | 34.9% |
| 27 | Pennsylvania | 34.6% |
| 27 | Iowa | 34.6% |
| 29 | Utah | 34.2% |
| 30 | Colorado | 33.8% |
| 30 | Maine | 33.8% |
| 32 | Hawaii | 33.1% |
| 33 | Michigan | 33.0% |
| 34 | Nebraska | 32.4% |
| 34 | New Hampshire | 32.4% |
| 36 | Rhode Island | 32.3% |
| 37 | Missouri | 31.6% |
| 38 | Illinois | 31.3% |
| 39 | New York | 31.1% |
| 40 | Montana | 31.0% |
| 41 | Kansas | 30.3% |
| 41 | Vermont | 30.3% |
| 43 | Wisconsin | 29.1% |
| 44 | California | 29.0% |
| 45 | New Jersey | 28.9% |
| 46 | District of Columbia | 28.7% |
| 47 | South Dakota | 28.5% |
| 48 | North Dakota | 28.2% |
| 49 | Connecticut | 27.0% |
| 50 | Massachusetts | 26.8% |
| 51 | Minnesota | 25.3% |
Full rankings: Where auto loans longer than 7 years are most common
| Rank | State | % of borrowers with auto loan longer than 7 years |
|---|---|---|
| 1 | Alaska | 9.6% |
| 2 | Oregon | 6.1% |
| 3 | Tennessee | 5.8% |
| 4 | Idaho | 5.5% |
| 5 | Washington | 5.2% |
| 6 | Arizona | 4.4% |
| 7 | New Mexico | 4.3% |
| 8 | Kentucky | 4.0% |
| 9 | Maryland | 3.9% |
| 9 | Wyoming | 3.9% |
| 9 | Iowa | 3.9% |
| 12 | North Carolina | 3.7% |
| 13 | West Virginia | 3.3% |
| 13 | Ohio | 3.3% |
| 15 | Delaware | 3.1% |
| 15 | Mississippi | 3.1% |
| 17 | Hawaii | 3.0% |
| 17 | Vermont | 3.0% |
| 19 | Georgia | 2.9% |
| 20 | Oklahoma | 2.8% |
| 20 | Virginia | 2.8% |
| 20 | Indiana | 2.8% |
| 20 | Utah | 2.8% |
| 20 | Colorado | 2.8% |
| 25 | Alabama | 2.6% |
| 25 | Louisiana | 2.6% |
| 25 | South Carolina | 2.6% |
| 25 | Texas | 2.6% |
| 25 | Michigan | 2.6% |
| 30 | Florida | 2.5% |
| 30 | Nebraska | 2.5% |
| 32 | Pennsylvania | 2.4% |
| 32 | New York | 2.4% |
| 32 | New Jersey | 2.4% |
| 35 | District of Columbia | 2.2% |
| 36 | Nevada | 2.1% |
| 36 | Arkansas | 2.1% |
| 36 | Illinois | 2.1% |
| 39 | Rhode Island | 2.0% |
| 39 | California | 2.0% |
| 41 | Montana | 1.9% |
| 42 | Missouri | 1.8% |
| 42 | Kansas | 1.8% |
| 42 | South Dakota | 1.8% |
| 45 | North Dakota | 1.7% |
| 46 | New Hampshire | 1.6% |
| 47 | Maine | 1.4% |
| 47 | Wisconsin | 1.4% |
| 47 | Minnesota | 1.4% |
| 50 | Connecticut | 1.1% |
| 50 | Massachusetts | 1.1% |
Estimated interest climbs with longer auto loans
A longer loan term does more than just keep another bill on a borrower’s monthly plate for additional time. It can also significantly ramp up the total interest they’ll pay over the lifetime of the loan. In fact, nationwide, those with longer loans pay an estimated $13,272 in total interest, compared with just $7,298 for borrowers whose loans are six years or less in length. That’s an increase of a whopping 81.9%, or $5,974.
That’s a lot of money — and it can have a major effect on borrowers’ financial health.
“All that extra interest is a big deal,” explains Schulz, “because it’s money that can’t be put toward other goals, like building an emergency fund, investing for retirement or paying down high-interest debt. It just adds to the already heavy financial burden that many, many Americans are dealing with today.”
Again, these figures vary on a state-by-state basis, with certain states — Alaska chief among them — seeing a higher interest gap than others.
In Alaska, auto loan borrowers with terms greater than six years in length can expect to pay an average of $15,159 in interest over the course of the loan, compared with just $6,534 for those whose loans last six years or less. That’s a difference of 132.0%, or $8,625. (In fact, the interest gap itself is larger than the total interest a shorter-term borrower would pay.)
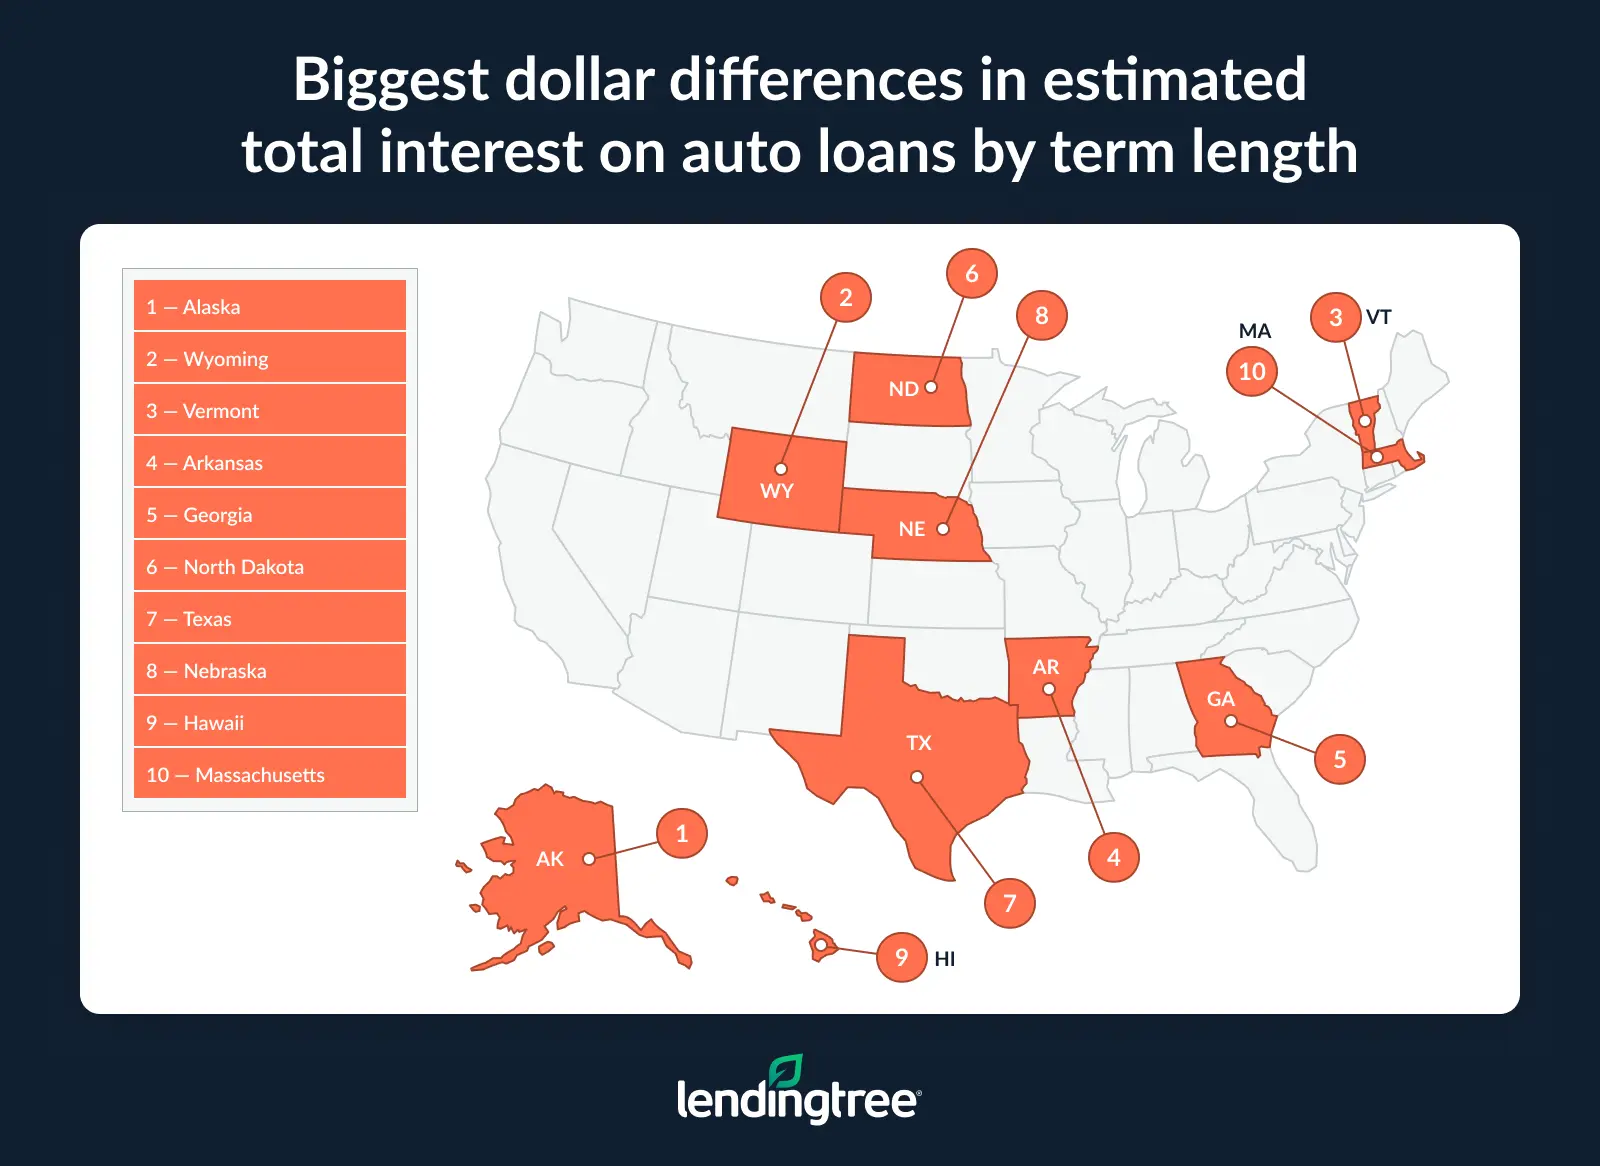
Full rankings: States where borrowers with auto loans longer than 6 years pay the biggest difference in estimated total interest
| Rank | State | Avg. estimated total interest, 6 years or less | Avg. estimated total interest, longer than 6 years | % difference | $ difference |
|---|---|---|---|---|---|
| 1 | Alaska | $6,534 | $15,159 | 132.0% | $8,625 |
| 2 | Wyoming | $6,950 | $14,309 | 105.9% | $7,359 |
| 3 | Vermont | $5,590 | $12,674 | 126.7% | $7,084 |
| 4 | Arkansas | $7,503 | $14,303 | 90.6% | $6,800 |
| 5 | Georgia | $9,211 | $16,004 | 73.7% | $6,793 |
| 6 | North Dakota | $6,854 | $13,591 | 98.3% | $6,737 |
| 7 | Texas | $8,912 | $15,553 | 74.5% | $6,641 |
| 8 | Nebraska | $6,146 | $12,735 | 107.2% | $6,589 |
| 9 | Hawaii | $7,402 | $13,904 | 87.8% | $6,502 |
| 10 | Massachusetts | $6,220 | $12,694 | 104.1% | $6,474 |
| 11 | Iowa | $6,337 | $12,737 | 101.0% | $6,400 |
| 12 | Mississippi | $9,211 | $15,608 | 69.4% | $6,397 |
| 13 | Maryland | $7,643 | $14,014 | 83.4% | $6,371 |
| 14 | Idaho | $5,973 | $12,315 | 106.2% | $6,342 |
| 15 | South Dakota | $6,088 | $12,407 | 103.8% | $6,319 |
| 16 | New Mexico | $8,570 | $14,881 | 73.6% | $6,311 |
| 17 | Alabama | $8,631 | $14,868 | 72.3% | $6,237 |
| 18 | Minnesota | $5,789 | $11,980 | 106.9% | $6,191 |
| 19 | Montana | $6,513 | $12,703 | 95.0% | $6,190 |
| 20 | South Carolina | $8,139 | $14,311 | 75.8% | $6,172 |
| 21 | Virginia | $7,106 | $13,185 | 85.5% | $6,079 |
| 22 | New Hampshire | $5,962 | $12,032 | 101.8% | $6,070 |
| 23 | Oklahoma | $7,525 | $13,590 | 80.6% | $6,065 |
| 24 | North Carolina | $7,713 | $13,748 | 78.2% | $6,035 |
| 25 | Kansas | $6,639 | $12,612 | 90.0% | $5,973 |
| 26 | Missouri | $7,305 | $13,276 | 81.7% | $5,971 |
| 27 | New York | $7,577 | $13,485 | 78.0% | $5,908 |
| 28 | Washington | $6,413 | $12,319 | 92.1% | $5,906 |
| 29 | California | $7,686 | $13,531 | 76.0% | $5,845 |
| 30 | Illinois | $7,370 | $13,193 | 79.0% | $5,823 |
| 31 | Pennsylvania | $6,616 | $12,418 | 87.7% | $5,802 |
| 32 | Utah | $6,128 | $11,926 | 94.6% | $5,798 |
| 33 | Wisconsin | $6,363 | $12,073 | 89.7% | $5,710 |
| 34 | Colorado | $7,470 | $13,145 | 76.0% | $5,675 |
| 35 | District of Columbia | $8,118 | $13,726 | 69.1% | $5,608 |
| 36 | Maine | $5,998 | $11,561 | 92.7% | $5,563 |
| 37 | Arizona | $7,939 | $13,492 | 69.9% | $5,553 |
| 38 | Michigan | $7,063 | $12,548 | 77.7% | $5,485 |
| 39 | Kentucky | $7,741 | $13,187 | 70.4% | $5,446 |
| 40 | Nevada | $8,819 | $14,189 | 60.9% | $5,370 |
| 41 | Connecticut | $6,767 | $12,133 | 79.3% | $5,366 |
| 42 | Louisiana | $8,946 | $14,288 | 59.7% | $5,342 |
| 43 | Ohio | $7,532 | $12,740 | 69.1% | $5,208 |
| 44 | Florida | $8,584 | $13,768 | 60.4% | $5,184 |
| 45 | New Jersey | $7,976 | $13,159 | 65.0% | $5,183 |
| 46 | Delaware | $7,943 | $13,058 | 64.4% | $5,115 |
| 47 | West Virginia | $8,044 | $13,158 | 63.6% | $5,114 |
| 48 | Tennessee | $8,371 | $13,437 | 60.5% | $5,066 |
| 49 | Oregon | $5,954 | $10,965 | 84.2% | $5,011 |
| 50 | Rhode Island | $6,740 | $11,660 | 73.0% | $4,920 |
| 51 | Indiana | $7,600 | $12,509 | 64.6% | $4,909 |
Longer auto terms correlate with higher monthly payments
One of the primary reasons many borrowers may think they want a longer auto loan term is to keep monthly payments low and affordable. But the data shows that longer terms often correlate with higher monthly payments.
Nationwide, the average monthly payment on an auto loan with a term longer than six years is $652, compared with $581 per month on a comparable loan of six years or less. That’s a difference of $71 per month, or 12.2%.
Why? “Longer terms often correlate with higher payments primarily because of the large amounts borrowed,” Schulz says. “If a vehicle is expensive enough, you can still have sky-high payments on it, even if you stretch the loan term out an extra year or two.”
(By the way, if these figures sound high, don’t forget: Some people are paying $1,000 or more per month toward their auto loan.)
Again, the states that see this trend play out to the greatest extent are largely Western and Midwestern states where larger (and more expensive) vehicles like pickup trucks may be more popular. This includes Wyoming (where the average monthly payment on a loan longer than six years is $733, compared with $606 for shorter-term loans), Alaska ($728 and $604, respectively) and West Virginia ($661 and $551, respectively).
All three of those leading states also figure in the top-10 list of states where longer-term loans finance higher amounts than shorter-term loans. In this regard, Alaska leads yet again, with the average financed amount of loans longer than six years sitting at $45,677, compared with $31,902 on shorter-term loans. Wyoming comes in second, with average financed amounts of $44,886 and $31,661, respectively, and West Virginia comes up sixth on the list, with an $11,797 difference between its average longer-term auto loan ($39,854) and its average auto loan of six years or less ($28,057).
For the states at the other end of both prospective lists, the opposite often holds true. For instance, in the District of Columbia, the average auto loan with a term longer than six years has a lower monthly payment than a shorter-term loan: $616 versus $619. It’s a small difference, but it’s reflected in the fact that there’s a much smaller gap between the average amount financed in a longer-term loan ($34,199) and a shorter-term loan ($32,372) in D.C.
And again, long, large loans can impact borrowers’ financial health, especially when high monthly payments become too much to keep up with and cause auto loan borrowers to become delinquent.
Full rankings: States with the biggest differences in average monthly payments on auto loans by term length
| Rank | State | Avg. monthly payment, 6 years or less | Avg. monthly payment, longer than 6 years | % difference | $ difference |
|---|---|---|---|---|---|
| 1 | Wyoming | $606 | $733 | 21.0% | $127 |
| 2 | Alaska | $604 | $728 | 20.5% | $124 |
| 3 | West Virginia | $551 | $661 | 20.0% | $110 |
| 4 | Iowa | $547 | $654 | 19.6% | $107 |
| 5 | New Mexico | $601 | $706 | 17.5% | $105 |
| 6 | Idaho | $551 | $654 | 18.7% | $103 |
| 6 | Vermont | $536 | $639 | 19.2% | $103 |
| 8 | Hawaii | $609 | $711 | 16.7% | $102 |
| 8 | Alabama | $582 | $684 | 17.5% | $102 |
| 10 | South Dakota | $555 | $654 | 17.8% | $99 |
| 11 | Mississippi | $604 | $702 | 16.2% | $98 |
| 12 | Kentucky | $542 | $638 | 17.7% | $96 |
| 13 | Arkansas | $582 | $677 | 16.3% | $95 |
| 14 | Montana | $577 | $669 | 15.9% | $92 |
| 15 | North Dakota | $597 | $685 | 14.7% | $88 |
| 16 | Nebraska | $540 | $626 | 15.9% | $86 |
| 17 | South Carolina | $577 | $659 | 14.2% | $82 |
| 18 | Kansas | $568 | $649 | 14.3% | $81 |
| 19 | Georgia | $637 | $716 | 12.4% | $79 |
| 19 | Utah | $554 | $633 | 14.3% | $79 |
| 21 | Indiana | $540 | $617 | 14.3% | $77 |
| 22 | Wisconsin | $542 | $618 | 14.0% | $76 |
| 23 | Oklahoma | $581 | $655 | 12.7% | $74 |
| 23 | Minnesota | $557 | $631 | 13.3% | $74 |
| 25 | Missouri | $561 | $634 | 13.0% | $73 |
| 26 | Ohio | $545 | $617 | 13.2% | $72 |
| 27 | Louisiana | $621 | $690 | 11.1% | $69 |
| 27 | Colorado | $589 | $658 | 11.7% | $69 |
| 29 | Massachusetts | $557 | $625 | 12.2% | $68 |
| 30 | Maine | $542 | $609 | 12.4% | $67 |
| 31 | Texas | $675 | $738 | 9.3% | $63 |
| 31 | Maryland | $622 | $685 | 10.1% | $63 |
| 31 | North Carolina | $587 | $650 | 10.7% | $63 |
| 34 | Arizona | $604 | $663 | 9.8% | $59 |
| 34 | New Hampshire | $551 | $610 | 10.7% | $59 |
| 36 | Virginia | $593 | $648 | 9.3% | $55 |
| 36 | Pennsylvania | $550 | $605 | 10.0% | $55 |
| 38 | Nevada | $635 | $688 | 8.3% | $53 |
| 38 | Illinois | $586 | $639 | 9.0% | $53 |
| 38 | Rhode Island | $521 | $574 | 10.2% | $53 |
| 41 | Oregon | $538 | $590 | 9.7% | $52 |
| 42 | California | $635 | $685 | 7.9% | $50 |
| 43 | Delaware | $579 | $624 | 7.8% | $45 |
| 43 | Michigan | $546 | $591 | 8.2% | $45 |
| 45 | Tennessee | $597 | $638 | 6.9% | $41 |
| 46 | Florida | $647 | $678 | 4.8% | $31 |
| 46 | Washington | $605 | $636 | 5.1% | $31 |
| 48 | Connecticut | $568 | $596 | 4.9% | $28 |
| 49 | New York | $612 | $632 | 3.3% | $20 |
| 50 | New Jersey | $626 | $623 | -0.5% | -$3 |
| 50 | District of Columbia | $619 | $616 | -0.5% | -$3 |
Full rankings: States with the biggest differences in average financed amount on auto loans by term length
| Rank | State | Avg. financed amount, 6 years or less | Avg. financed amount on loans, longer than 6 years | % difference | $ difference |
|---|---|---|---|---|---|
| 1 | Alaska | $31,902 | $45,677 | 43.2% | $13,775 |
| 2 | Wyoming | $31,661 | $44,886 | 41.8% | $13,225 |
| 3 | Idaho | $28,463 | $40,981 | 44.0% | $12,518 |
| 4 | Iowa | $27,587 | $40,087 | 45.3% | $12,500 |
| 5 | New Mexico | $30,016 | $41,943 | 39.7% | $11,927 |
| 6 | West Virginia | $28,057 | $39,854 | 42.0% | $11,797 |
| 7 | South Dakota | $28,423 | $40,046 | 40.9% | $11,623 |
| 8 | Montana | $30,083 | $40,923 | 36.0% | $10,840 |
| 9 | Vermont | $27,968 | $38,608 | 38.0% | $10,640 |
| 10 | Alabama | $28,647 | $39,282 | 37.1% | $10,635 |
| 11 | Kentucky | $26,865 | $37,351 | 39.0% | $10,486 |
| 12 | Arkansas | $29,103 | $39,406 | 35.4% | $10,303 |
| 13 | Oklahoma | $28,951 | $39,147 | 35.2% | $10,196 |
| 14 | Hawaii | $32,399 | $42,557 | 31.4% | $10,158 |
| 15 | Nebraska | $27,397 | $37,491 | 36.8% | $10,094 |
| 16 | Utah | $29,221 | $39,258 | 34.3% | $10,037 |
| 17 | Mississippi | $29,908 | $39,849 | 33.2% | $9,941 |
| 18 | Kansas | $29,052 | $38,640 | 33.0% | $9,588 |
| 19 | Oregon | $28,154 | $37,685 | 33.9% | $9,531 |
| 20 | North Dakota | $31,112 | $40,631 | 30.6% | $9,519 |
| 21 | Indiana | $26,651 | $36,164 | 35.7% | $9,513 |
| 22 | Minnesota | $28,914 | $38,266 | 32.3% | $9,352 |
| 23 | Wisconsin | $27,430 | $36,708 | 33.8% | $9,278 |
| 24 | Ohio | $27,263 | $36,287 | 33.1% | $9,024 |
| 25 | Washington | $31,369 | $40,338 | 28.6% | $8,969 |
| 26 | South Carolina | $28,769 | $37,671 | 30.9% | $8,902 |
| 27 | Missouri | $27,816 | $36,659 | 31.8% | $8,843 |
| 28 | Maine | $28,343 | $37,073 | 30.8% | $8,730 |
| 29 | Louisiana | $32,021 | $40,690 | 27.1% | $8,669 |
| 30 | Arizona | $31,362 | $39,939 | 27.3% | $8,577 |
| 31 | Colorado | $30,717 | $39,289 | 27.9% | $8,572 |
| 32 | Georgia | $32,521 | $40,569 | 24.7% | $8,048 |
| 33 | Tennessee | $30,041 | $37,986 | 26.4% | $7,945 |
| 34 | Texas | $34,786 | $42,640 | 22.6% | $7,854 |
| 35 | North Carolina | $30,178 | $37,954 | 25.8% | $7,776 |
| 36 | Maryland | $33,009 | $40,505 | 22.7% | $7,496 |
| 37 | Virginia | $30,789 | $38,155 | 23.9% | $7,366 |
| 38 | Michigan | $27,601 | $34,949 | 26.6% | $7,348 |
| 39 | California | $33,770 | $40,997 | 21.4% | $7,227 |
| 40 | New Hampshire | $28,956 | $36,059 | 24.5% | $7,103 |
| 41 | Pennsylvania | $28,836 | $35,683 | 23.7% | $6,847 |
| 42 | Nevada | $33,213 | $40,012 | 20.5% | $6,799 |
| 43 | Delaware | $29,677 | $36,459 | 22.9% | $6,782 |
| 44 | Illinois | $30,226 | $36,938 | 22.2% | $6,712 |
| 45 | Massachusetts | $29,511 | $36,168 | 22.6% | $6,657 |
| 46 | Florida | $33,868 | $40,073 | 18.3% | $6,205 |
| 47 | Rhode Island | $27,324 | $33,444 | 22.4% | $6,120 |
| 48 | New York | $32,268 | $36,852 | 14.2% | $4,584 |
| 49 | Connecticut | $29,830 | $34,364 | 15.2% | $4,534 |
| 50 | New Jersey | $32,596 | $35,873 | 10.1% | $3,277 |
| 51 | District of Columbia | $32,372 | $34,199 | 5.6% | $1,827 |
4 tips on balancing auto loan length with affordability
If you’re in the market for a new (or new-to-you) vehicle and you’re going to need a loan to afford it, there are some steps you can take to balance the monthly payment with how many months you’ll make it. Here are our top expert tips.
- Take stock of what you can actually afford. “It’s not about how much you can borrow,” Schulz explains. “It’s about what you can afford when you factor in your own personal finances and your risk tolerance.” A lender might offer you a huge loan for your new car, but that doesn’t mean you’ll be able to comfortably make payments. Schulz recommends plugging your numbers into an online affordability calculator to help you make a more informed decision.
- Shop around. You’ve heard this advice before, Schulz admits — but it’s still important. “There can be real differences in offers among lenders, and if you don’t take the time to comparison shop, you could be dooming yourself to paying more than you need to.” Plus, he explains, it’s never been easier to shop for both dealers and lenders from the comfort of your own home, thanks to the internet. (Psst: The same is true if you’re refinancing a current auto loan.)
- Think carefully about what you really need in a vehicle. “Sure, you may love that sports car or that big, powerful truck,” says Schulz, “but is it amazing enough to take on an extra year of debt for? You might be able to pay less if you opt for a similar, lower-priced model or even if you’re willing to forgo some bells and whistles.”
- Finally, if a car purchase is on the horizon, start saving now. “Budgets are tight these days,” Schulz admits, “so it can be tough to scrounge up some extra cash for savings, but it can be extremely helpful. Even putting away a few dollars a month consistently in a high-yield savings account can pay real benefits when it comes time to buy that new vehicle.”
Methodology
LendingTree researchers analyzed about 154,000 anonymized credit reports of LendingTree users with active auto loan accounts from Oct. 1 to Dec. 31, 2025.
The analysis included new and used vehicle loans, including individual and joint accounts. For each borrower, researchers selected one representative active automobile loan, defined as the auto tradeline with the largest current balance.
Researchers calculated the share of borrowers with loan terms longer than six years and longer than seven years by state. Estimated total interest paid was calculated as the monthly payment multiplied by the loan term minus the loan’s highest balance, which was also used as a proxy for the financed amount. LendingTree then compared estimated total interest paid, monthly payments and financed amounts between loans lasting six years or less and those lasting longer than six years.
Get auto loan offers from up to 5 lenders in minutes