32% of US Employer Businesses Generate at Least $1M in Revenue


Hitting seven figures in annual revenue is a milestone for any business, and a growing share of American employers are getting there.
This LendingTree analysis shows how many employer businesses cleared the $1 million mark in 2023. The numbers vary widely by state, industry and owner demographics.
Here’s what stands out.
- 1.9 million U.S. employer businesses brought in at least $1 million in revenue in 2023, representing 32.3% of employer businesses. That’s up 3.6 percentage points from 2019, when 28.7% of employer businesses generated at least $1 million in revenue.
- 51.1% of employer businesses in the District of Columbia brought in at least $1 million in revenue — the highest share nationwide. Delaware and Alabama (both 41.0%) followed. Florida had the lowest share (27.9%), with Montana (29.1%) and Idaho (30.7%) rounding out the bottom three.
- The management of companies and enterprises industry had the highest share of employer businesses with at least $1 million in revenue, at 87.8%. Wholesale trade (59.9%) and mining, quarrying and oil and gas extraction (50.4%) followed.
- Male-owned employer businesses were more likely than female-owned employer businesses to bring in at least $1 million in revenue. 35.0% of male-owned employer firms met the million-dollar revenue threshold, compared with 22.2% of female-owned firms — a gap of 12.8 percentage points. Nonminority-owned businesses were also more likely than minority-owned employer businesses to generate at least $1 million in revenue, at 32.8% versus 27.4%.
- South Dakota had the largest increase in the share of businesses bringing in at least $1 million in revenue between 2019 and 2023. That share rose by 8.4 percentage points during that period. Mississippi (7.9 percentage points) and Missouri (6.3) followed. California (1.3 percentage points) and Michigan (2.5) had the smallest increases.
In this study, we looked at 2023 U.S. Census Bureau Annual Business Survey data on employer firms by receipts size to estimate how many generated at least $1 million in revenue. This data only measures revenue, not profit. Companies with high revenue may not be profitable, and this research doesn’t analyze the profitability of firms.
Additionally, this survey only looks at employer for-profit nonfarm businesses with at least $1,000 in annual revenue, so it also doesn’t include nonemployer firms or very small businesses.
Nearly one-third of employer businesses cleared $1 million in 2023
In 2023, 1.9 million employer businesses reported at least $1 million in revenue, or 32.3% of all employer businesses. That’s a 3.6 percentage point jump from 2019, when 28.7% of employer businesses reached that level.

Matt Schulz, LendingTree chief consumer finance analyst and author of “Ask Questions, Save Money, Make More: How to Take Control of Your Financial Life,” says that some of this increase is about real business growth, but inflation almost certainly plays a role, too.
“Revenue is measured in dollars, and those dollars don’t buy what they did in 2019,” he says. “When businesses raise prices to cover higher costs for labor, supplies, rent and transportation, their revenue may climb even if they aren’t selling much more. That means crossing the $1 million mark is certainly an accomplishment, but it doesn’t automatically mean a company is more profitable or dramatically bigger. Revenue tells an important story, but it doesn’t tell the whole story.”
D.C. leads the nation, while Florida trails
More than half (51.1%) of employer businesses in the District of Columbia reached $1 million in revenue, the highest share in the country. Delaware and Alabama tied for second, at 41.0% each. Notably, six of the 10 top states are in the South, with Tennessee, Mississippi and Louisiana joining the top three.
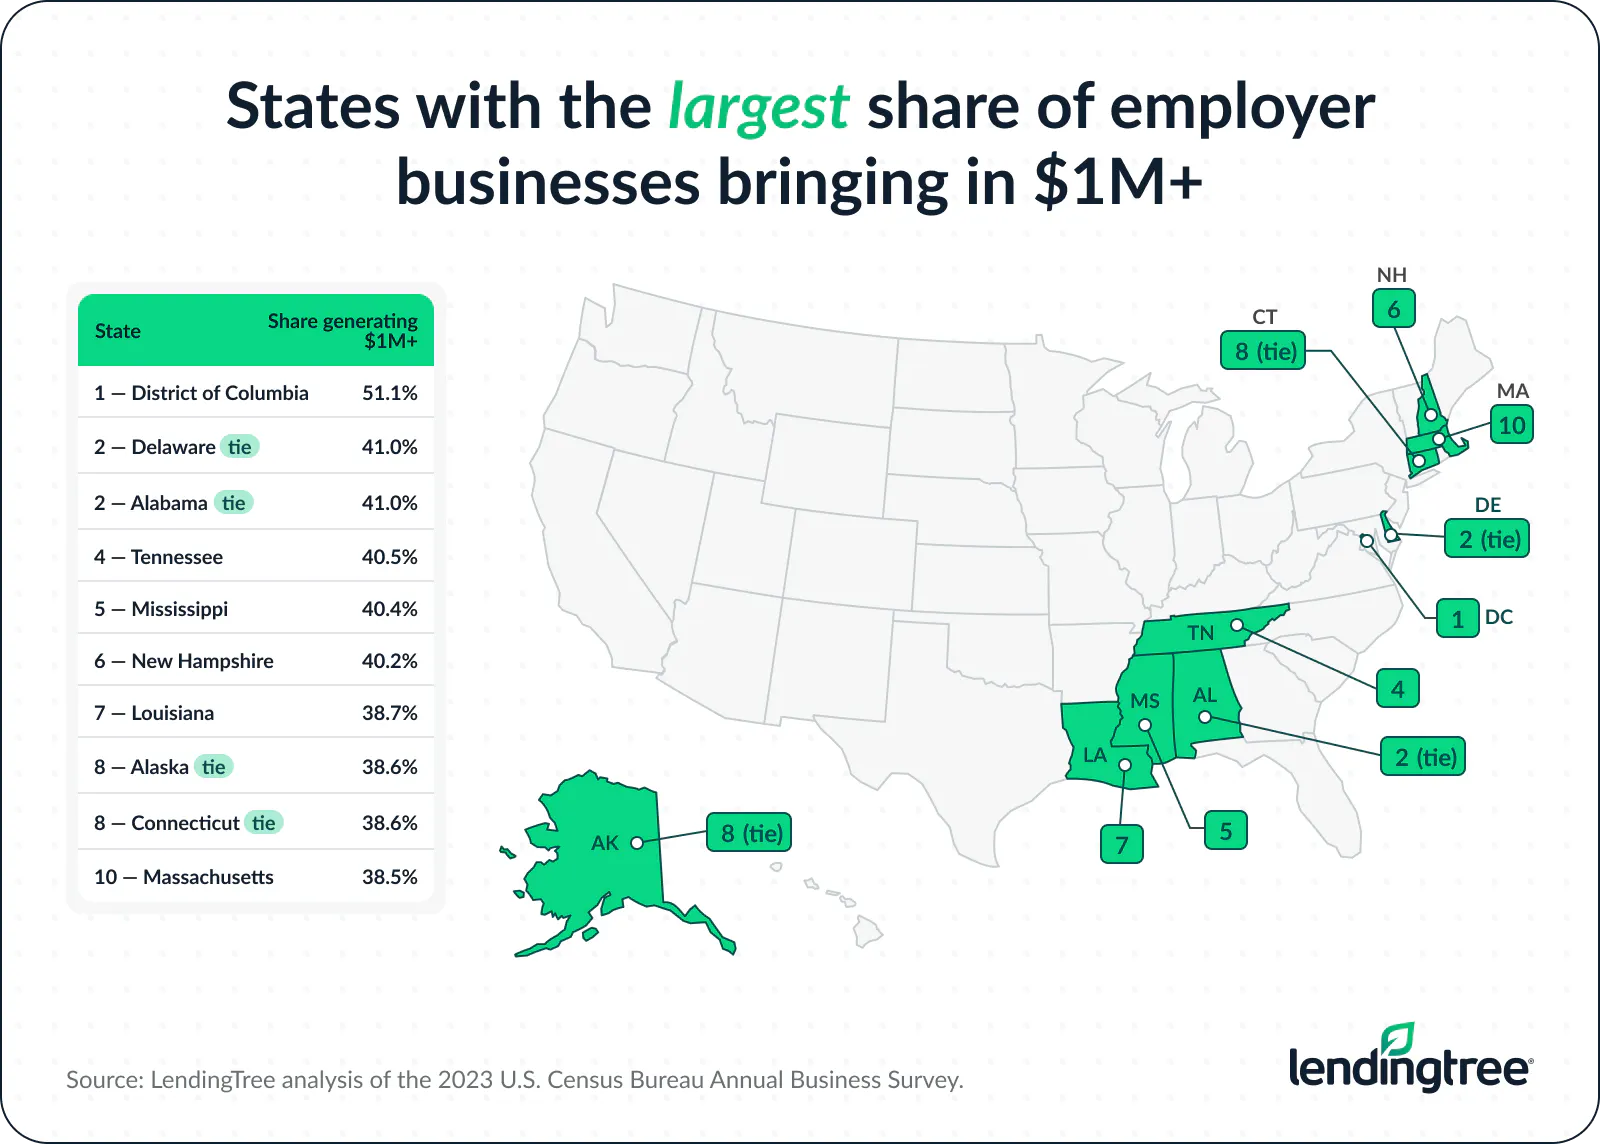
At the other end, Florida had the smallest share at 27.9%. Montana (29.1%) and Idaho (30.7%) rounded out the bottom three. The bottom 10 are largely concentrated in the West, with California, Washington, Oregon, Utah, Colorado, Idaho and Montana among the lowest-ranked states.
Full rankings: States with the largest/smallest share of employer businesses bringing in $1M+
| Rank | State | Businesses earning $1M+ | All businesses | % earning $1M+ |
|---|---|---|---|---|
| 1 | District of Columbia | 7,388 | 14,458 | 51.1% |
| 2 | Delaware | 9,168 | 22,351 | 41.0% |
| 2 | Alabama | 28,975 | 70,675 | 41.0% |
| 4 | Tennessee | 38,982 | 96,320 | 40.5% |
| 5 | Mississippi | 16,897 | 41,795 | 40.4% |
| 6 | New Hampshire | 11,817 | 29,391 | 40.2% |
| 7 | Louisiana | 29,891 | 77,309 | 38.7% |
| 8 | Alaska | 6,200 | 16,043 | 38.6% |
| 8 | Connecticut | 25,192 | 65,345 | 38.6% |
| 10 | Massachusetts | 52,729 | 137,010 | 38.5% |
| 11 | Kentucky | 23,893 | 62,545 | 38.2% |
| 12 | Nevada | 22,434 | 59,487 | 37.7% |
| 13 | North Dakota | 6,937 | 18,435 | 37.6% |
| 14 | Maryland | 39,004 | 104,495 | 37.3% |
| 15 | Arkansas | 18,272 | 49,099 | 37.2% |
| 16 | Ohio | 62,722 | 170,012 | 36.9% |
| 17 | New Jersey | 68,246 | 185,622 | 36.8% |
| 18 | Rhode Island | 8,324 | 22,868 | 36.4% |
| 18 | Indiana | 37,636 | 103,465 | 36.4% |
| 18 | Texas | 171,223 | 470,732 | 36.4% |
| 21 | West Virginia | 8,264 | 22,760 | 36.3% |
| 22 | Kansas | 18,823 | 52,627 | 35.8% |
| 23 | Missouri | 36,746 | 102,851 | 35.7% |
| 23 | Wyoming | 6,732 | 18,862 | 35.7% |
| 23 | South Dakota | 7,980 | 22,383 | 35.7% |
| 26 | Michigan | 58,266 | 163,461 | 35.6% |
| 26 | South Carolina | 30,700 | 86,170 | 35.6% |
| 26 | Oklahoma | 24,739 | 69,554 | 35.6% |
| 29 | Wisconsin | 35,687 | 101,316 | 35.2% |
| 30 | Georgia | 66,251 | 188,526 | 35.1% |
| 30 | Vermont | 5,760 | 16,393 | 35.1% |
| 32 | Hawaii | 8,133 | 23,211 | 35.0% |
| 33 | New Mexico | 11,292 | 32,313 | 34.9% |
| 33 | Pennsylvania | 74,348 | 212,828 | 34.9% |
| 35 | Minnesota | 38,336 | 110,484 | 34.7% |
| 35 | Arizona | 41,374 | 119,315 | 34.7% |
| 37 | Maine | 11,386 | 32,944 | 34.6% |
| 38 | Nebraska | 14,320 | 41,535 | 34.5% |
| 39 | Iowa | 19,865 | 57,667 | 34.4% |
| 40 | Virginia | 49,798 | 147,928 | 33.7% |
| 41 | North Carolina | 60,814 | 181,474 | 33.5% |
| 42 | Illinois | 79,477 | 238,089 | 33.4% |
| 43 | California | 262,606 | 791,790 | 33.2% |
| 44 | Washington | 50,673 | 153,111 | 33.1% |
| 45 | Oregon | 29,515 | 91,384 | 32.3% |
| 46 | Utah | 24,752 | 76,758 | 32.2% |
| 47 | New York | 134,613 | 427,227 | 31.5% |
| 48 | Colorado | 44,043 | 140,658 | 31.3% |
| 49 | Idaho | 14,186 | 46,244 | 30.7% |
| 50 | Montana | 9,984 | 34,269 | 29.1% |
| 51 | Florida | 139,545 | 500,293 | 27.9% |
Management of companies tops the industry list
Looking by industry, the management of companies and enterprises (such as accountants and auditors, bookkeepers, financial managers and more) had the highest share of million-dollar employer businesses by a wide margin, at 87.8%. Wholesale trade came next at 59.9%, followed by mining, quarrying and oil and gas extraction at 50.4%.
Industries where employer businesses most commonly bring in $1M+
| Rank | Industry | Businesses earning $1M+ | All businesses | % earning $1M+ |
|---|---|---|---|---|
| 1 | Management of companies and enterprises | 19,982 | 22,747 | 87.8% |
| 2 | Wholesale trade | 164,441 | 274,581 | 59.9% |
| 3 | Mining, quarrying and oil and gas extraction | 8,283 | 16,423 | 50.4% |
| 4 | Utilities | 3,211 | 6,850 | 46.9% |
| 5 | Construction | 309,807 | 774,636 | 40.0% |
| 6 | Agriculture, forestry, fishing and hunting | 7,632 | 20,794 | 36.7% |
| 7 | Accommodation and food services | 201,817 | 563,147 | 35.8% |
| 8 | Information | 25,363 | 81,268 | 31.2% |
| 9 | Healthcare and social assistance | 210,904 | 683,909 | 30.8% |
| 10 | Educational services | 27,057 | 102,149 | 26.5% |
| 11 | Administrative and support and waste management and remediation services | 94,439 | 369,239 | 25.6% |
| 12 | Professional, scientific and technical services | 205,874 | 857,979 | 24.0% |
| 13 | Arts, entertainment and recreation | 34,372 | 146,468 | 23.5% |
| 14 | Finance and insurance | 52,695 | 230,302 | 22.9% |
| 15 | Real estate and rental and leasing | 61,240 | 352,784 | 17.4% |
| 16 | Other services (except public administration) | 62,821 | 410,671 | 15.3% |
| 17 | Industries not classified | 670 | 6,777 | 9.9% |
For those looking to start a business, Schulz says those industries earning the most aren’t necessarily the best ones to enter. “That’s because big revenues don’t necessarily mean big profits,” he says. “In many cases, it can mean sky-high expenses, which can make it difficult for new businesses to get a foothold. Prospective owners should focus less on which industries produce the biggest revenue and more on where their skills and opportunities give them the best chance for success.”
Meanwhile, the industry with the lowest share of million-dollar employer businesses is industries not classified (9.9%). That’s followed by other services except public administration (such as car service technicians and mechanics, repair workers, hairdressers and more) at 15.3%, and real estate and rental and leasing businesses at 17.4%.
Male- and nonminority-owned businesses are more likely to hit $1 million
Ownership demographics show clear gaps. Among male-owned employer businesses, 35.0% reached $1 million in revenue, compared with 22.2% of female-owned businesses — a difference of 12.8 percentage points.
Nonminority-owned businesses also had an edge over minority-owned ones, with 32.8% reaching the threshold versus 27.4%. According to the Census Bureau, minority-owned businesses are classified as those owned by any race and ethnicity combination other than non-Hispanic and white, while nonminority-owned businesses are those with non-Hispanic white owners.
Employer businesses bringing in $1 million or more by demographic
| Demographic | Businesses earning $1M+ | All businesses | % earning $1M+ |
|---|---|---|---|
| By sex | |||
| Male | 1,273,933 | 3,638,693 | 35.0% |
| Equally male-owned and female-owned | 218,372 | 707,384 | 30.9% |
| Female | 300,620 | 1,356,990 | 22.2% |
| By ethnicity | |||
| Non-Hispanic | 1,648,229 | 5,150,215 | 32.0% |
| Equally Hispanic/non-Hispanic | 17,342 | 57,029 | 30.4% |
| Hispanic | 127,354 | 495,823 | 25.7% |
| By race | |||
| White | 1,530,442 | 4,781,974 | 32.0% |
| Asian | 212,011 | 684,915 | 31.0% |
| Native Hawaiian and other Pacific Islander | 2,478 | 9,414 | 26.3% |
| American Indian and Alaska Native | 13,182 | 54,914 | 24.0% |
| Black or African American | 37,466 | 200,884 | 18.7% |
| By race/ethnicity combination | |||
| Nonminority | 1,377,902 | 4,202,326 | 32.8% |
| Equally minority/nonminority | 31,398 | 99,966 | 31.4% |
| Minority | 383,624 | 1,400,774 | 27.4% |
| By veteran status | |||
| Nonveteran | 1,684,748 | 5,343,977 | 31.5% |
| Equally veteran/nonveteran | 31,572 | 97,760 | 32.3% |
| Veteran | 76,605 | 261,332 | 29.3% |
Breaking that down more specifically by race, white-owned businesses had the highest rate of million-dollar businesses, at 32.0%. That’s followed by Asian-owned businesses (31.0%) and Native Hawaiian and other Pacific Islander-owned businesses (26.3%). Meanwhile, just 18.7% of Black-owned businesses generated at least $1 million.
Schulz says access to capital is likely one of the biggest issues for minority business owners.
“Black and Hispanic Americans tend to have lower credit scores than their white counterparts, making it harder for them to access credit,” he says. “Also, women and minority entrepreneurs may have less personal or family wealth available to invest in their companies or use as a cushion when times get tough. That makes the already-challenging task of starting a business that much harder.”
South Dakota saw the biggest gains since 2019
From 2019 to 2023, every state saw an increase in the percentage of businesses generating at least $1 million. South Dakota posted the largest increase, up 8.4 percentage points in the time period analyzed. Mississippi (7.9 points) and Missouri (6.3) followed.

Some states, meanwhile, barely moved. California (1.3 points) and Michigan (2.5 points) had the smallest increases, with Idaho, Virginia and Tennessee tying for third at 2.6.
That said, Schulz believes the bottom-ranked states are still great places for business owners.
“Slower growth doesn’t necessarily mean California or Michigan became worse places to run a business,” he says. “The change may partly reflect the types, sizes and ages of businesses already operating there. A state with many established companies may have less room for a dramatic increase than one starting from a lower base. Industry mix matters, too, because some sectors are simply more likely to generate $1 million in annual revenue.”
Full rankings: States where the share of employer businesses generating $1M+ in revenue increased the most/least, 2019 to 2023
| Rank | State | Businesses earning $1M+ (2019) | Businesses earning $1M+ (2023) | Share earning $1M+ (2019) | Share earning $1M+ (2023) | % point change |
|---|---|---|---|---|---|---|
| 1 | South Dakota | 5,930 | 7,980 | 27.2% | 35.7% | 8.4 |
| 2 | Mississippi | 13,071 | 16,897 | 32.5% | 40.4% | 7.9 |
| 3 | Missouri | 31,621 | 36,746 | 29.5% | 35.7% | 6.3 |
| 4 | Oklahoma | 20,329 | 24,739 | 29.6% | 35.6% | 6.0 |
| 5 | Iowa | 17,185 | 19,865 | 28.9% | 34.4% | 5.5 |
| 6 | Louisiana | 25,511 | 29,891 | 33.3% | 38.7% | 5.4 |
| 7 | Vermont | 4,966 | 5,760 | 29.9% | 35.1% | 5.3 |
| 7 | Nebraska | 12,555 | 14,320 | 29.2% | 34.5% | 5.3 |
| 9 | Arkansas | 15,113 | 18,272 | 32.0% | 37.2% | 5.2 |
| 10 | Alabama | 24,505 | 28,975 | 35.9% | 41.0% | 5.1 |
| 11 | Wyoming | 5,320 | 6,732 | 30.6% | 35.7% | 5.0 |
| 11 | Utah | 18,839 | 24,752 | 27.2% | 32.2% | 5.0 |
| 13 | New Jersey | 59,811 | 68,246 | 31.8% | 36.8% | 4.9 |
| 14 | North Dakota | 6,566 | 6,937 | 32.8% | 37.6% | 4.8 |
| 15 | Massachusetts | 46,659 | 52,729 | 33.7% | 38.5% | 4.7 |
| 16 | Maine | 9,733 | 11,386 | 30.2% | 34.6% | 4.4 |
| 16 | Alaska | 5,438 | 6,200 | 34.3% | 38.6% | 4.4 |
| 18 | South Carolina | 24,727 | 30,700 | 31.4% | 35.6% | 4.3 |
| 19 | West Virginia | 7,475 | 8,264 | 32.1% | 36.3% | 4.2 |
| 19 | Minnesota | 34,371 | 38,336 | 30.5% | 34.7% | 4.2 |
| 19 | Maryland | 34,380 | 39,004 | 33.2% | 37.3% | 4.2 |
| 22 | Connecticut | 23,071 | 25,192 | 34.5% | 38.6% | 4.1 |
| 23 | District of Columbia | 7,196 | 7,388 | 47.1% | 51.1% | 4.0 |
| 24 | New Hampshire | 10,800 | 11,817 | 36.3% | 40.2% | 3.9 |
| 25 | Colorado | 37,975 | 44,043 | 27.5% | 31.3% | 3.8 |
| 26 | Illinois | 72,709 | 79,477 | 29.7% | 33.4% | 3.7 |
| 26 | Arizona | 33,631 | 41,374 | 31.0% | 34.7% | 3.7 |
| 26 | Texas | 141,265 | 171,223 | 32.7% | 36.4% | 3.7 |
| 29 | Kentucky | 21,748 | 23,893 | 34.7% | 38.2% | 3.5 |
| 29 | Ohio | 57,164 | 62,722 | 33.4% | 36.9% | 3.5 |
| 31 | Georgia | 55,776 | 66,251 | 31.7% | 35.1% | 3.4 |
| 31 | North Carolina | 51,288 | 60,814 | 30.1% | 33.5% | 3.4 |
| 33 | Pennsylvania | 67,857 | 74,348 | 31.6% | 34.9% | 3.3 |
| 33 | Florida | 111,859 | 139,545 | 24.6% | 27.9% | 3.3 |
| 33 | Washington | 45,078 | 50,673 | 29.8% | 33.1% | 3.3 |
| 36 | New York | 126,516 | 134,613 | 28.5% | 31.5% | 3.1 |
| 37 | Indiana | 34,094 | 37,636 | 33.4% | 36.4% | 3.0 |
| 37 | Delaware | 7,476 | 9,168 | 38.0% | 41.0% | 3.0 |
| 39 | Oregon | 26,821 | 29,515 | 29.4% | 32.3% | 2.9 |
| 39 | Kansas | 18,072 | 18,823 | 32.9% | 35.8% | 2.9 |
| 39 | Nevada | 18,563 | 22,434 | 34.8% | 37.7% | 2.9 |
| 39 | New Mexico | 10,336 | 11,292 | 32.1% | 34.9% | 2.9 |
| 43 | Rhode Island | 7,836 | 8,324 | 33.6% | 36.4% | 2.8 |
| 43 | Montana | 8,400 | 9,984 | 26.4% | 29.1% | 2.8 |
| 45 | Hawaii | 7,647 | 8,133 | 32.4% | 35.0% | 2.7 |
| 45 | Wisconsin | 34,000 | 35,687 | 32.6% | 35.2% | 2.7 |
| 47 | Tennessee | 34,800 | 38,982 | 37.9% | 40.5% | 2.6 |
| 47 | Virginia | 45,053 | 49,798 | 31.1% | 33.7% | 2.6 |
| 47 | Idaho | 11,381 | 14,186 | 28.1% | 30.7% | 2.6 |
| 50 | Michigan | 54,468 | 58,266 | 33.2% | 35.6% | 2.5 |
| 51 | California | 240,105 | 262,606 | 31.9% | 33.2% | 1.3 |
Growing your business without sacrificing financial stability
Higher revenue doesn’t automatically translate to a healthier business, but it certainly opens a few doors. For new business owners, we offer the following advice for boosting your revenue:
- Focus on what’s most profitable. “Know which products, services and customers make you money,” Schulz says. “More sales won’t necessarily help if they come with thin margins or high costs, so focus your resources on the areas that contribute most to your bottom line.”
- Stay ahead of cash flow. “Forecast your cash flow regularly so you know when money is coming in and when expenses are due,” he says. “Even a growing business can struggle when bills need to be paid before customers pay you, so planning for those gaps is critical.”
- Borrow with a clear purpose. “Shop around and compare rates and terms before choosing financing,” he says. “Know exactly how you’ll use the money and how the payments fit into your budget — and remember that qualifying to borrow a certain amount doesn’t mean you need or can afford to take it all.”
Methodology
LendingTree analyzed 2023 U.S. Census Bureau Annual Business Survey data on employer firms by receipts size to estimate how many generated at least $1 million in revenue. The 2023 data was the latest available at the time of research.
We ranked the states, industries and demographics by comparing the number of businesses generating at least $1 million in revenue with the total number of businesses in each category.
Additionally, we analyzed 2019 U.S. Census Bureau Annual Business Survey data to track how business receipts changed between 2019 and 2023.
Compare business loan offers