Young Businesses Added More Than 1.8 Million Net Jobs in 2025 as Older Businesses Lost Nearly 1.2 Million Jobs


Young businesses drove job growth in the U.S. in 2025, adding more than 1.8 million net jobs while older businesses lost nearly 1.2 million.
This isn’t a new phenomenon. LendingTree’s analysis of U.S. Bureau of Labor Statistics (BLS) Business Employment Dynamics data found that from 2016 through 2025, young businesses added more than 18.8 million net jobs, compared with a net loss of 3.0 million jobs among older businesses.
The trend is widespread. Startups saw net job growth in all 50 states and the District of Columbia in 2025, while older businesses shed jobs in most states.
Here’s more of what we found.
Using U.S. BLS Business Employment Dynamics data, we define young businesses as those less than 5 years old. We also refer to them as startups. Any business 5 years old or older is considered an “older business” in this report.
- Young businesses added slightly more than 1.8 million net jobs in 2025, while older businesses lost nearly 1.2 million net jobs. That represents an overall private-sector net gain of 636,626 jobs. The difference in job growth between young and older businesses wasn’t just a one-year blip. From 2016 through 2025, young businesses added more than 18.8 million net jobs, compared with a net loss of 3.0 million jobs among older businesses.
- Young businesses gained more jobs than they lost in every state in 2025, but large losses among older businesses meant net job losses in 15 states. California had the largest young-business net job gain at 256,940, followed by Texas (177,423) and Florida (153,448). However, in 15 states, losses among older businesses outweighed young-business gains. For example, California saw a net loss of 48,594 private-sector jobs that year as older businesses in the state lost 305,534 jobs.
- Older businesses gained more jobs than they lost in just two of the 11 industries we analyzed in 2025. Young businesses gained more jobs than they lost in all 11 industries. Education and health services and transportation and warehousing were the only industries with net job gains among both young and older businesses. Young businesses added a net 395,146 jobs in education and health services, while older businesses added a net 415,163. Meanwhile, young and older businesses posted net gains of 55,091 and 71,138 jobs in transportation and warehousing, respectively.
- Two industries dominated young-business job growth in 2025. Young businesses added a net 431,398 jobs in leisure and hospitality and a net 395,146 jobs in education and health services. Leisure and hospitality was the leading source of young-business job growth in 25 states and D.C. in 2025, while education and health services led in 24 states. (Utah was the only state where a different industry — professional and business services — topped the list.)
Startups added more than 1.8 million net jobs in 2025; older businesses lost nearly 1.2 million
The private sector added a net 636,626 jobs in 2025, according to the U.S. BLS. That’s less than half the net job growth seen in 2024 (1,448,270) and less than a tenth of the growth in 2022, when the private sector added 6,929,203 net jobs, the most during the 2016-to-2025 period we analyzed.
The growth in 2025 was driven primarily by young businesses, which we define as businesses less than 5 years old. These businesses added a net 1,801,511 jobs in 2025, while older businesses lost a net 1,164,885. Net job losses generally increased with business age in 2025.
U.S. net job change by business age, 2025
| Age of business | Net job change |
|---|---|
| Less than 1 year old | 1,808,456 |
| 1 to 4 years | -6,945 |
| 5 to 9 years | -199,435 |
| 10 years or older | -965,450 |
| All ages | 636,626 |
This wasn’t just a one-year anomaly. From 2016 through 2025, startups added more than 18.8 million net jobs. Older businesses lost more than 3.0 million.
During that period, young-business net job gains were largely steady. In six of those 10 years, young businesses added between 1.8 and 1.9 million net jobs. The exceptions were 2020, when the coronavirus pandemic began, and the three years that followed. Young businesses added between nearly 1.5 million and more than 2.6 million net jobs in those volatile years. Meanwhile, net job changes among older businesses ranged from a gain of more than 4.3 million in 2022 to a loss of nearly 7.0 million in 2021.
Young-business and overall U.S. net job change, 2016-2025
| Year | Young-business net job change | Older-business net job change | Overall net job change |
|---|---|---|---|
| 2025 | 1,801,511 | -1,164,885 | 636,626 |
| 2024 | 1,829,319 | -381,049 | 1,448,270 |
| 2023 | 2,074,941 | 1,263,592 | 3,338,533 |
| 2022 | 2,610,104 | 4,319,099 | 6,929,203 |
| 2021 | 1,495,972 | -6,974,660 | -5,478,688 |
| 2020 | 1,629,113 | -1,262,143 | 366,970 |
| 2019 | 1,859,406 | -14,588 | 1,844,818 |
| 2018 | 1,819,587 | 348,646 | 2,168,233 |
| 2017 | 1,858,615 | 174,050 | 2,032,665 |
| 2016 | 1,854,063 | 657,526 | 2,511,589 |
| 2016-2025 | 18,832,631 | -3,034,412 | 15,798,219 |
Young businesses gained more jobs than they lost in every state in 2025, but older-business losses drove overall job losses in 15 states
Every state and the District of Columbia saw startups gain more jobs than they lost in 2025. The nation’s most populous states saw the biggest net gains among young businesses, with California (256,940) leading the way, followed by Texas (177,423) and Florida (153,448).
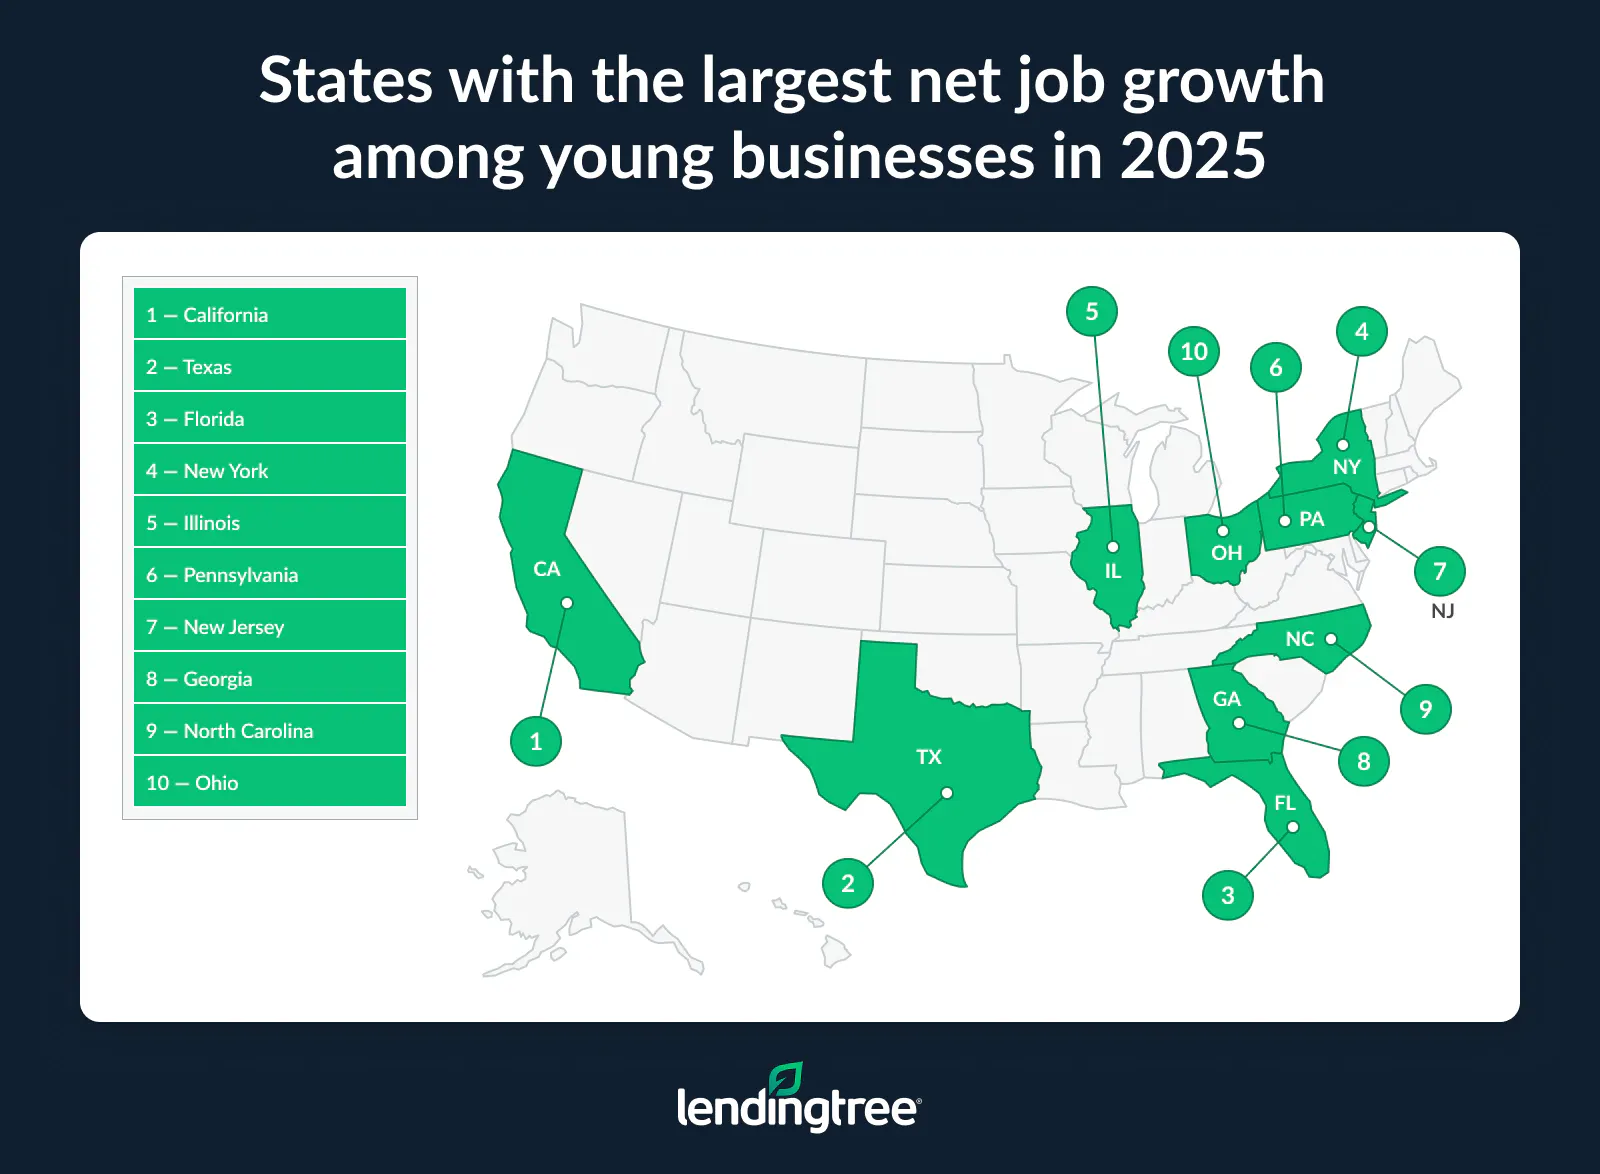
New York was fourth with 122,807 net jobs added by startups in 2025, but it was also one of just two states in which older businesses added more jobs than they lost. Older businesses in the Empire State added a net 65,931 jobs in 2025. Alaska was the only other state with a net job gain (1,151) among older businesses that year.
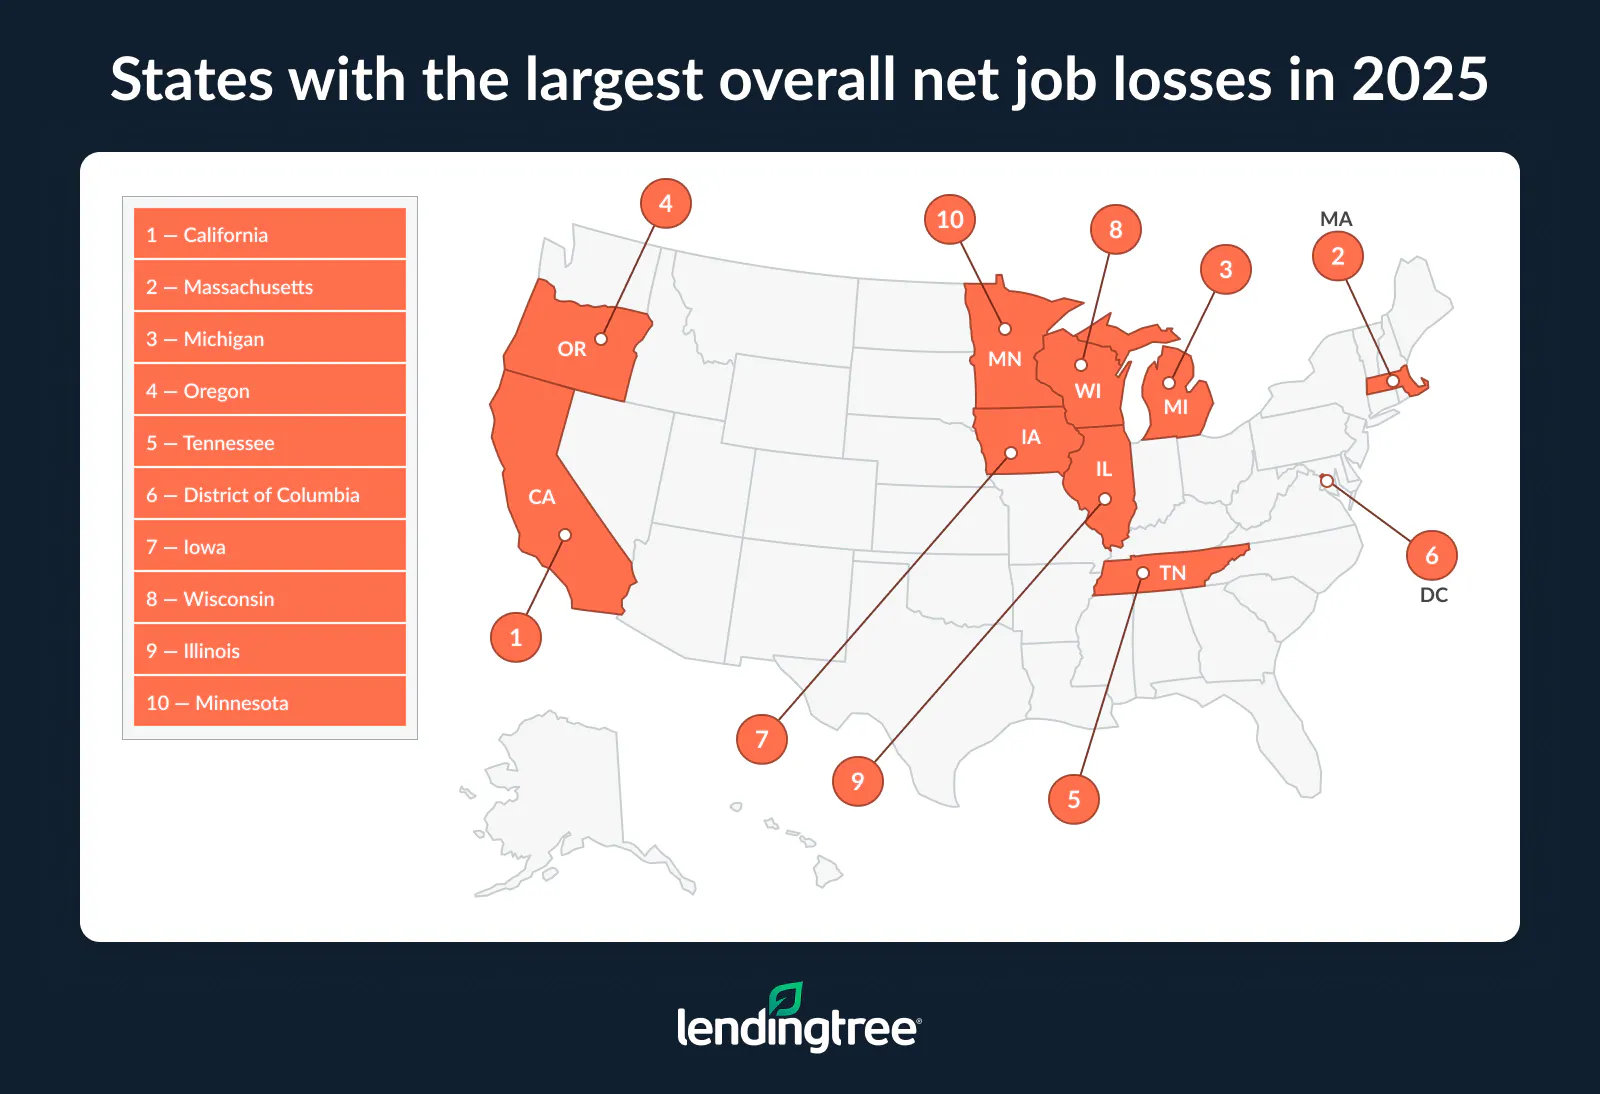
In 15 states, job losses among older businesses were enough to outweigh startup growth, resulting in an overall net loss of private-sector jobs for the year. California had the largest such loss. The Golden State had a net loss of 48,594 private-sector jobs as older businesses lost 305,534 jobs. Massachusetts (22,710 net jobs lost), Michigan (21,547) and Oregon (20,847) followed, though each had less than half as many net job losses as California.
Where young businesses contributed most to job growth in 2025
| Rank | State | Young-business net job change | Older-business net job change | Overall net job change |
|---|---|---|---|---|
| 1 | California | 256,940 | -305,534 | -48,594 |
| 2 | Texas | 177,423 | -27,029 | 150,394 |
| 3 | Florida | 153,448 | -43,743 | 109,705 |
| 4 | New York | 122,807 | 65,931 | 188,738 |
| 5 | Illinois | 57,720 | -62,020 | -4,300 |
| 6 | Pennsylvania | 57,166 | -27,152 | 30,014 |
| 7 | New Jersey | 56,817 | -20,778 | 36,039 |
| 8 | Georgia | 56,607 | -47,160 | 9,447 |
| 9 | North Carolina | 51,619 | -39,913 | 11,706 |
| 10 | Ohio | 50,523 | -41,856 | 8,667 |
| 11 | Washington | 45,386 | -19,294 | 26,092 |
| 12 | Virginia | 44,728 | -16,860 | 27,868 |
| 13 | Michigan | 44,001 | -65,548 | -21,547 |
| 14 | Maryland | 40,421 | -12,312 | 28,109 |
| 15 | Arizona | 39,949 | -20,913 | 19,036 |
| 16 | Colorado | 34,481 | -34,185 | 296 |
| 17 | South Carolina | 33,956 | -1,995 | 31,961 |
| 18 | Tennessee | 32,390 | -43,668 | -11,278 |
| 19 | Massachusetts | 30,817 | -53,527 | -22,710 |
| 20 | Missouri | 29,874 | -28,130 | 1,744 |
| 21 | Indiana | 26,407 | -19,089 | 7,318 |
| 22 | Minnesota | 26,140 | -28,975 | -2,835 |
| 23 | Utah | 23,774 | -8,341 | 15,433 |
| 24 | Alabama | 22,969 | -20,180 | 2,789 |
| 25 | Wisconsin | 21,662 | -26,509 | -4,847 |
| 26 | Kentucky | 21,456 | -22,969 | -1,513 |
| 27 | Oklahoma | 19,795 | -12,266 | 7,529 |
| 28 | Louisiana | 19,744 | -9,034 | 10,710 |
| 29 | Connecticut | 19,261 | -10,529 | 8,732 |
| 30 | Nevada | 17,704 | -12,965 | 4,739 |
| 31 | Oregon | 16,991 | -37,838 | -20,847 |
| 32 | Iowa | 13,246 | -21,202 | -7,956 |
| 33 | Idaho | 13,196 | -3,784 | 9,412 |
| 34 | Arkansas | 13,167 | -2,871 | 10,296 |
| 35 | Mississippi | 12,696 | -14,687 | -1,991 |
| 36 | Nebraska | 11,240 | -12,540 | -1,300 |
| 37 | Kansas | 11,001 | -1,002 | 9,999 |
| 38 | New Mexico | 9,578 | -6,938 | 2,640 |
| 39 | Maine | 6,945 | -4,039 | 2,906 |
| 40 | Montana | 6,410 | -3,296 | 3,114 |
| 41 | West Virginia | 6,018 | -1,966 | 4,052 |
| 42 | Rhode Island | 5,804 | -176 | 5,628 |
| 43 | Delaware | 5,687 | -3,029 | 2,658 |
| 44 | New Hampshire | 5,681 | -5,236 | 445 |
| 45 | Hawaii | 5,546 | -3,181 | 2,365 |
| 46 | District of Columbia | 4,754 | -13,959 | -9,205 |
| 47 | North Dakota | 4,417 | -3,392 | 1,025 |
| 48 | South Dakota | 4,363 | -3,405 | 958 |
| 49 | Alaska | 3,215 | 1,151 | 4,366 |
| 50 | Wyoming | 2,831 | -2,928 | -97 |
| 51 | Vermont | 2,740 | -4,024 | -1,284 |
Older businesses lost net jobs in most industries analyzed, while 2 industries dominated young-business job growth
Looking at job gains and losses across 11 industries, education and health services saw the biggest overall job growth in 2025, with a net gain of 810,309 jobs. Transportation and warehousing had the second-largest net gain at 126,229. Only two other industries — construction (90,151) and financial activities (17,349) — saw net job growth in 2025.
Net job growth was much less widespread among older businesses. In 2025, these firms gained more jobs than they lost in just two of the 11 industries analyzed. They added a net 415,163 jobs in education and health services and 71,138 in transportation and warehousing. In every other industry, older businesses saw net job losses, ranging from 45,625 in financial activities to 438,034 in leisure and hospitality.
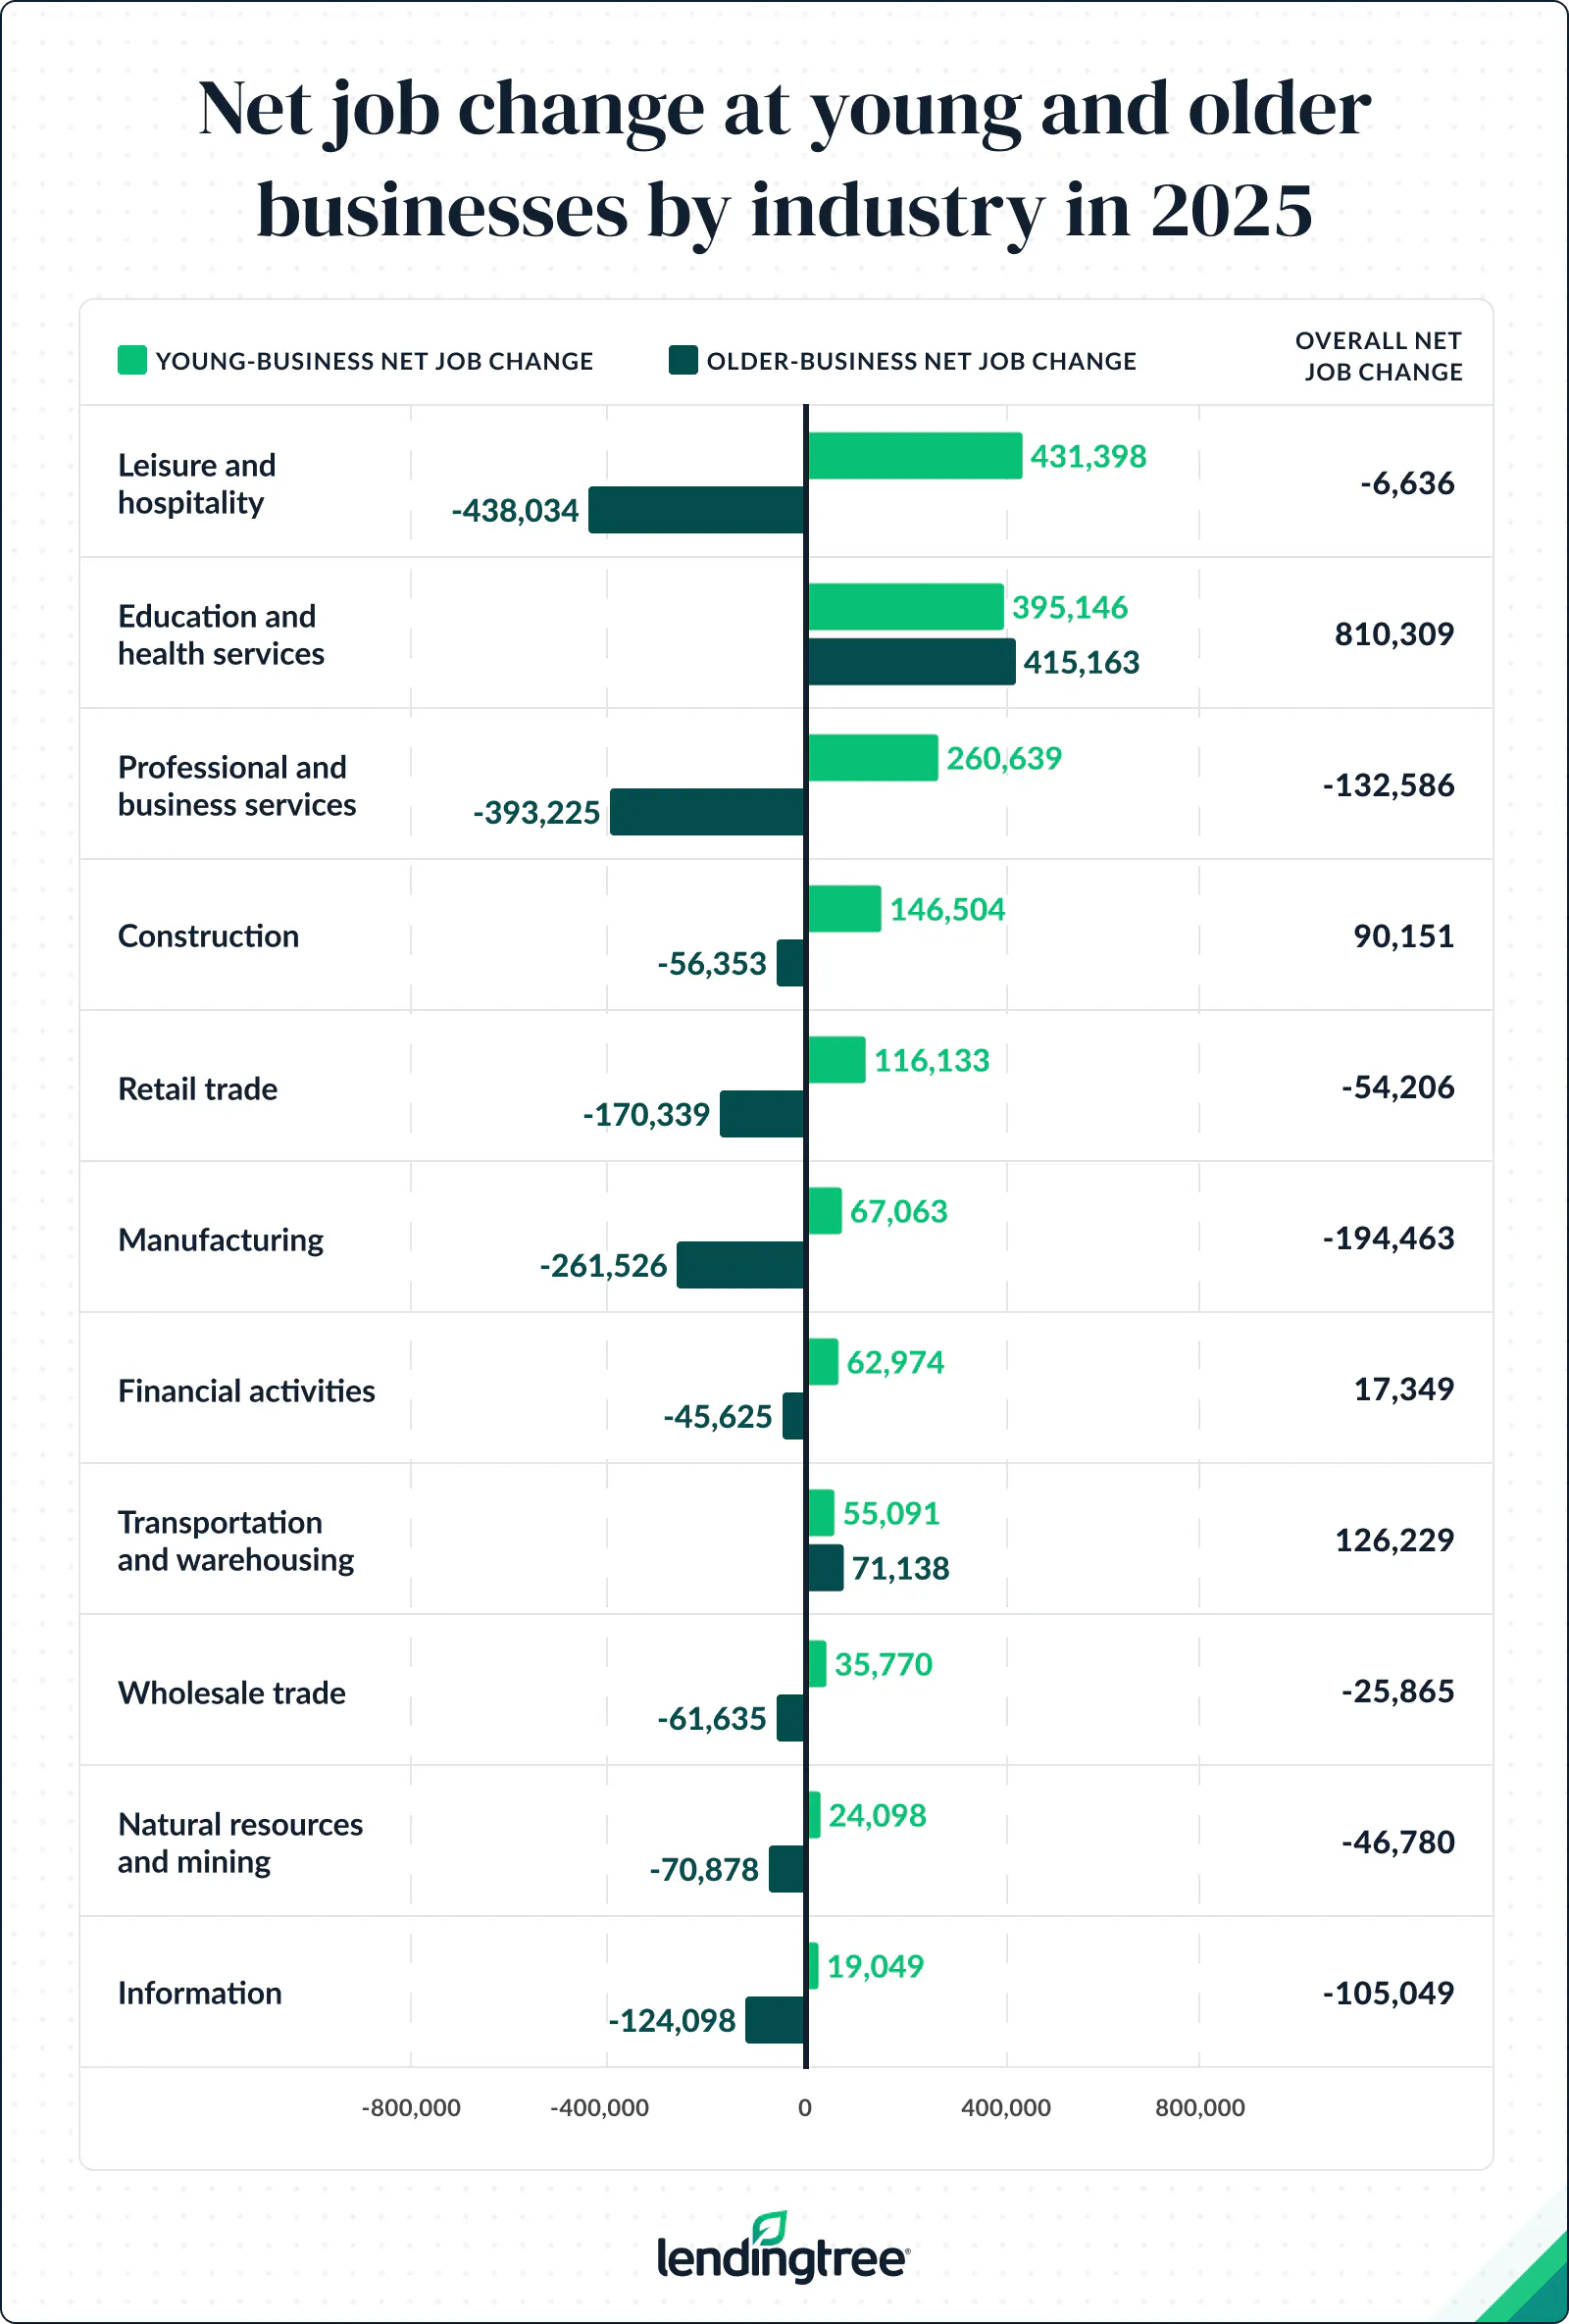
As the above graphic illustrates, young businesses saw net job gains in every industry we reviewed in 2025. Two stood above the rest, however.
Young businesses added a net 431,398 jobs in leisure and hospitality and 395,146 in education and health services in 2025. Startups saw net job growth of more than 100,000 in three other industries: professional and business services (260,639), construction (146,504) and retail trade (116,133).
Looking at startup growth by state, leisure and hospitality was the leading source of young-business job growth in 25 states and D.C. in 2025, while education and health services led in 24 states. (Utah was the only state where a different industry — professional and business services — topped the list.)
Which industries drive young-business net job gains in each state?
| State | Leading industry for young-business net jobs |
|---|---|
| Alabama | Leisure and hospitality |
| Alaska | Education and health services |
| Arizona | Education and health services |
| Arkansas | Leisure and hospitality |
| California | Leisure and hospitality |
| Colorado | Education and health services |
| Connecticut | Education and health services |
| Delaware | Education and health services |
| District of Columbia | Leisure and hospitality |
| Florida | Leisure and hospitality |
| Georgia | Leisure and hospitality |
| Hawaii | Leisure and hospitality |
| Idaho | Education and health services |
| Illinois | Leisure and hospitality |
| Indiana | Leisure and hospitality |
| Iowa | Leisure and hospitality |
| Kansas | Leisure and hospitality |
| Kentucky | Education and health services |
| Louisiana | Leisure and hospitality |
| Maine | Education and health services |
| Maryland | Leisure and hospitality |
| Massachusetts | Leisure and hospitality |
| Michigan | Leisure and hospitality |
| Minnesota | Education and health services |
| Mississippi | Leisure and hospitality |
| Missouri | Education and health services |
| Montana | Education and health services |
| Nebraska | Education and health services |
| Nevada | Education and health services |
| New Hampshire | Leisure and hospitality |
| New Jersey | Education and health services |
| New Mexico | Education and health services |
| New York | Leisure and hospitality |
| North Carolina | Leisure and hospitality |
| North Dakota | Education and health services |
| Ohio | Education and health services |
| Oklahoma | Leisure and hospitality |
| Oregon | Education and health services |
| Pennsylvania | Education and health services |
| Rhode Island | Education and health services |
| South Carolina | Education and health services |
| South Dakota | Leisure and hospitality |
| Tennessee | Leisure and hospitality |
| Texas | Leisure and hospitality |
| Utah | Professional and business services |
| Vermont | Leisure and hospitality |
| Virginia | Education and health services |
| Washington | Leisure and hospitality |
| West Virginia | Education and health services |
| Wisconsin | Education and health services |
| Wyoming | Leisure and hospitality |
3 things to consider before adding jobs at your small business
Hiring can be a sign that your small business is growing, but adding employees also brings new costs and responsibilities. Before expanding your staff, consider these steps:
- Look beyond the new employee’s salary. Wages are only part of the cost of hiring. Payroll taxes, benefits, insurance, equipment, training and other expenses can significantly increase the amount you’ll spend. Estimate the full cost of a new employee before deciding what your business can afford.
- Make sure your cash flow can support the added expense. A growing business can be profitable on paper and still struggle to cover payroll if customers pay slowly or revenue fluctuates. Consider how comfortably your business could continue paying a new employee during a slower-than-expected month or quarter.
- Consider whether hiring is the right solution. More business doesn’t always mean you need more employees. Depending on what’s creating the additional workload, overtime, automation, a contractor or a process change could help you handle it. If demand appears sustained and the work requires a permanent role, adding an employee may make more sense.
Whatever you decide, base the decision on the business you expect to have in the months ahead rather than solely on how busy you are today. A hiring plan that accounts for costs, cash flow and expected demand can help you grow without putting unnecessary pressure on your finances.
Methodology
LendingTree analyzed U.S. Bureau of Labor Statistics (BLS) Business Employment Dynamics data by firm age to examine how young businesses contribute to private-sector job growth. We calculated net job change for young businesses in all 50 states and the District of Columbia in 2025 and compared it with net job change among older businesses and the private sector overall. We also examined national trends from 2016 to 2025 and differences across major industries.
Throughout this study, we use “startups” and “young businesses” interchangeably to refer to firms less than 5 years old, combining BLS categories for firms less than 1 year old and firms 1 to 4 years old. Older businesses are firms 5 years old or older.
Net job change is calculated by subtracting gross job losses from gross job gains. Gross job gains represent jobs added by opening or expanding establishments, while gross job losses represent jobs lost through closing or contracting establishments. The 2025 figures reflect employment changes from March 2024 to March 2025.
Compare business loan offers