Want to Attend the World Cup Without Going Broke? Atlanta and Houston Are Your Best Bets
The men’s soccer World Cup is coming to the U.S. for the first time in 32 years, but attending a match in person will cost fans an average of more than $2,100 per person.
That staggering number, based on a LendingTree analysis of publicly available data, includes the cost of a match ticket, airfare, lodging, food and incidentals, and local transportation for one person attending any of the 52 group-stage matches in the U.S. this spring and summer.
Even at a time when the soaring cost of live events is making headlines, a $2,100 price tag stands out. The good news for fans determined to watch the world’s most popular sporting event in person is that prices vary widely depending on the location and teams involved. For example, attending a match in Atlanta costs nearly $1,400 less on average than attending one in the New York/New Jersey area, while Houston hosts the cheapest match overall among the 52 analyzed.
Here’s what else we found.
Our analysis covered 52 group-stage matches played across 11 U.S. host markets: Atlanta, Boston, Dallas, Houston, Kansas City, Mo., Los Angeles, Miami, New York/New Jersey, Philadelphia, the San Francisco Bay Area and Seattle. Twenty group-stage matches in Canada and Mexico were excluded to ensure apples-to-apples comparisons based on the same country, currency, travel environment and Bureau of Economic Analysis (BEA) cost-of-living framework.
The group stage is the opening round of the tournament, with 48 teams divided into groups of four to play a round-robin mini-tournament. Teams earn points based on wins and ties, and the top performers from each group advance to the single-elimination knockout stage. None of the knockout-round matches are included in our analysis.
- One-third of Americans plan to watch the World Cup this spring and summer, but interest varies sharply by generation. While 33% say they’ll watch at least some of the tournament, that share rises to 50% among Gen Zers and falls to 16% among baby boomers. Higher-income Americans are also more likely to say they plan to watch.
- If you’re attending an opening-round match, expect to spend more than $2,100 per person. Including a ticket, flight, hotel and other expenses, we estimate it would cost $2,152 on average to attend a World Cup group-stage match in the U.S. If you were really ambitious and able to clone yourself to attend all the group-stage matches in the U.S., it would cost you $111,907.
- New York/New Jersey is the most expensive host market, while Atlanta is the cheapest. According to our estimates, the average cost for one person to attend a group-stage match in the New York/New Jersey area would be $2,997. That’s 83% higher than the estimated average cost to attend a match in Atlanta, which comes in at $1,642.
- The single most affordable match to attend in the U.S.: Cabo Verde versus Saudi Arabia in Houston. After including the ticket, flight, hotel and other incidentals, we estimate it would cost $1,400 per person to attend if you purchased the least expensive ticket available. The priciest matches are projected to be Colombia versus Portugal in Miami ($4,031) and Brazil versus Morocco in New York/New Jersey ($3,571).
One-third of Americans plan to watch the World Cup, but interest varies sharply by generation
The World Cup is arguably the biggest sporting event in the world. The tournament was last held in the U.S. in 1994 — more than three decades ago. Since then, the sport’s popularity has grown significantly in this country. Soccer is reportedly the third most favored sport in the U.S., behind only football and basketball and ahead of baseball.
That popularity is reflected in our survey. One in 3 Americans say they plan to watch at least some of the tournament, which begins June 11 with group-stage matches. However, there’s a substantial generation gap. Half of Gen Zers ages 18 to 29 say they plan to watch, as do 44% of millennials ages 30 to 45. By comparison, just 25% of Gen Xers ages 46 to 61 and 16% of baby boomers ages 62 to 80 say they plan to tune in.
There’s also a substantial divide by income. More than half (53%) of Americans earning at least $100,000 annually say they plan to watch, compared with just 19% of those earning less than $30,000.
If you’re attending an opening-round match, expect to spend more than $2,100 per person
If you’re planning to watch a World Cup match in person, prepare for a significant expense.
LendingTree researchers analyzed the costs associated with attending a group-stage match. Including a ticket, airfare, hotel and other expenses, we found the average comes to $2,152 per person. For many households, that kind of price tag could put attending out of reach — especially for families traveling together who may need to pay several times that amount.
If you somehow perfected cloning technology and were able to attend all 52 group-stage matches in the U.S. — even the ones that are happening simultaneously in different parts of the country — we estimate the total cost would reach $111,907.
New York/New Jersey is the most expensive host market, while Atlanta is the cheapest
If you have your heart set on attending a World Cup match in person and you’re trying to keep costs down, flexibility is key. Of course, the teams and players matter a great deal — if Lionel Messi or Cristiano Ronaldo is involved, you’re likely to pay a premium — but the host city matters a lot, too.
Our analysis estimates that the average per-person cost to attend a group-stage match in New York/New Jersey would be $2,997 — 83% higher than the estimated $1,642 average cost in Atlanta, the least expensive World Cup host city in the U.S. Neither option is cheap, but Atlanta’s price tag is far more attainable for many Americans.
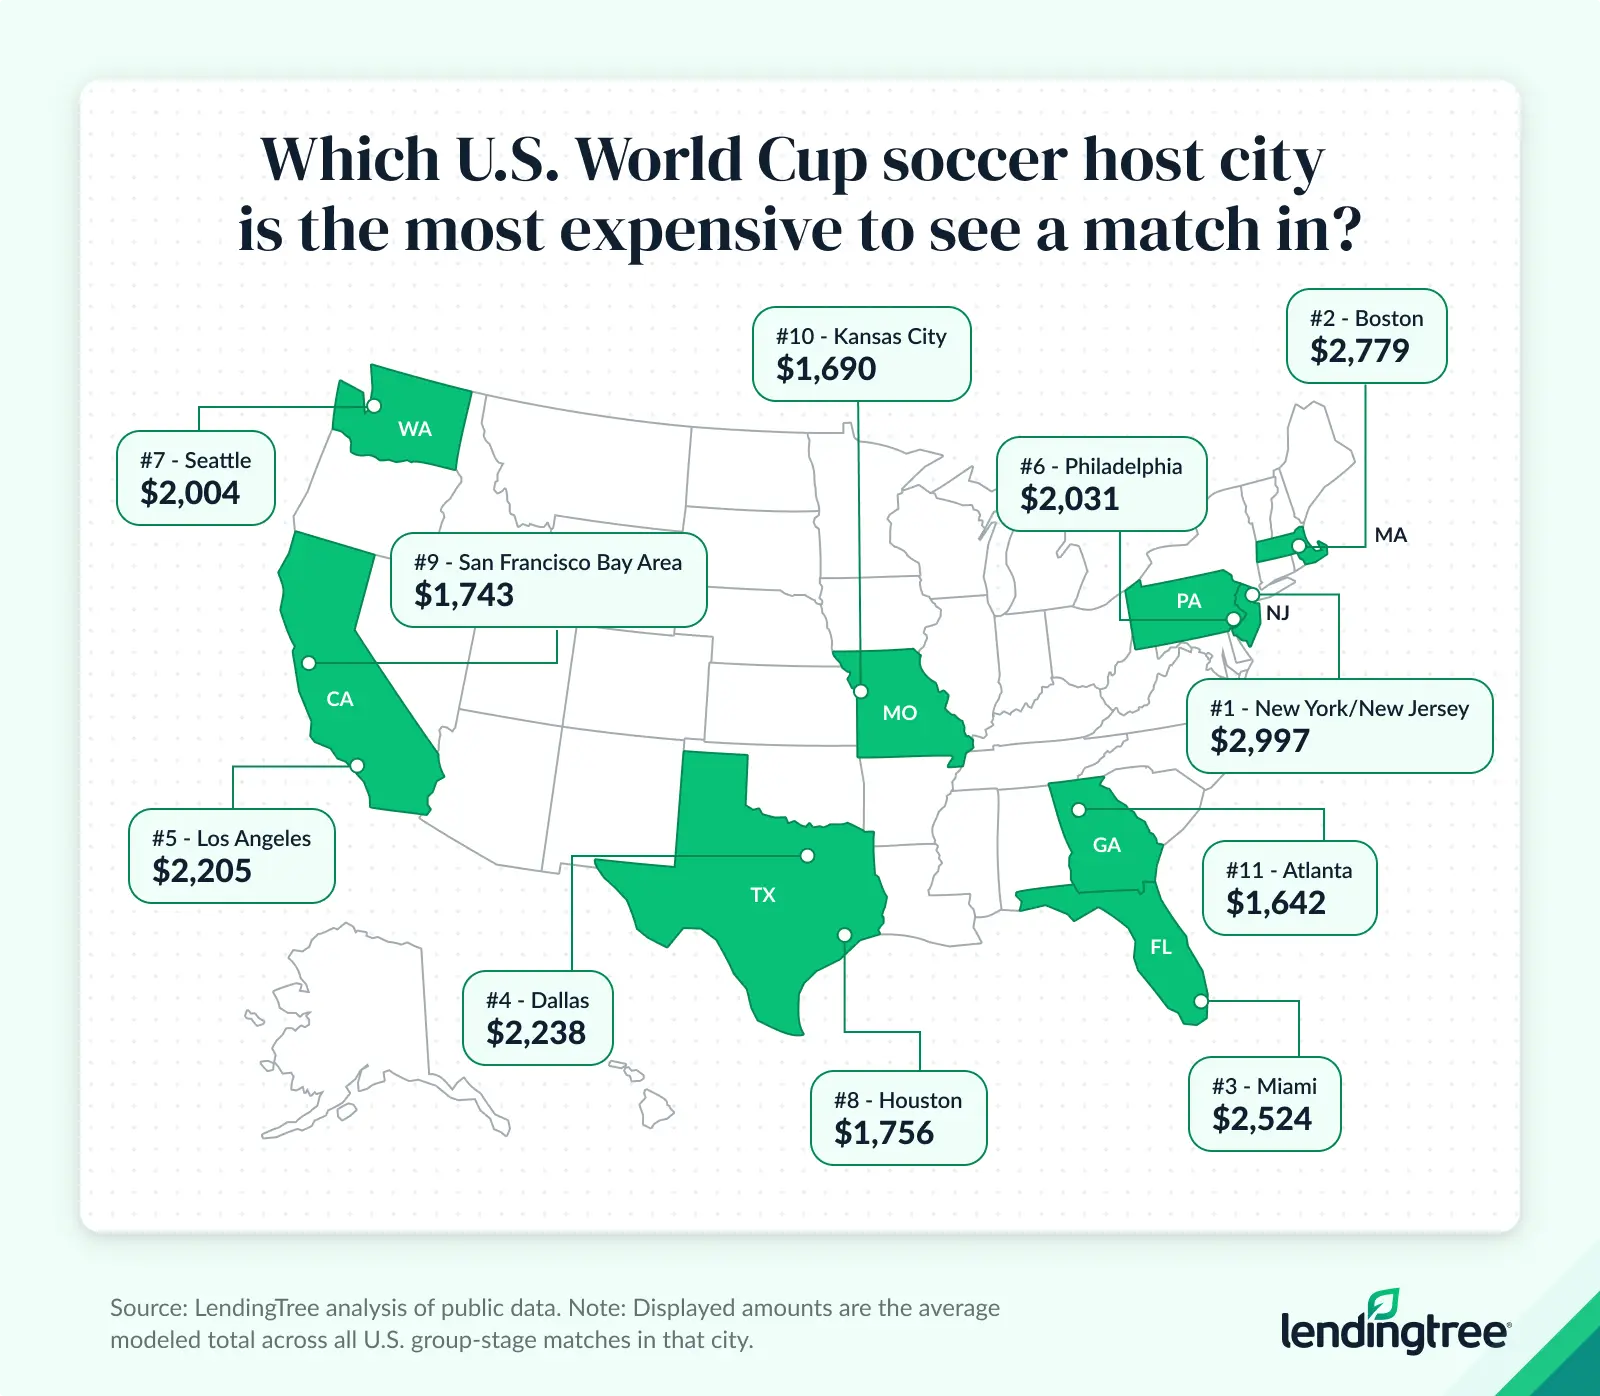
We estimate the average cost of attendance will exceed $2,500 per person in three U.S. host cities: New York/New Jersey ($2,997), Boston ($2,779) and Miami ($2,524). Meanwhile, Atlanta and three other host cities — Kansas City, Mo., the San Francisco Bay Area and Houston — all have estimated average attendance costs of $1,756 or less.
Cost to attend World Cup group-stage matches in each U.S. host city
| Rank | Host city | Avg. cost |
|---|---|---|
| 1 | New York/New Jersey | $2,997 |
| 2 | Boston | $2,779 |
| 3 | Miami | $2,524 |
| 4 | Dallas | $2,238 |
| 5 | Los Angeles | $2,205 |
| 6 | Philadelphia | $2,031 |
| 7 | Seattle | $2,004 |
| 8 | Houston | $1,756 |
| 9 | San Francisco Bay Area | $1,743 |
| 10 | Kansas City | $1,690 |
| 11 | Atlanta | $1,642 |
The single most affordable match to attend in the U.S.: Cabo Verde vs. Saudi Arabia in Houston
When it comes to keeping your World Cup attendance costs down, where the match is played is only part of the equation. Fans willing to be flexible about which teams they see can also find relative bargains.
For example, the most expensive matches to attend in the U.S. are star-studded affairs: Watching James Rodriguez and Colombia versus Cristiano Ronaldo and Portugal in Miami will set you back an estimated $4,031 per person, while seeing Neymar and Brazil versus Achraf Hakimi and Morocco in New York/New Jersey will cost $3,571 per person. Other high-priced matches include traditional soccer powers such as Germany, France and England, whose rosters are loaded with international stars.
On the other end, watching Cabo Verde take on Saudi Arabia in Houston will cost a relatively modest $1,400, seeing Algeria battle Austria in Kansas City will cost $1,474 and checking out the Democratic Republic of the Congo versus Uzbekistan in Atlanta will cost $1,495.
Estimated cost to attend each World Cup group-stage match played in the U.S.
| Rank | Location | Match | Estimate |
|---|---|---|---|
| 1 | Houston | Cabo Verde vs. Saudi Arabia | $1,400 |
| 2 | Kansas City | Algeria vs. Austria | $1,474 |
| 3 | Atlanta | Democratic Republic of the Congo vs. Uzbekistan | $1,495 |
| 4 | Atlanta | Czechia vs. South Africa | $1,520 |
| 5 | Atlanta | Morocco vs. Haiti | $1,583 |
| 6 | Miami | Uruguay vs. Cabo Verde | $1,584 |
| 7 | Kansas City | Tunisia vs. Netherlands | $1,589 |
| 8 | Kansas City | Ecuador vs. Curaçao | $1,601 |
| 9 | Miami | Saudi Arabia vs. Uruguay | $1,646 |
| 10 | Philadelphia | Curaçao vs. Côte d’Ivoire | $1,680 |
| 11 | San Francisco Bay Area | Jordan vs. Algeria | $1,681 |
| 12 | San Francisco Bay Area | Austria vs. Jordan | $1,689 |
| 13 | Houston | Germany vs. Curaçao | $1,724 |
| 14 | Atlanta | Spain vs. Cabo Verde | $1,726 |
| 15 | Seattle | Bosnia and Herzegovina vs. Qatar | $1,753 |
| 16 | San Francisco Bay Area | Qatar vs. Switzerland | $1,758 |
| 17 | Seattle | Egypt vs. Iran | $1,769 |
| 18 | San Francisco Bay Area | Paraguay vs. Australia | $1,786 |
| 19 | San Francisco Bay Area | Turkey vs. Paraguay | $1,803 |
| 20 | Houston | Netherlands vs. Sweden | $1,804 |
| 21 | Dallas | Japan vs. Sweden | $1,819 |
| 22 | Houston | Portugal vs. Democratic Republic of the Congo | $1,869 |
| 23 | Atlanta | Spain vs. Saudi Arabia | $1,885 |
| 24 | Philadelphia | France vs. Iraq | $1,909 |
| 25 | Los Angeles | Iran vs. New Zealand | $1,941 |
| 26 | Philadelphia | Croatia vs. Ghana | $1,974 |
| 27 | Houston | Portugal vs. Uzbekistan | $1,981 |
| 28 | Seattle | Belgium vs. Egypt | $1,983 |
| 29 | Los Angeles | Switzerland vs. Bosnia and Herzegovina | $2,000 |
| 30 | Los Angeles | Belgium vs. Iran | $2,019 |
| 31 | Kansas City | Argentina vs. Algeria | $2,097 |
| 32 | Philadelphia | Côte d’Ivoire vs. Ecuador | $2,196 |
| 33 | Dallas | Netherlands vs. Japan | $2,199 |
| 34 | Dallas | Jordan vs. Argentina | $2,260 |
| 35 | Dallas | England vs. Croatia | $2,360 |
| 36 | Philadelphia | Brazil vs. Haiti | $2,398 |
| 37 | Los Angeles | Turkey vs. USA | $2,422 |
| 38 | Boston | Iraq vs. Norway | $2,465 |
| 39 | Seattle | USA vs. Australia | $2,510 |
| 40 | Dallas | Argentina vs. Austria | $2,551 |
| 41 | New York/New Jersey | Norway vs. Senegal | $2,587 |
| 42 | Los Angeles | USA vs. Paraguay | $2,646 |
| 43 | Boston | Haiti vs. Scotland | $2,781 |
| 44 | Boston | Scotland vs. Morocco | $2,829 |
| 45 | Miami | Scotland vs. Brazil | $2,834 |
| 46 | New York/New Jersey | Panama vs. England | $2,860 |
| 47 | Boston | England vs. Ghana | $2,866 |
| 48 | New York/New Jersey | France vs. Senegal | $2,883 |
| 49 | Boston | Norway vs. France | $2,955 |
| 50 | New York/New Jersey | Ecuador vs. Germany | $3,083 |
| 51 | New York/New Jersey | Brazil vs. Morocco | $3,571 |
| 52 | Miami | Colombia vs. Portugal | $4,031 |
Here’s how to enjoy the World Cup for less
For many fans, attending a World Cup match in person simply won’t be realistic. Between ticket prices, airfare and hotel costs, our analysis shows that even the cheapest matches can require a four-figure investment per person.
Still, that doesn’t mean fans have to miss out on the excitement. Whether you’re determined to see a match in person or planning to enjoy the tournament from your couch, there are ways to stretch your budget and make the most of the experience.
Here are a few ways to keep World Cup costs under control or level up your at-home viewing experience without blowing your budget.
- Book travel and lodging early. Hotel and airfare prices often rise sharply as major events approach. Reserving flights and accommodations well in advance can help you avoid the last-minute surge that frequently accompanies marquee sporting events.
- Consider staying outside the host city. Hotels closest to stadiums tend to be the most expensive. Staying in nearby suburbs or smaller neighboring cities, especially those connected by public transit, can significantly reduce lodging costs.
- Travel with a group. Splitting hotel rooms, rental cars and even rideshares with friends or family can meaningfully reduce per-person costs.
- Set a firm budget before buying tickets. It’s easy to get caught up in the excitement of a once-in-a-generation event. Deciding ahead of time how much you can realistically afford to spend may help prevent financial regret after the tournament.
- If attending isn’t realistic, create a memorable watch-party experience at home. Hosting friends for a match, cooking food inspired by the competing countries or decorating your space can recreate some of the communal excitement of the tournament for a fraction of the price.
- Take advantage of free and low-cost viewing options. Many bars, restaurants and public venues will show matches throughout the tournament. Watching in a lively environment can deliver much of the atmosphere of a live sporting event without the travel costs.
Methodology
To find the most affordable matches to attend the World Cup, analysts used the following cost model to calculate estimated match costs:
- SeatGeek “from” (or lowest) ticket price
- Estimated airfare
- Hotel nightly rate times two
- Food and incidental costs (adjusted for local cost-of-living differences) per day times three
- Estimated ground transportation to the stadium on match day
The model assumes one attendee per trip.
Here’s how we determined each individual cost:
- Ticket price estimates: Ticket estimates were calculated using SeatGeek “from” (or lowest) prices for each individual match. These are resale-market indicators intended to approximate the cheapest available ticket listed for that match at the time of research.
- Airfare costs: Intercity travel was modeled using airfare defaults derived from Bureau of Transportation Statistics (BTS) domestic airfare data. The BTS states that average fares are based on domestic itinerary fares — generally round-trips unless the customer didn’t purchase a return trip — and include taxes and fees required at the time of the ticket purchase but exclude optional services such as baggage fees.
- Lodging estimates: The baseline structure assumes a short trip — generally arriving before the match and leaving after the match. We assumed the attendee would stay in the hotel for two nights.
- Food and incidentals: We assumed daily spending of $90 for food and $140 for other incidentals. Food and incidentals were adjusted for local cost differences using BEA regional price parities (RPPs) where available. That means, for example, that those attending matches in Kansas City would be assumed to have lower daily spending on food and incidentals than those in New York/New Jersey.
- Local ground transportation costs: Each host city includes an estimate for getting from a central city location to the stadium and back. The local transfer cost is intended to represent a reasonable public transit, shuttle or planned matchday transportation option where available.
Additionally, LendingTree commissioned QuestionPro to conduct an online survey of 2,000 U.S. consumers ages 18 to 80 from May 4 to 6, 2026. The survey was administered using a nonprobability-based sample, and quotas were used to ensure the sample base represented the overall population. Researchers reviewed all responses for quality control.
We defined generations as the following ages in 2026:
- Generation Z: 18 to 29
- Millennials: 30 to 45
- Generation X: 46 to 61
- Baby boomers: 62 to 80
Get debt consolidation loan offers from up to 5 lenders in minutes