Home Insurance Takes Up Nearly a Fifth of Monthly Housing Costs in Some States


Buying a home comes with plenty of expenses beyond a monthly mortgage payment. Property taxes, maintenance costs and homeowners insurance all play a role in the true cost of homeownership. In particular, insurance has become an increasingly significant piece of the puzzle in many parts of the country as premiums continue to rise.
A LendingTree analysis found that home insurance makes up 8.5% of the typical monthly housing costs for homeowners with a mortgage nationwide. In some states, however, that share is much higher. In Nebraska, for instance, nearly 1 in every 5 dollars that homeowners spend on monthly housing costs goes toward insurance, highlighting how weather risks and rising claims costs continue to reshape housing affordability across the country.
- Nationally, home insurance accounts for 8.5% of typical monthly housing costs for homeowners with a mortgage. That works out to an estimated $200 a month in home insurance as part of an estimated total monthly housing cost of $2,354.
- Home insurance takes up nearly a fifth of monthly housing costs in the highest-burden states. In Nebraska, home insurance accounts for 19.4% of total monthly housing costs, followed by Oklahoma at 17.6% and Texas at 14.4%. Overall, home insurance takes up at least 10.0% of monthly housing costs in 20 states.
- In several states, insurance costs exceed or rival property taxes. Tennessee has the highest insurance-to-property tax ratio at 1.99, meaning estimated monthly home insurance costs of $284 are nearly double the state’s estimated monthly property taxes of $143. Alabama follows with a ratio of 1.96.
- Colorado has the highest home insurance premiums. The state’s annual premiums are $5,553, or $463 a month, though that represents 13.3% of monthly housing costs because Colorado’s total monthly housing cost is also relatively high at $3,485.
Home insurance accounts for 8.5% of typical monthly housing costs nationally
For homeowners with a mortgage, housing costs reach far beyond monthly principal and interest payments alone. Nationwide, the typical homeowner spends an estimated $1,843 a month on mortgage payments, $311 on property taxes and $200 on home insurance, for a total monthly housing cost of $2,354. Home insurance specifically accounts for 8.5% of the average monthly housing budget.
Home insurance share of monthly housing costs (nationally)
| Estimated monthly mortgage payment | $1,843 |
| Estimated monthly property tax | $311 |
| Estimated monthly home insurance | $200 |
| Estimated total monthly housing cost | $2,354 |
| Home insurance share of monthly housing cost | 8.5% |
The analysis compares three major housing expenses that homeowners typically pay each month: mortgage payments, property taxes and home insurance premiums. From there, LendingTree calculated how much of the average monthly housing budget goes toward insurance.
Several factors have pushed homeowners insurance rates higher in recent years. More frequent and costly severe weather events have increased insurer losses, while inflation has raised the costs of building materials, labor and home repairs.
There may be signs that home insurance costs are beginning to stabilize, however. “After double-digit increases in 2023 and 2024, rates only grew by 6% last year,” says Rob Bhatt, LendingTree insurance analyst and licensed insurance agent.
Home insurance consumes the largest share of housing costs in Nebraska, Oklahoma and Texas
Home insurance accounts for nearly one-fifth of monthly housing costs in Nebraska — the highest share among all states. Homeowners there spend an estimated $413 a month on insurance, which represents 19.4% of total monthly housing costs. Oklahoma ranks second at 17.6%, followed by Texas at 14.4%.
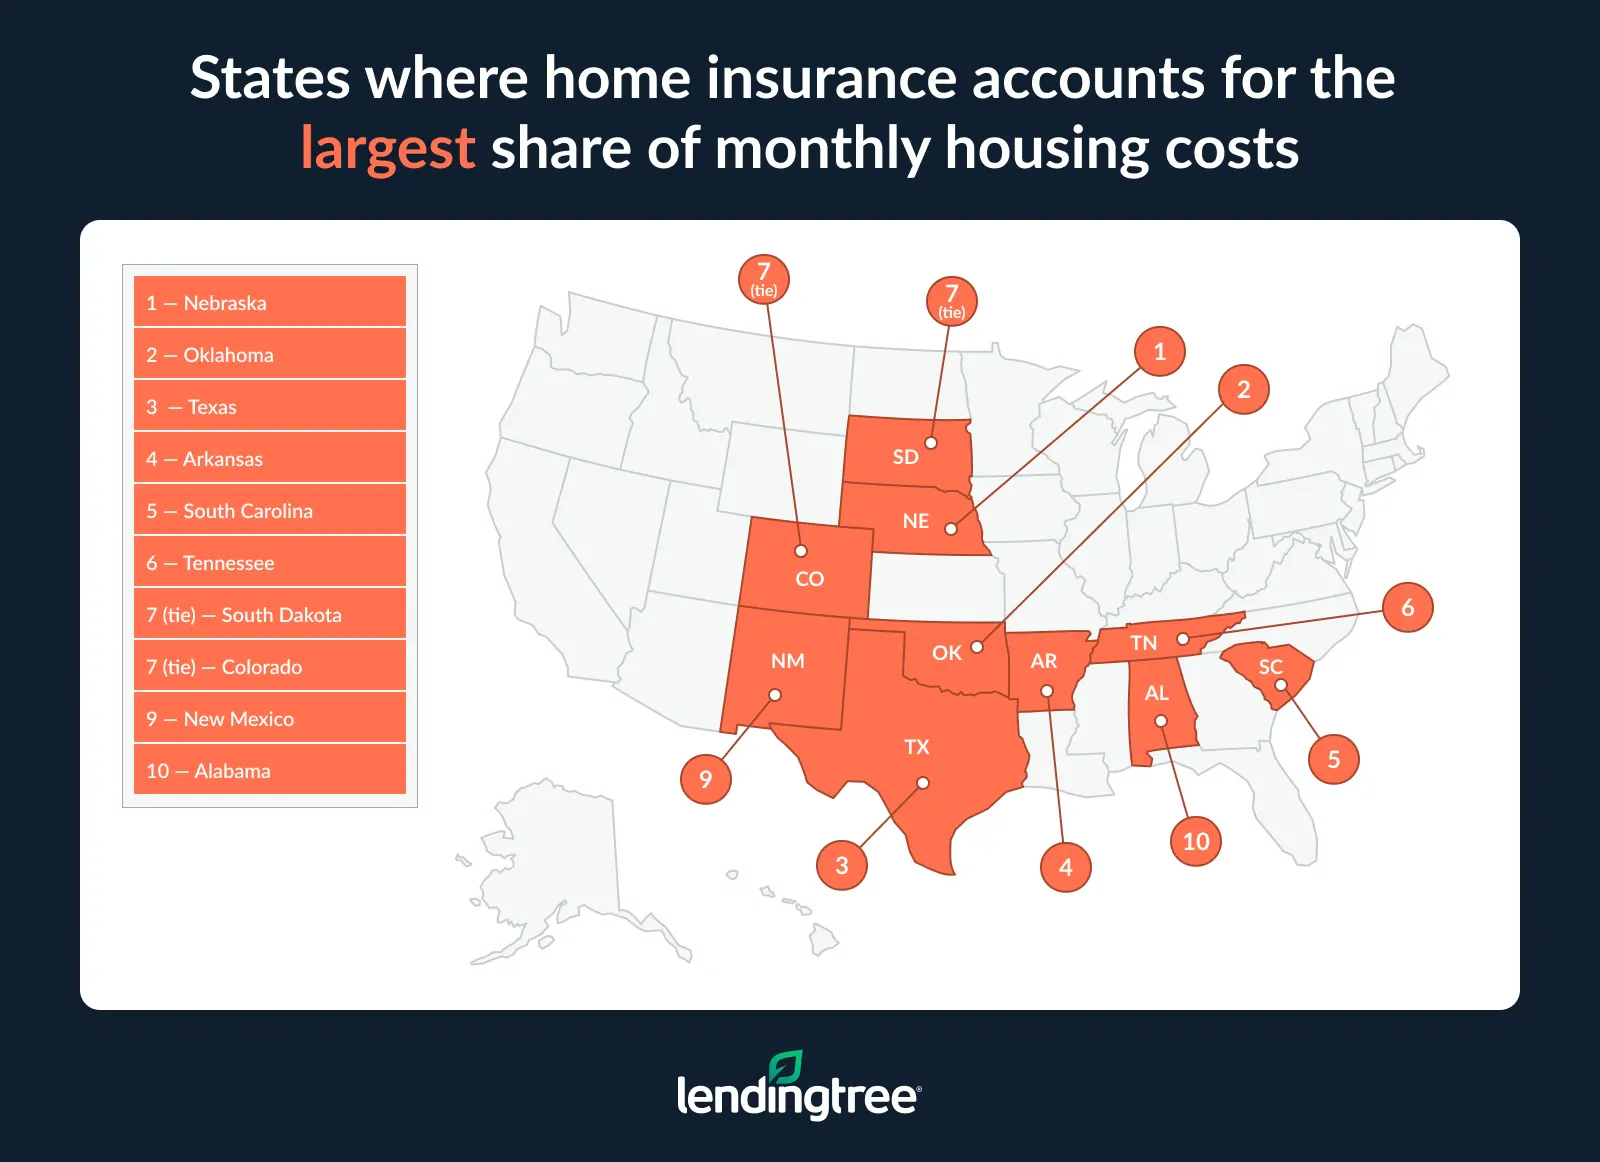
Weather risk helps explain why these states rank near the top. Homeowners in Nebraska, Oklahoma and Texas all face frequent hailstorms, thunderstorms and tornadoes that can lead to expensive insurance claims.
“Nebraska, Oklahoma and Texas all have severe wind and hail risks, and Texas homeowners face additional threats from hurricanes and even wildfires, depending on their location,” Bhatt says. “Insurance companies in these states have priced the potential costs of these types of disasters into their rates.”
However, Bhatt notes, weather risk alone doesn’t always determine what homeowners pay for coverage. “There are other states with severe weather risks that have lower home insurance rates. Insurance is generally regulated at the state level. It’s important for leaders in each state to protect their residents with policies that help make or keep home insurance affordable.”
The picture looks very different at the other end of the rankings. In Hawaii, for example, home insurance makes up just 2.1% of monthly housing costs, while Vermont ranks second-lowest at 3.2%. Homeowners in those states generally pay less for insurance, and higher overall housing costs can make insurance a smaller piece of the overall monthly budget.
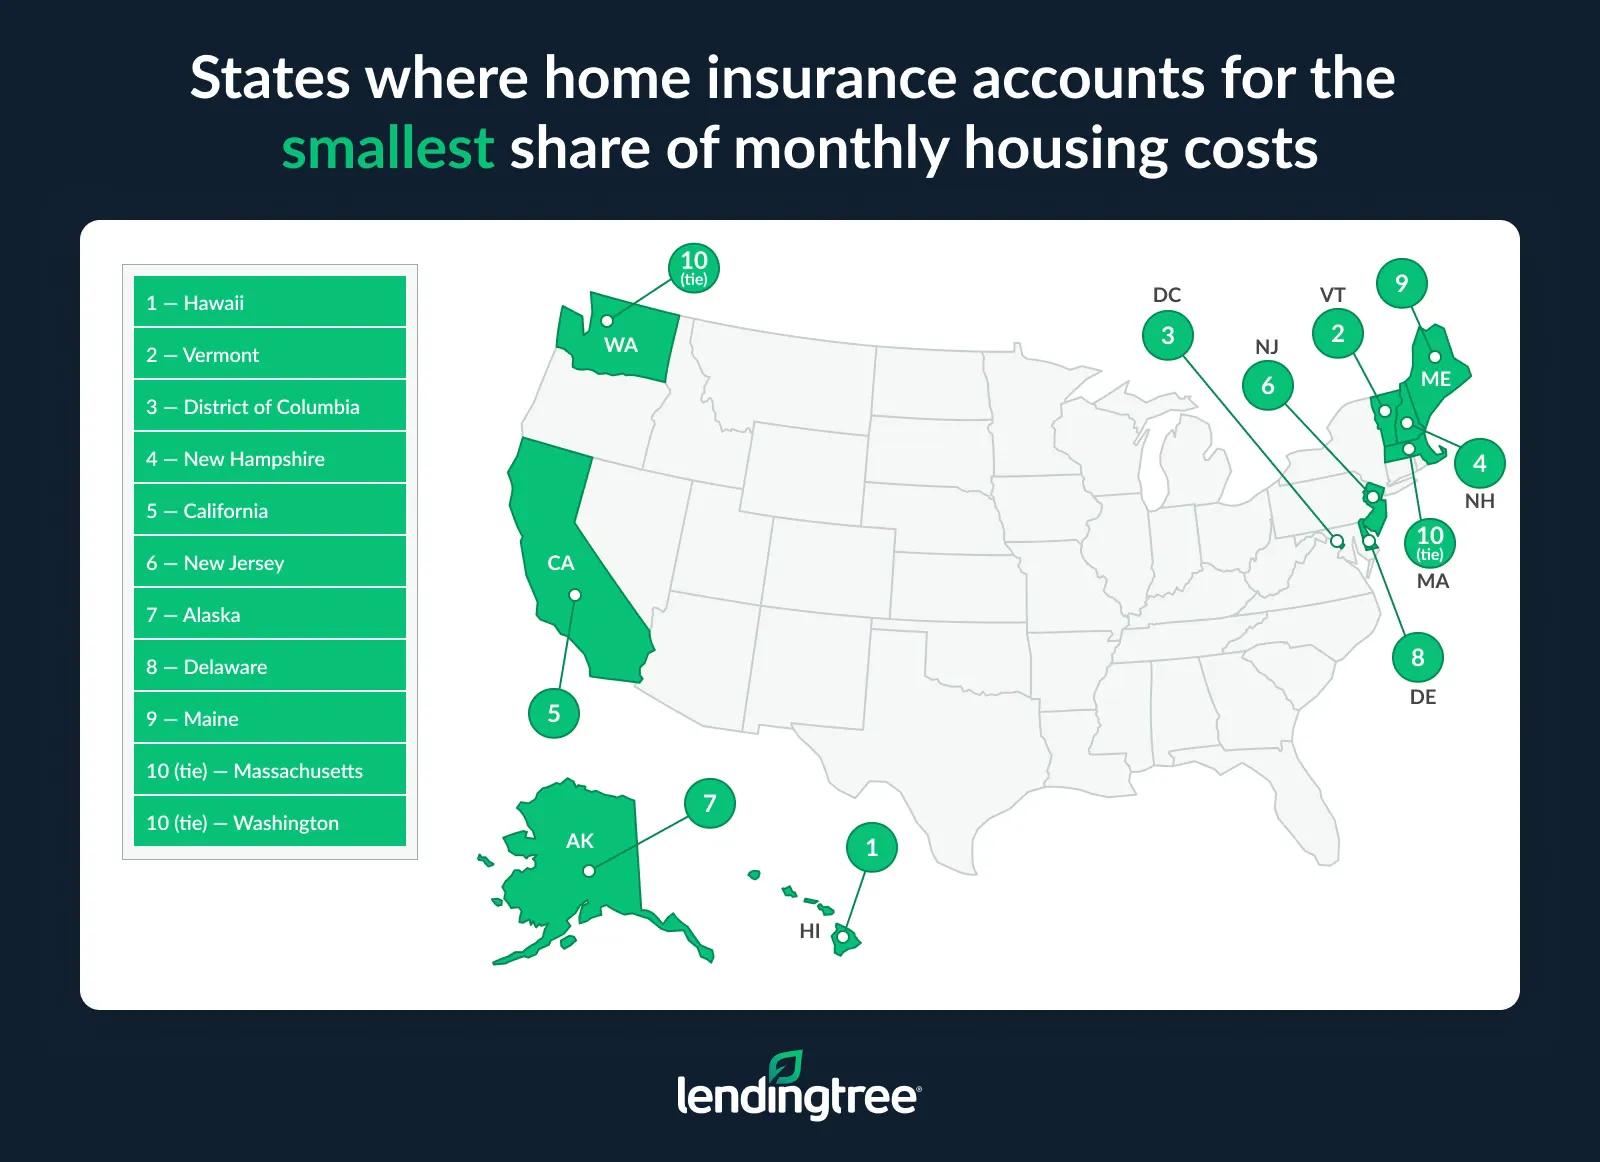
Full rankings: Home insurance share of monthly housing costs (by state)
| Rank | State | Estimated monthly mortgage payment | Estimated monthly property tax | Estimated monthly home insurance | Estimated total monthly housing cost | Home insurance share of monthly housing cost |
|---|---|---|---|---|---|---|
| 1 | Nebraska | $1,365 | $350 | $413 | $2,128 | 19.4% |
| 2 | Oklahoma | $1,125 | $178 | $278 | $1,581 | 17.6% |
| 3 | Texas | $1,531 | $438 | $331 | $2,300 | 14.4% |
| 4 | Arkansas | $1,114 | $115 | $200 | $1,429 | 14.0% |
| 5 | South Carolina | $1,529 | $135 | $259 | $1,923 | 13.5% |
| 6 | Tennessee | $1,691 | $143 | $284 | $2,118 | 13.4% |
| 7 | South Dakota | $1,487 | $281 | $272 | $2,040 | 13.3% |
| 7 | Colorado | $2,781 | $241 | $463 | $3,485 | 13.3% |
| 9 | New Mexico | $1,445 | $189 | $244 | $1,878 | 13.0% |
| 10 | Alabama | $1,200 | $93 | $182 | $1,475 | 12.3% |
| 11 | Kansas | $1,248 | $296 | $215 | $1,759 | 12.2% |
| 12 | Kentucky | $1,188 | $167 | $186 | $1,541 | 12.1% |
| 13 | Mississippi | $969 | $131 | $149 | $1,249 | 11.9% |
| 14 | North Dakota | $1,405 | $264 | $205 | $1,874 | 10.9% |
| 15 | Iowa | $1,181 | $275 | $172 | $1,628 | 10.6% |
| 15 | Virginia | $2,111 | $276 | $283 | $2,670 | 10.6% |
| 17 | North Carolina | $1,677 | $196 | $214 | $2,087 | 10.3% |
| 18 | West Virginia | $899 | $101 | $113 | $1,113 | 10.2% |
| 19 | Montana | $2,127 | $267 | $268 | $2,662 | 10.1% |
| 20 | Georgia | $1,728 | $253 | $220 | $2,201 | 10.0% |
| 21 | Minnesota | $1,778 | $317 | $231 | $2,326 | 9.9% |
| 21 | Illinois | $1,532 | $547 | $228 | $2,307 | 9.9% |
| 23 | Louisiana | $1,129 | $125 | $132 | $1,386 | 9.5% |
| 23 | Arizona | $2,113 | $162 | $238 | $2,513 | 9.5% |
| 25 | Indiana | $1,276 | $168 | $147 | $1,591 | 9.2% |
| 25 | Florida | $1,931 | $277 | $224 | $2,432 | 9.2% |
| 27 | Maryland | $2,208 | $366 | $251 | $2,825 | 8.9% |
| 27 | Missouri | $1,331 | $200 | $149 | $1,680 | 8.9% |
| 29 | Connecticut | $2,148 | $615 | $263 | $3,026 | 8.7% |
| 30 | Wyoming | $1,721 | $176 | $175 | $2,072 | 8.4% |
| 31 | Rhode Island | $2,382 | $443 | $235 | $3,060 | 7.7% |
| 32 | Idaho | $2,290 | $169 | $200 | $2,659 | 7.5% |
| 33 | Pennsylvania | $1,470 | $321 | $143 | $1,934 | 7.4% |
| 34 | Ohio | $1,272 | $284 | $117 | $1,673 | 7.0% |
| 35 | Michigan | $1,343 | $293 | $122 | $1,758 | 6.9% |
| 35 | Nevada | $2,306 | $191 | $185 | $2,682 | 6.9% |
| 37 | Wisconsin | $1,575 | $345 | $140 | $2,060 | 6.8% |
| 38 | Utah | $2,739 | $225 | $184 | $3,148 | 5.8% |
| 39 | New York | $2,409 | $626 | $168 | $3,203 | 5.2% |
| 40 | Oregon | $2,470 | $339 | $152 | $2,961 | 5.1% |
| 41 | Washington | $3,010 | $409 | $178 | $3,597 | 4.9% |
| 41 | Massachusetts | $3,149 | $536 | $189 | $3,874 | 4.9% |
| 43 | Maine | $1,807 | $298 | $107 | $2,212 | 4.8% |
| 44 | Delaware | $1,872 | $159 | $97 | $2,128 | 4.6% |
| 45 | Alaska | $2,011 | $374 | $113 | $2,498 | 4.5% |
| 46 | New Jersey | $2,670 | $863 | $159 | $3,692 | 4.3% |
| 47 | California | $3,741 | $508 | $170 | $4,419 | 3.8% |
| 48 | New Hampshire | $2,400 | $614 | $114 | $3,128 | 3.6% |
| 49 | District of Columbia | $3,565 | $392 | $145 | $4,102 | 3.5% |
| 50 | Vermont | $1,843 | $467 | $77 | $2,387 | 3.2% |
| 51 | Hawaii | $4,326 | $198 | $95 | $4,619 | 2.1% |
In some states, insurance costs exceed or rival property taxes
Many homeowners expect property taxes to be one of the highest costs of owning a home. In some states, however, homeowners now spend just as much on insurance coverage — and sometimes more.
Tennessee leads the way. The typical homeowner in the Volunteer State spends an estimated $284 a month on insurance, nearly double the state’s estimated monthly property tax bill of $143. Alabama ranks second, with homeowners spending an estimated $182 a month on insurance and $93 on property taxes.
Tennessee and Alabama aren’t alone. Homeowners in 13 other states also spend more on insurance than on property taxes:
- Colorado
- South Carolina
- Arkansas
- Oklahoma
- Arizona
- New Mexico
- Idaho
- Nebraska
- Mississippi
- West Virginia
- Kentucky
- North Carolina
- Louisiana
Meanwhile, homeowners in Virginia and Montana spend about the same amount on insurance as they do on property taxes.
Full rankings: States with the highest insurance-to-property tax ratios
| Rank | State | Estimated monthly home insurance | Estimated monthly property tax | Insurance-to-property tax ratio |
|---|---|---|---|---|
| 1 | Tennessee | $284 | $143 | 1.99 |
| 2 | Alabama | $182 | $93 | 1.96 |
| 3 | Colorado | $463 | $241 | 1.92 |
| 3 | South Carolina | $259 | $135 | 1.92 |
| 5 | Arkansas | $200 | $115 | 1.74 |
| 6 | Oklahoma | $278 | $178 | 1.56 |
| 7 | Arizona | $238 | $162 | 1.47 |
| 8 | New Mexico | $244 | $189 | 1.29 |
| 9 | Idaho | $200 | $169 | 1.18 |
| 9 | Nebraska | $413 | $350 | 1.18 |
| 11 | Mississippi | $149 | $131 | 1.14 |
| 12 | West Virginia | $113 | $101 | 1.12 |
| 13 | Kentucky | $186 | $167 | 1.11 |
| 14 | North Carolina | $214 | $196 | 1.09 |
| 15 | Louisiana | $132 | $125 | 1.06 |
| 16 | Virginia | $283 | $276 | 1.03 |
| 17 | Montana | $268 | $267 | 1.00 |
| 18 | Wyoming | $175 | $176 | 0.99 |
| 19 | South Dakota | $272 | $281 | 0.97 |
| 19 | Nevada | $185 | $191 | 0.97 |
| 21 | Indiana | $147 | $168 | 0.88 |
| 22 | Georgia | $220 | $253 | 0.87 |
| 23 | Utah | $184 | $225 | 0.82 |
| 24 | Florida | $224 | $277 | 0.81 |
| 25 | North Dakota | $205 | $264 | 0.78 |
| 26 | Texas | $331 | $438 | 0.76 |
| 27 | Missouri | $149 | $200 | 0.75 |
| 28 | Kansas | $215 | $296 | 0.73 |
| 28 | Minnesota | $231 | $317 | 0.73 |
| 30 | Maryland | $251 | $366 | 0.69 |
| 31 | Iowa | $172 | $275 | 0.63 |
| 32 | Delaware | $97 | $159 | 0.61 |
| 33 | Rhode Island | $235 | $443 | 0.53 |
| 34 | Hawaii | $95 | $198 | 0.48 |
| 35 | Oregon | $152 | $339 | 0.45 |
| 35 | Pennsylvania | $143 | $321 | 0.45 |
| 37 | Washington | $178 | $409 | 0.44 |
| 38 | Connecticut | $263 | $615 | 0.43 |
| 39 | Michigan | $122 | $293 | 0.42 |
| 39 | Illinois | $228 | $547 | 0.42 |
| 41 | Ohio | $117 | $284 | 0.41 |
| 41 | Wisconsin | $140 | $345 | 0.41 |
| 43 | District of Columbia | $145 | $392 | 0.37 |
| 44 | Maine | $107 | $298 | 0.36 |
| 45 | Massachusetts | $189 | $536 | 0.35 |
| 46 | California | $170 | $508 | 0.33 |
| 47 | Alaska | $113 | $374 | 0.30 |
| 48 | New York | $168 | $626 | 0.27 |
| 49 | New Hampshire | $114 | $614 | 0.19 |
| 50 | New Jersey | $159 | $863 | 0.18 |
| 51 | Vermont | $77 | $467 | 0.16 |
Nationwide, homeowners spend an estimated $200 a month on insurance and $311 on property taxes. But state-level differences often tell a very different story.
That shift from state to state may catch some buyers off guard. “Insurance used to be an afterthought in the homebuying process for most shoppers,” Bhatt says. “In many areas today, the rising cost of home insurance is having an outsized influence over people’s buying power.”
Colorado has the highest home insurance premiums
Colorado homeowners pay more for home insurance than homeowners in any other state. The typical homeowner there spends an estimated $463 a month on coverage, or $5,553 a year.
Weather risk is one reason insurance costs run so high in Colorado. Homeowners in the Centennial State face threats from hailstorms and wildfires, both of which can lead to costly claims and higher premiums.
For comparison, the national average home insurance premium is $200 a month; Colorado homeowners pay more than twice that amount.
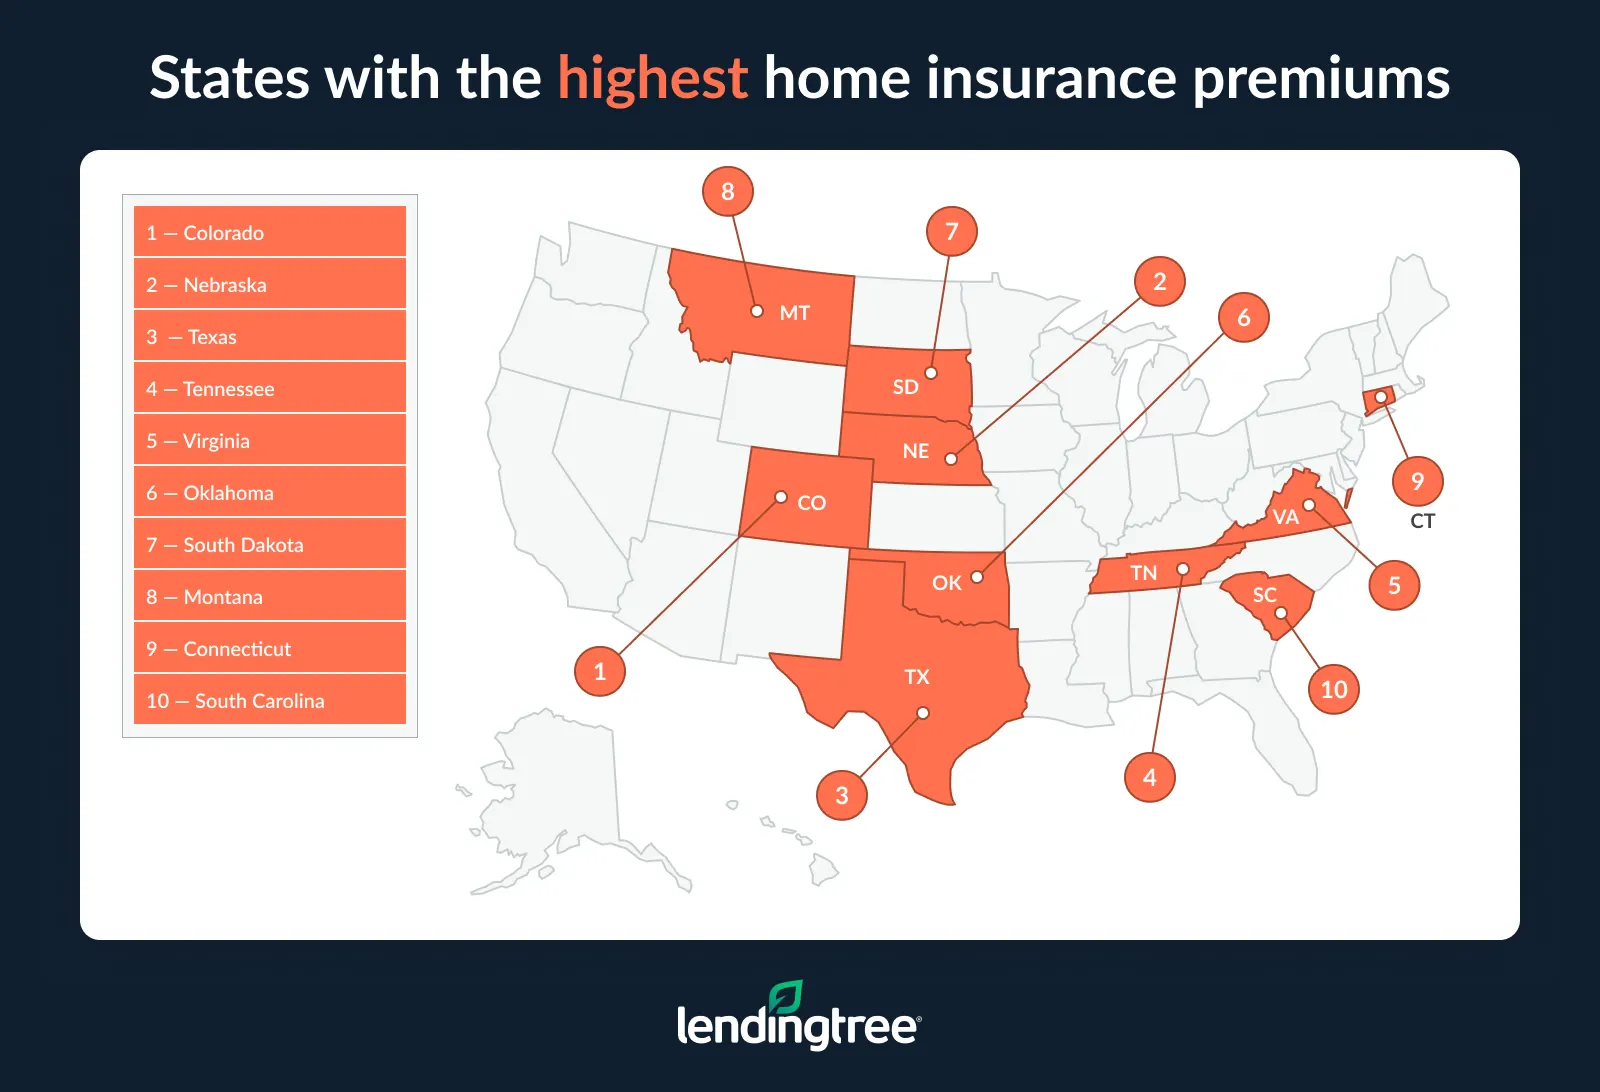
Full rankings: States with the highest/lowest home insurance premiums
| Rank | State | Median home value | Annual premium | Monthly premium |
|---|---|---|---|---|
| 1 | Colorado | $566,855 | $5,553 | $463 |
| 2 | Nebraska | $278,266 | $4,956 | $413 |
| 3 | Texas | $312,049 | $3,969 | $331 |
| 4 | Tennessee | $344,687 | $3,408 | $284 |
| 5 | Virginia | $430,258 | $3,390 | $283 |
| 6 | Oklahoma | $229,439 | $3,336 | $278 |
| 7 | South Dakota | $303,237 | $3,258 | $272 |
| 8 | Montana | $433,536 | $3,215 | $268 |
| 9 | Connecticut | $437,866 | $3,157 | $263 |
| 10 | South Carolina | $311,788 | $3,102 | $259 |
| 11 | Maryland | $450,140 | $3,010 | $251 |
| 12 | New Mexico | $294,532 | $2,922 | $244 |
| 13 | Arizona | $430,758 | $2,860 | $238 |
| 14 | Rhode Island | $485,706 | $2,816 | $235 |
| 15 | Minnesota | $362,441 | $2,774 | $231 |
| 16 | Illinois | $312,364 | $2,731 | $228 |
| 17 | Florida | $393,745 | $2,691 | $224 |
| 18 | Georgia | $352,327 | $2,640 | $220 |
| 19 | Kansas | $254,442 | $2,585 | $215 |
| 20 | North Carolina | $341,923 | $2,566 | $214 |
| 21 | North Dakota | $286,387 | $2,460 | $205 |
| 22 | Idaho | $466,865 | $2,404 | $200 |
| 22 | Arkansas | $227,011 | $2,402 | $200 |
| 24 | Massachusetts | $641,908 | $2,270 | $189 |
| 25 | Kentucky | $242,249 | $2,231 | $186 |
| 26 | Nevada | $470,105 | $2,219 | $185 |
| 27 | Utah | $558,485 | $2,210 | $184 |
| 28 | Alabama | $244,684 | $2,181 | $182 |
| 29 | Washington | $613,650 | $2,132 | $178 |
| 30 | Wyoming | $350,815 | $2,101 | $175 |
| 31 | Iowa | $240,834 | $2,069 | $172 |
| 32 | California | $762,568 | $2,041 | $170 |
| 33 | New York | $491,141 | $2,021 | $168 |
| 34 | New Jersey | $544,278 | $1,902 | $159 |
| 35 | Oregon | $503,544 | $1,829 | $152 |
| 36 | Missouri | $271,294 | $1,787 | $149 |
| 36 | Mississippi | $197,635 | $1,783 | $149 |
| 38 | Indiana | $260,051 | $1,766 | $147 |
| 39 | District of Columbia | $726,806 | $1,738 | $145 |
| 40 | Pennsylvania | $299,746 | $1,712 | $143 |
| 41 | Wisconsin | $321,047 | $1,679 | $140 |
| 42 | Louisiana | $230,098 | $1,588 | $132 |
| 43 | Michigan | $273,823 | $1,462 | $122 |
| 44 | Ohio | $259,230 | $1,406 | $117 |
| 45 | New Hampshire | $489,268 | $1,362 | $114 |
| 46 | Alaska | $409,905 | $1,361 | $113 |
| 46 | West Virginia | $183,369 | $1,361 | $113 |
| 48 | Maine | $368,360 | $1,280 | $107 |
| 49 | Delaware | $381,561 | $1,165 | $97 |
| 50 | Hawaii | $881,990 | $1,145 | $95 |
| 51 | Vermont | $375,678 | $924 | $77 |
Colorado’s top ranking doesn’t tell the whole story, though. Despite having the highest insurance premiums in the country, it doesn’t rank first when measuring insurance costs as a share of monthly housing expenses. Home insurance accounts for 13.3% of monthly housing costs in Colorado, compared with 19.4% in Nebraska. Higher home values and mortgage payments in Colorado help explain the difference.
How homeowners can manage rising insurance costs
Homeowners may not have much control over inflation, severe weather or insurance market trends. But there are still steps you can take to keep your insurance coverage more affordable.
Shop around before your policy renews
Many homeowners stick with the same insurance company year after year, but that loyalty doesn’t always pay off. Getting quotes from multiple companies can help you see whether you’re paying a competitive premium or whether there’s room for improvement.
“It’s good to shop around and make sure you’re not overpaying, but it’s also important to make sure you have the right amount of coverage,” Bhatt says.
Take a closer look at your deductible
A higher deductible can lower your premium, but the trade-off only makes sense if you can comfortably cover out-of-pocket expenses after a loss.
“You can save money by raising your deductible,” Bhatt says, “but make sure you can cover it if a disaster strikes.”
Don’t overlook home upgrades
Some improvements can do double duty by protecting your home and potentially lowering insurance costs. Updating older plumbing, electrical systems or heating equipment may help you qualify for reduced homeowners insurance rates, depending on the insurer.
“Depending on where you live, installing features like impact-resistant roofs or ember-resistant vents can also often get you an insurance discount while protecting your home from the risks in your area,” Bhatt says.
Review your policy before renewal
Home values and coverage needs often change from year to year. As a result, your insurance policy could need an update as well.
It’s important to take a few minutes each year to review your policy and make sure your coverage still fits your situation. If something on your policy no longer makes sense, Bhatt recommends talking to your agent and asking questions, or discussing those questions with other agents as you shop for coverage.
Save insurance for the big stuff
Insurance exists to protect homeowners from major financial losses. Filing claims for smaller repairs may not always be the best move, especially if the repair costs only slightly exceed your deductible. Claims of any size could trigger a rate increase, especially if you have multiple claims within a short period.
“As frustrating as this sounds, it’s generally best to avoid claims for minor issues and save insurance for the ‘big stuff,’” Bhatt says.
Methodology
LendingTree analyzed the U.S. Census Bureau’s 2024 American Community Survey (ACS) one-year estimates, the Federal Housing Finance Agency (FHFA) House Price Index, Freddie Mac’s Primary Mortgage Market Survey (PMMS) and Quadrant Information Services home insurance rate data pulled in February 2026.
The analysis used each state’s 2024 median home value as a baseline and estimated 2026 median home values by applying the percentage change implied by the state’s FHFA House Price Index between the 2024 average index level and the 2026 Q1 index level. Annual property tax totals were converted into an effective 2024 property tax rate by dividing estimated annual property taxes by the 2024 ACS median home value. This effective rate was then applied to the estimated 2026 home value to project annual and monthly property tax costs.
Mortgage payments were estimated assuming a 20% down payment, an 80% loan-to-value ratio, a 30-year, fixed-rate mortgage term and a 2026 year-to-date average 30-year fixed mortgage rate of 6.21%, based on Freddie Mac PMMS releases through May 21, 2026. Loan amounts were calculated as 80% of each estimated 2026 home value, and monthly principal-and-interest payments were modeled using the standard fixed-rate mortgage amortization formula.
To better align insurance assumptions with home values, each state’s dwelling coverage was approximated to the nearest available benchmark of $200,000, $350,000 or $500,000 based on that state’s starter-home value. Unless otherwise noted, the insurance assumptions also used the following figures:
- Personal liability: $100,000
- Medical payments: $1,000
- Deductible: $1,000
The total monthly housing cost was calculated as the estimated monthly mortgage payment, monthly property tax and monthly home insurance premium, and each component’s share was calculated as a percentage of that total.