State of Home Insurance: 2026
Home insurance is a fast-rising household expense in America. Between 2020 and 2025, rates climbed a cumulative 46.8% nationally — and not a single state was spared from an increase.
Here’s a closer look at where rates rose the most.
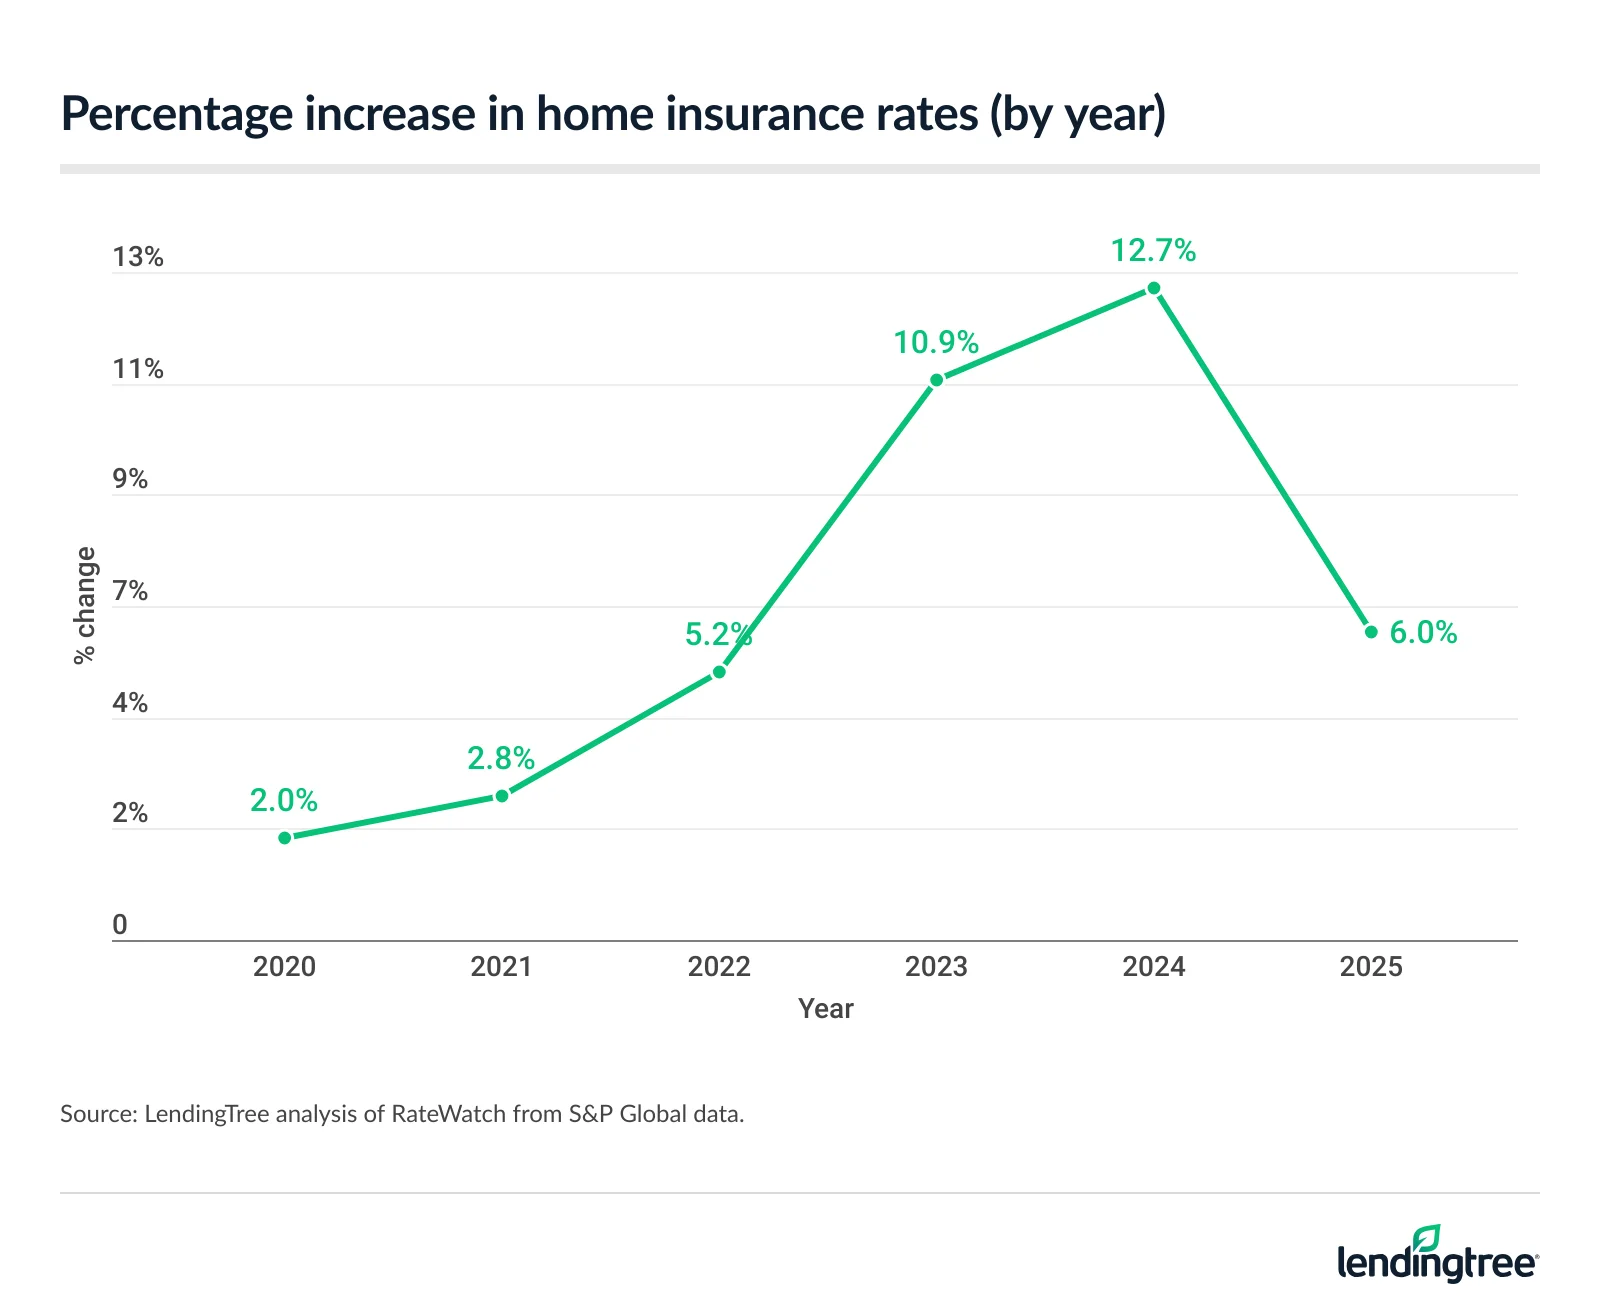
- U.S. home insurance rates rose a cumulative 46.8% from 2020 to 2025. Annual increases began accelerating more sharply in 2022, peaking at 12.7% in 2024 before easing to a still significant 6.0% jump in 2025.
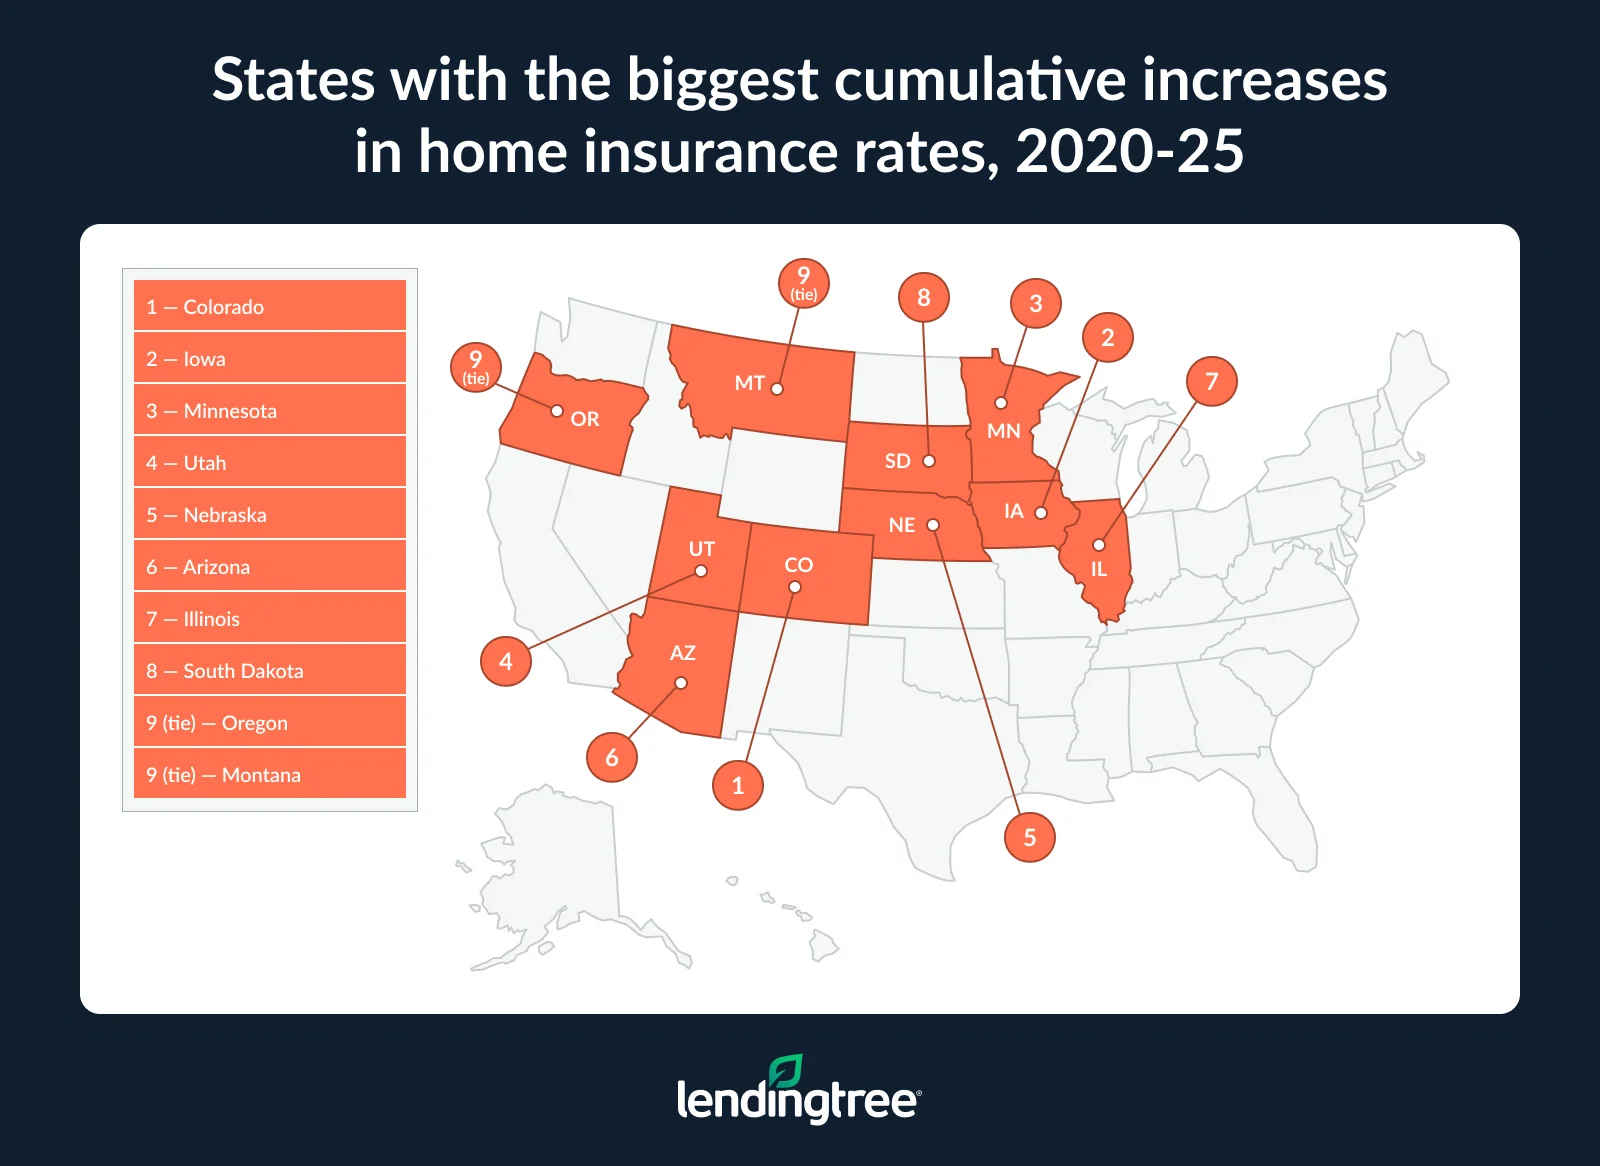
- Colorado has seen the largest cumulative increase in home insurance rates, with costs rising 100.8% (more than doubling) from 2020 to 2025. Iowa (96.0%) and Minnesota (88.2%) follow, with each nearing a doubling of rates over the period. West Virginia (19.2%), Vermont (19.6%) and Maine (20.0%) experienced the smallest increases.
- Home insurance rates increased 6.0% nationwide in 2025, with seven states seeing double-digit growth. Colorado had the largest increase in 2025 at 18.3%, followed by Minnesota (17.0%) and Iowa (14.7%). Meanwhile, Florida (0.4%), Montana (0.5%) and Texas (0.6%) saw the smallest increases in 2025. Notably, no state saw a decrease in home insurance rates.
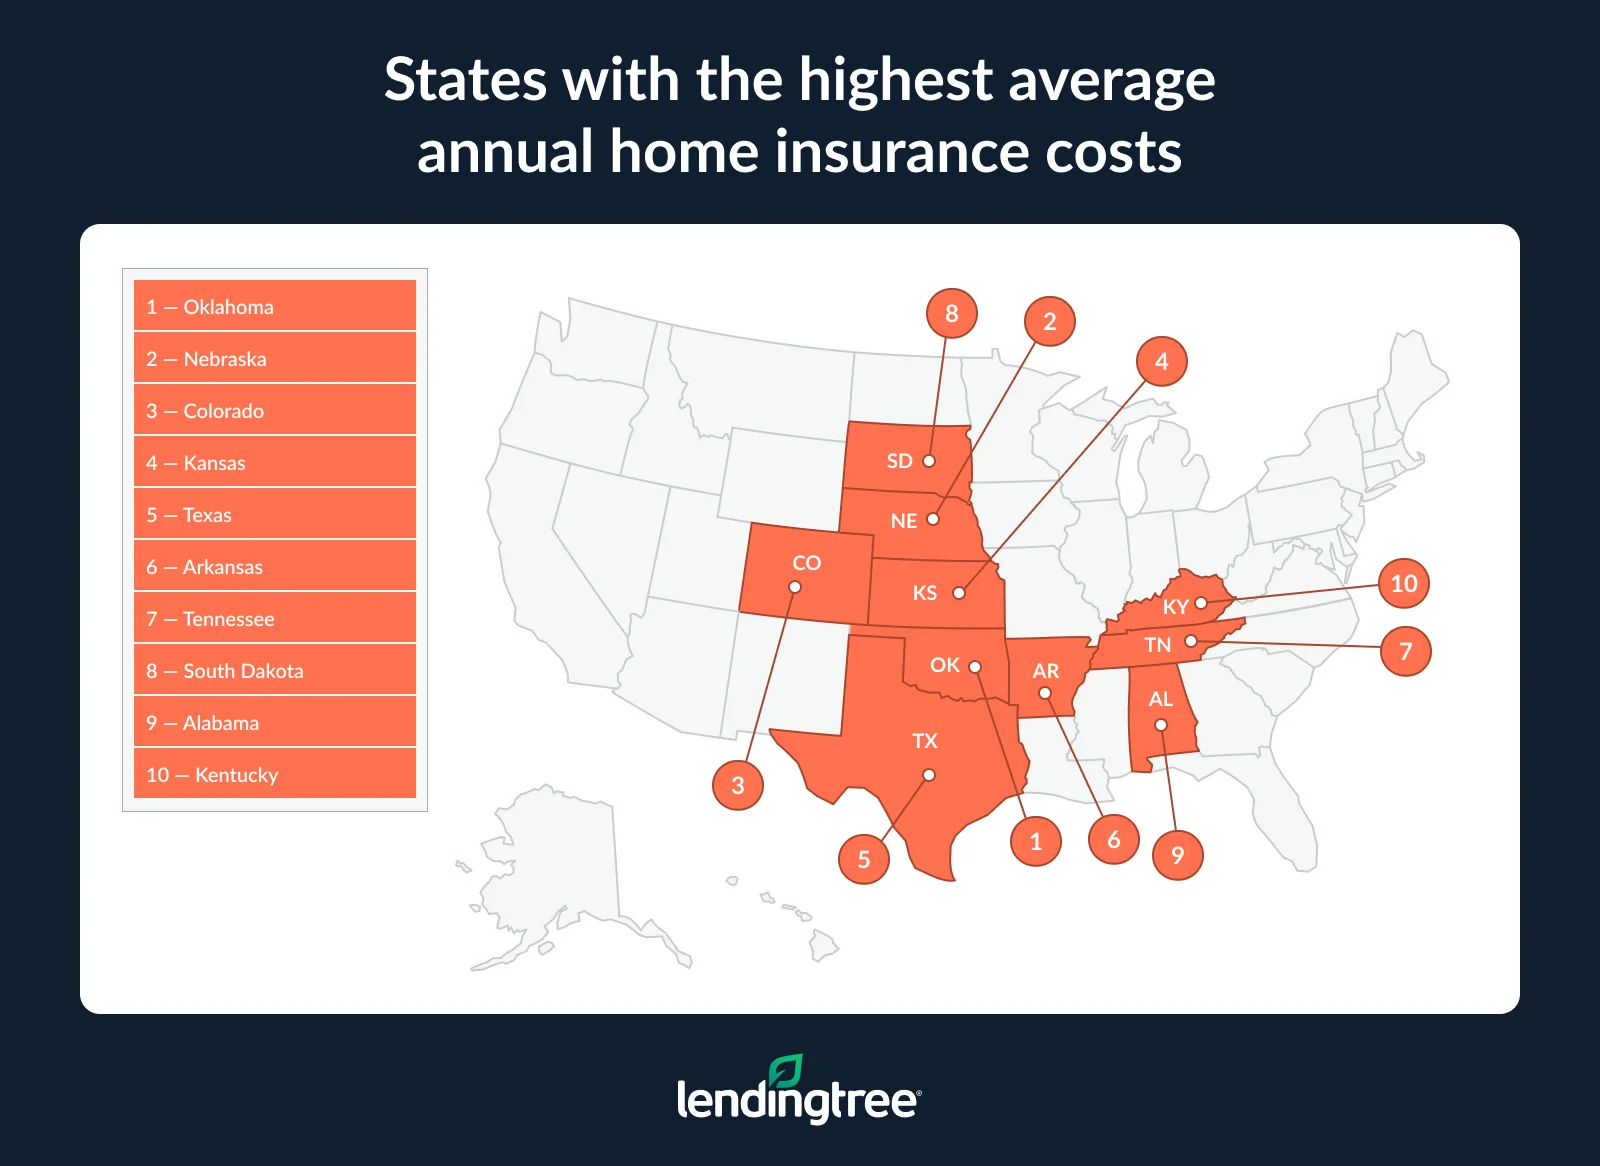
- The average annual cost of home insurance across the U.S. is $2,395. Oklahoma has the highest average rate at $5,298 — 121.2% above the national average — followed by Nebraska ($4,956) and Colorado ($4,310). Hawaii has the lowest average rate at $801 — 66.6% below the U.S. average — followed by Vermont ($924) and New Hampshire ($1,028).
Rates rose 46.8% cumulatively from 2020 to 2025
Between 2020 and 2025, home insurance rates have risen 46.8% cumulatively. That multiyear climb has been anything but gradual.
While earlier annual increases were smaller, with rates rising 2.0% in 2020 and 2.8% in 2021, they jumped by 5.2% in 2022, then peaked at a 12.7% jump in 2024. In 2025, rates rose by a slightly more modest but still-elevated 6.0%.
The reason home insurance rates have climbed since 2020 is mainly due to a rise in severe weather losses and an increase in the price of labor, materials and repairs, according to LendingTree home insurance expert Lindsay Bishop.
“Between 2020 and 2024, the U.S. experienced around 23 disasters per year that caused at least $1 billion in damage each,” she says. “That’s a major increase from the previous five-year period, when there were only an average of 15 billion-dollar disasters per year.”
The number of severe storms also went up. “There was a huge increase in the number of severe storms, which went from an average of nearly nine per year between 2015 and 2019 to more than 14 per year between 2020 and 2024,” Bishop says. “The high winds, heavy rainfall and hail produced by these storms can cause major damage to lots of homes at once.”
Meanwhile, the sharp acceleration in home insurance prices that started around 2022 reflects postpandemic supply chain disruptions and labor shortages.
For example, the price of lumber rose by more than 300% between 2020 and 2021. “That has a huge impact on the cost to repair everything from roofing leaks to structural damage to interior flooring,” Bishop says.
Colorado has seen the largest cumulative increase
By state, Colorado has felt the most pressure, with home insurance costs there rising 100.8% from 2020 to 2025 — in other words, more than doubling over that period. Notably, Colorado also saw the largest increase in last year’s report, which analyzed data from 2019 through 2024. (Note: This year’s analysis uses fresh data for past years rather than utilizing last year’s dataset.)
Iowa follows, with insurance rates there increasing 96.0%. Minnesota (88.2%) rounds out the top three.
Bishop believes regional risk is the biggest reason these states have seen sharper increases. Colorado is ranked second in the nation for homes at moderate or greater wildfire risk, with more than 321,000 homes exposed and roughly $141 billion in reconstruction cost value, according to CoreLogic.
Colorado also had the highest loss cost from catastrophe-related home insurance claims in 2024, driven largely by hail, wildfire and severe storm damage, according to LexisNexis. Minnesota and Iowa are also prone to severe storm damage, with Minnesota ranking among the highest states for hail exposure and Iowa among the highest for wind-related claims.
On the other end of the spectrum, West Virginia (19.2%) saw the smallest cumulative increase in insurance costs, with Vermont (19.6%) and Maine (20.0%) following.
In comparison to the top-ranking states, Vermont and Maine rank among the lowest states for theft-related losses, and Vermont also has relatively low hail and wind exposure. “This makes it easier for insurance companies to avoid major rate increases in these states,” Bishop says.
Full rankings: States with biggest/smallest cumulative increases in home insurance rates, 2020 through 2025
| Rank | State | % change |
|---|---|---|
| 1 | Colorado | 100.8% |
| 2 | Iowa | 96.0% |
| 3 | Minnesota | 88.2% |
| 4 | Utah | 77.2% |
| 5 | Nebraska | 72.2% |
| 6 | Arizona | 71.0% |
| 7 | Illinois | 68.0% |
| 8 | South Dakota | 62.8% |
| 9 | Oregon | 56.5% |
| 9 | Montana | 56.5% |
| 11 | Arkansas | 56.2% |
| 12 | Texas | 55.9% |
| 13 | Washington | 55.4% |
| 14 | Oklahoma | 54.5% |
| 15 | California | 53.7% |
| 16 | Idaho | 52.8% |
| 17 | Florida | 49.5% |
| 18 | Wisconsin | 48.7% |
| 19 | Maryland | 47.3% |
| 20 | North Carolina | 46.9% |
| 21 | Ohio | 46.4% |
| 22 | Kentucky | 46.3% |
| 23 | New Mexico | 45.8% |
| 24 | Rhode Island | 45.6% |
| 25 | Missouri | 45.5% |
| 26 | Indiana | 44.1% |
| 27 | Tennessee | 42.9% |
| 28 | Kansas | 42.6% |
| 29 | Louisiana | 41.5% |
| 30 | Virginia | 41.4% |
| 31 | Alabama | 41.2% |
| 32 | Michigan | 40.8% |
| 33 | Georgia | 40.2% |
| 34 | North Dakota | 39.9% |
| 35 | Connecticut | 39.4% |
| 36 | Mississippi | 34.6% |
| 37 | Delaware | 33.9% |
| 38 | Pennsylvania | 33.4% |
| 39 | District of Columbia | 32.9% |
| 40 | Hawaii | 32.8% |
| 41 | New Jersey | 32.1% |
| 42 | Nevada | 30.4% |
| 43 | Massachusetts | 29.6% |
| 44 | South Carolina | 28.9% |
| 45 | New Hampshire | 26.9% |
| 46 | New York | 25.5% |
| 47 | Alaska | 24.9% |
| 48 | Maine | 20.0% |
| 49 | Vermont | 19.6% |
| 50 | West Virginia | 19.2% |
Home insurance rates increased 6.0% in 2025
Even as the pace of increases eased slightly from its 2024 peak, 2025 was far from a reprieve, with home insurance rates rising 6.0% nationwide. Colorado again led, with an 18.3% single-year increase, followed by Minnesota (17.0%) and Iowa (14.7%).
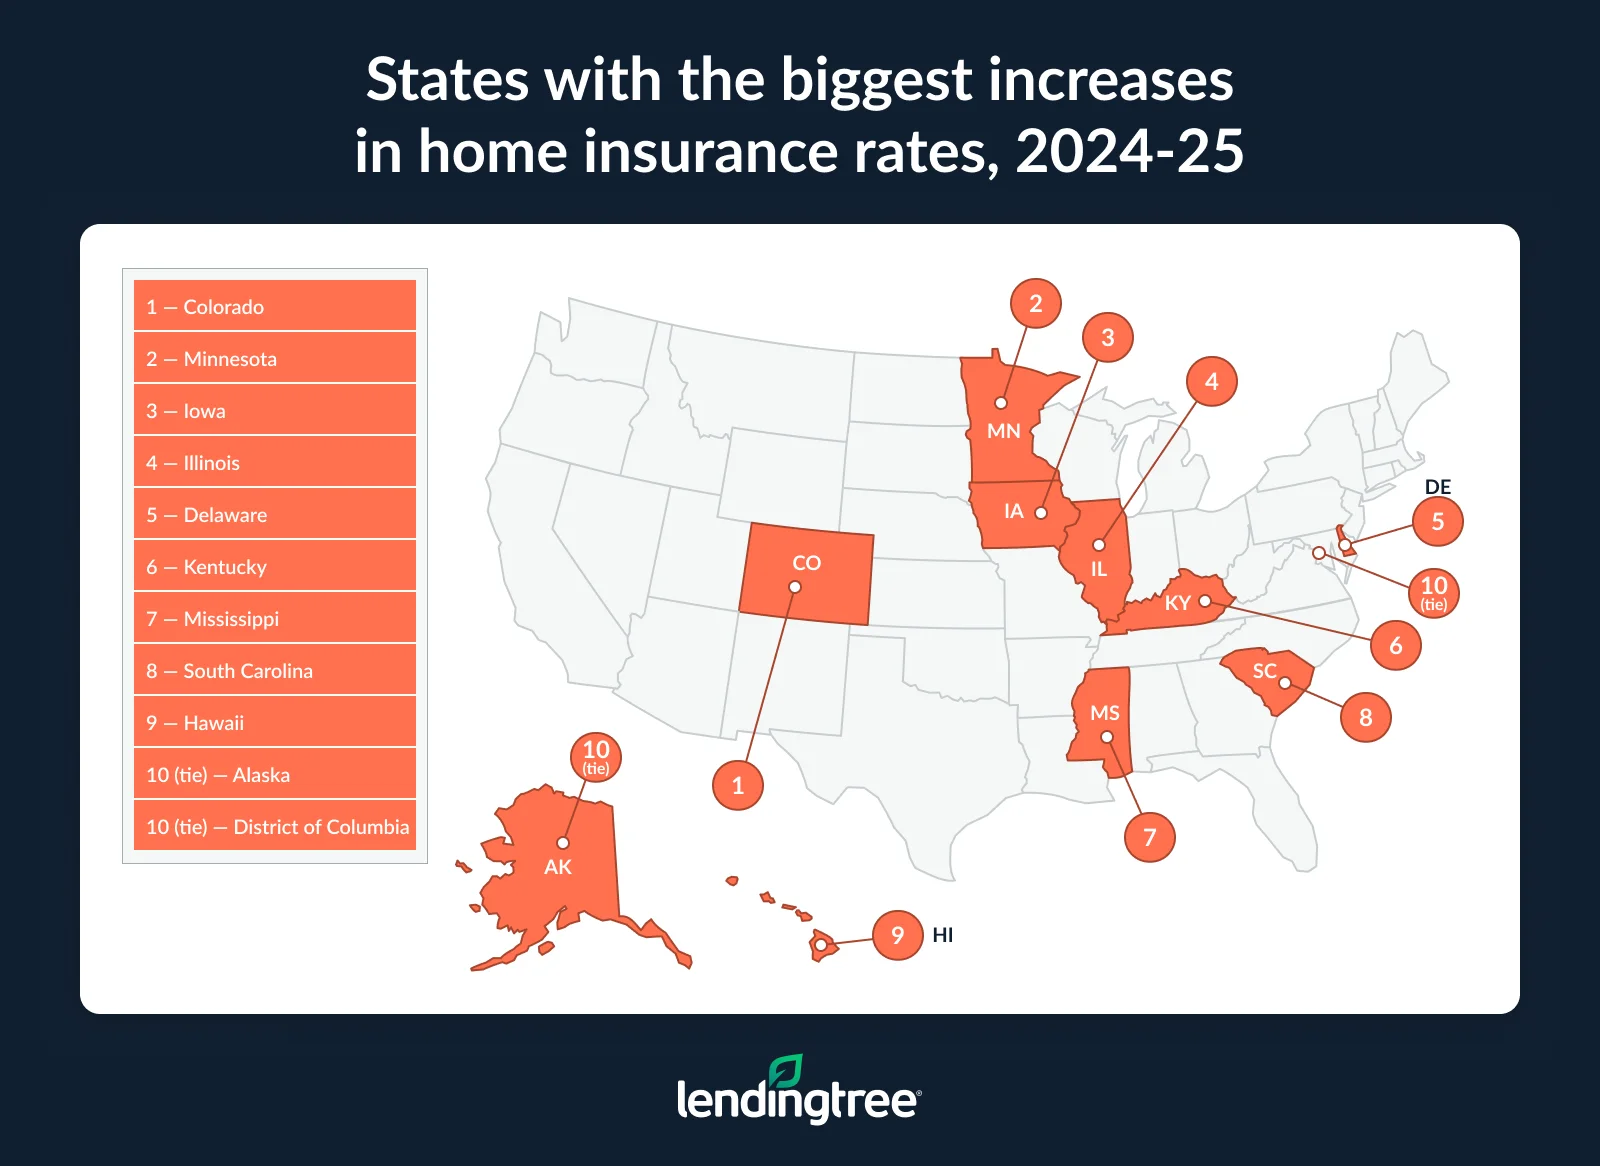
Meanwhile, Florida (0.4%) saw the smallest increase. Montana (0.5%) and Texas (0.6%) followed. Of note, Montana tied for the largest increase in home insurance rates when we conducted this study last year.
Rising home insurance costs are forcing many homeowners to make difficult financial trade-offs, Bishop notes. Around 1 in 10 homeowners have raised their deductible to lower their insurance bill, according to a study from ClaimGuide, while 1 in 5 said they plan to switch insurance companies within the next year. Another 1 in 5 said they would cancel their policy entirely if it weren’t required by their mortgage lender.
“That suggests affordability pressures are becoming severe enough that some homeowners are questioning whether they can continue carrying coverage at all,” Bishop says.
Those trends are already showing up in national data. According to a LendingTree study on uninsured homes, over 12 million U.S. homeowners went without insurance in 2024. That means roughly 14% of homes are uninsured nationwide.
Full rankings: States with biggest/smallest increases in home insurance rates, 2025
| Rank | State | % change |
|---|---|---|
| 1 | Colorado | 18.3% |
| 2 | Minnesota | 17.0% |
| 3 | Iowa | 14.7% |
| 4 | Illinois | 14.1% |
| 5 | Delaware | 10.8% |
| 6 | Kentucky | 10.2% |
| 7 | Mississippi | 10.1% |
| 8 | South Carolina | 9.7% |
| 9 | Hawaii | 9.2% |
| 10 | Alaska | 8.8% |
| 10 | District of Columbia | 8.8% |
| 12 | Arkansas | 8.5% |
| 13 | Tennessee | 8.3% |
| 14 | Nevada | 7.7% |
| 15 | Michigan | 7.6% |
| 16 | New Jersey | 7.5% |
| 17 | Georgia | 7.3% |
| 17 | Ohio | 7.3% |
| 17 | Wisconsin | 7.3% |
| 20 | Alabama | 7.2% |
| 21 | South Dakota | 6.3% |
| 22 | North Carolina | 6.2% |
| 23 | Nebraska | 6.0% |
| 24 | Oklahoma | 5.5% |
| 25 | Connecticut | 5.4% |
| 26 | Kansas | 4.8% |
| 27 | North Dakota | 4.7% |
| 28 | New York | 4.6% |
| 29 | Indiana | 4.4% |
| 29 | California | 4.4% |
| 31 | Virginia | 3.9% |
| 32 | Missouri | 3.8% |
| 33 | Oregon | 3.7% |
| 34 | Arizona | 3.6% |
| 35 | Idaho | 3.5% |
| 35 | Washington | 3.5% |
| 37 | Louisiana | 3.3% |
| 38 | Maryland | 3.2% |
| 39 | Utah | 3.0% |
| 40 | Rhode Island | 2.9% |
| 41 | Vermont | 2.7% |
| 42 | Massachusetts | 2.5% |
| 43 | New Mexico | 2.4% |
| 44 | Maine | 2.3% |
| 45 | New Hampshire | 1.3% |
| 46 | Pennsylvania | 1.2% |
| 47 | West Virginia | 0.9% |
| 48 | Texas | 0.6% |
| 49 | Montana | 0.5% |
| 50 | Florida | 0.4% |
Where you live makes a big difference in average annual costs
Nationally, the average home insurance premium is $2,395, but that varies widely by state.
Oklahoma tops the list, with homeowners there paying an average of $5,298 a year — a whopping 121.2% above the national average. That’s followed by Nebraska at $4,956, which is 106.9% above the national average. It’s the only other state where costs are more than twice as high. Colorado rounds out the top three, at $4,310 (80.0% above the national average).
On the other end of the spectrum, Hawaii has the lowest average rate at $801 — a significant 66.6% below the U.S. average. Vermont ($924, or 61.4% below the national average) and New Hampshire ($1,028, or 57.1%) follow.
Interestingly, many central states rank among the most expensive for home insurance. Kansas ($4,095), Texas ($3,969) and Arkansas ($3,538) are all among the 10 most expensive states. Meanwhile, several coastal and Northeastern states, including California ($1,413), New York ($1,387) and Massachusetts ($1,635), fall well below the national average.
The main reason home insurance rates vary between states is that the underlying risks in each state are so different, Bishop says.
“States like Oklahoma, Nebraska and Colorado experience greater damage from tornadoes, hail, wildfires and severe storms,” she says. “This leads to more frequent and expensive claims, so it’s unlikely that the gap between states will close dramatically unless the underlying risks change.”
Full rankings: States with highest/lowest average annual home insurance costs
| Rank | State | Avg. annual home insurance cost | % difference from U.S. avg. |
|---|---|---|---|
| 1 | Oklahoma | $5,298 | 121.2% |
| 2 | Nebraska | $4,956 | 106.9% |
| 3 | Colorado | $4,310 | 80.0% |
| 4 | Kansas | $4,095 | 71.0% |
| 5 | Texas | $3,969 | 65.7% |
| 6 | Arkansas | $3,538 | 47.7% |
| 7 | Tennessee | $3,408 | 42.3% |
| 8 | South Dakota | $3,258 | 36.0% |
| 9 | Alabama | $3,254 | 35.9% |
| 10 | Kentucky | $3,158 | 31.9% |
| 11 | Iowa | $3,136 | 30.9% |
| 12 | South Carolina | $3,102 | 29.5% |
| 13 | New Mexico | $2,922 | 22.0% |
| 14 | Mississippi | $2,800 | 16.9% |
| 15 | Minnesota | $2,774 | 15.8% |
| 16 | Montana | $2,754 | 15.0% |
| 17 | Illinois | $2,731 | 14.0% |
| 18 | Florida | $2,691 | 12.4% |
| 19 | Missouri | $2,641 | 10.3% |
| 20 | Indiana | $2,639 | 10.2% |
| 20 | Georgia | $2,640 | 10.2% |
| 22 | North Carolina | $2,566 | 7.1% |
| 23 | Louisiana | $2,542 | 6.1% |
| 24 | Virginia | $2,481 | 3.6% |
| 25 | North Dakota | $2,460 | 2.7% |
| 26 | Connecticut | $2,346 | -2.0% |
| 27 | Michigan | $2,246 | -6.2% |
| 28 | Arizona | $2,225 | -7.1% |
| 29 | Maryland | $2,124 | -11.3% |
| 30 | Wyoming | $2,101 | -12.3% |
| 31 | Rhode Island | $2,096 | -12.5% |
| 32 | Ohio | $2,015 | -15.9% |
| 33 | West Virginia | $1,917 | -20.0% |
| 34 | Idaho | $1,759 | -26.6% |
| 35 | Pennsylvania | $1,712 | -28.5% |
| 36 | Wisconsin | $1,679 | -29.9% |
| 37 | Utah | $1,656 | -30.9% |
| 38 | Massachusetts | $1,635 | -31.7% |
| 39 | Nevada | $1,633 | -31.8% |
| 40 | Washington | $1,560 | -34.9% |
| 41 | New Jersey | $1,449 | -39.5% |
| 42 | California | $1,413 | -41.0% |
| 43 | New York | $1,387 | -42.1% |
| 44 | Alaska | $1,361 | -43.2% |
| 45 | Oregon | $1,353 | -43.5% |
| 46 | Maine | $1,280 | -46.6% |
| 47 | District of Columbia | $1,166 | -51.3% |
| 48 | Delaware | $1,165 | -51.4% |
| 49 | New Hampshire | $1,028 | -57.1% |
| 50 | Vermont | $924 | -61.4% |
| 51 | Hawaii | $801 | -66.6% |
Expert tips for homeowners facing rising insurance costs
Bishop believes home insurance will likely remain expensive over the next few years, but increases appear to be slowing.
“This is partly because insurance companies are finally catching up to rising claim costs,” she says. “Homeowners will probably continue to see increases, especially in high-risk states, but unless there’s a busy hurricane season or large wildfire outbreak, the extreme jumps we saw in 2023 and 2024 are less likely.”
In the meantime, here are a few strategies homeowners can use to protect themselves financially:
- Shop regionally, not just nationally. “One of the smartest things homeowners can do is get quotes from smaller regional insurance companies,” Bishop says. “Smaller companies often have lower rates and more personalized service because they understand the risks specific to your area. It’s important to check a company’s financial strength and customer satisfaction history, but homeowners shouldn’t assume the biggest national insurance company is always the best fit.”
- Invest in damage-prevention upgrades. “Home upgrades that help prevent damage can also make a real difference,” she says. “Replacing an aging roof or adding impact-resistant window protection can reduce the chance you’ll have an expensive claim during storm season. Insurance companies may even offer discounts for these improvements. More importantly, avoiding claims can help you keep your insurance rates from rising even faster over time.”
- Be strategic about raising your deductible. “A higher deductible can help reduce monthly costs, but make sure you can comfortably afford to pay your deductible after a disaster,” she says. “Otherwise, what may seem like a great way to save money now could end up costing you big bucks in the future if you have to use a credit card to cover thousands of dollars in home repairs.”
Methodology
LendingTree researchers analyzed home insurance data, pulled in February 2026, from Quadrant Information Services. These rates were publicly sourced from insurer filings and should be used for comparative purposes only. Your quotes will likely differ. The following coverages and deductibles were used unless otherwise noted:
- Dwelling coverage: $350,000
- Personal liability: $100,000
- Medical payments: $1,000
- Deductible: $1,000
Home insurance rate change data was compiled using RateWatch from S&P Global, which uses annual information from the National Association of Insurance Commissioners (NAIC).