Nearly 1 in 5 Retirement-Age Americans Are Working — Nebraska Leads the Nation
Almost 1 in 5 Americans 65 or older had a full-time or part-time job in 2025.
That’s largely unchanged from two years earlier, according to a LendingTree analysis of U.S. Census Bureau data on the employment status of retirement-age Americans. However, a closer look at the data reveals significant differences by state in the percentage of 65-plus Americans who are still working, as well as notable variation across occupations.
- Nearly 1 in 5 Americans 65 and older worked in 2025. 18.7% of retirement-age Americans were employed in 2025, virtually unchanged from 19.1% in 2023. Meanwhile, nearly 3 in 4 Americans 65 and older (74.6%) were retired in 2025, also largely unchanged from 74.7% in 2023.
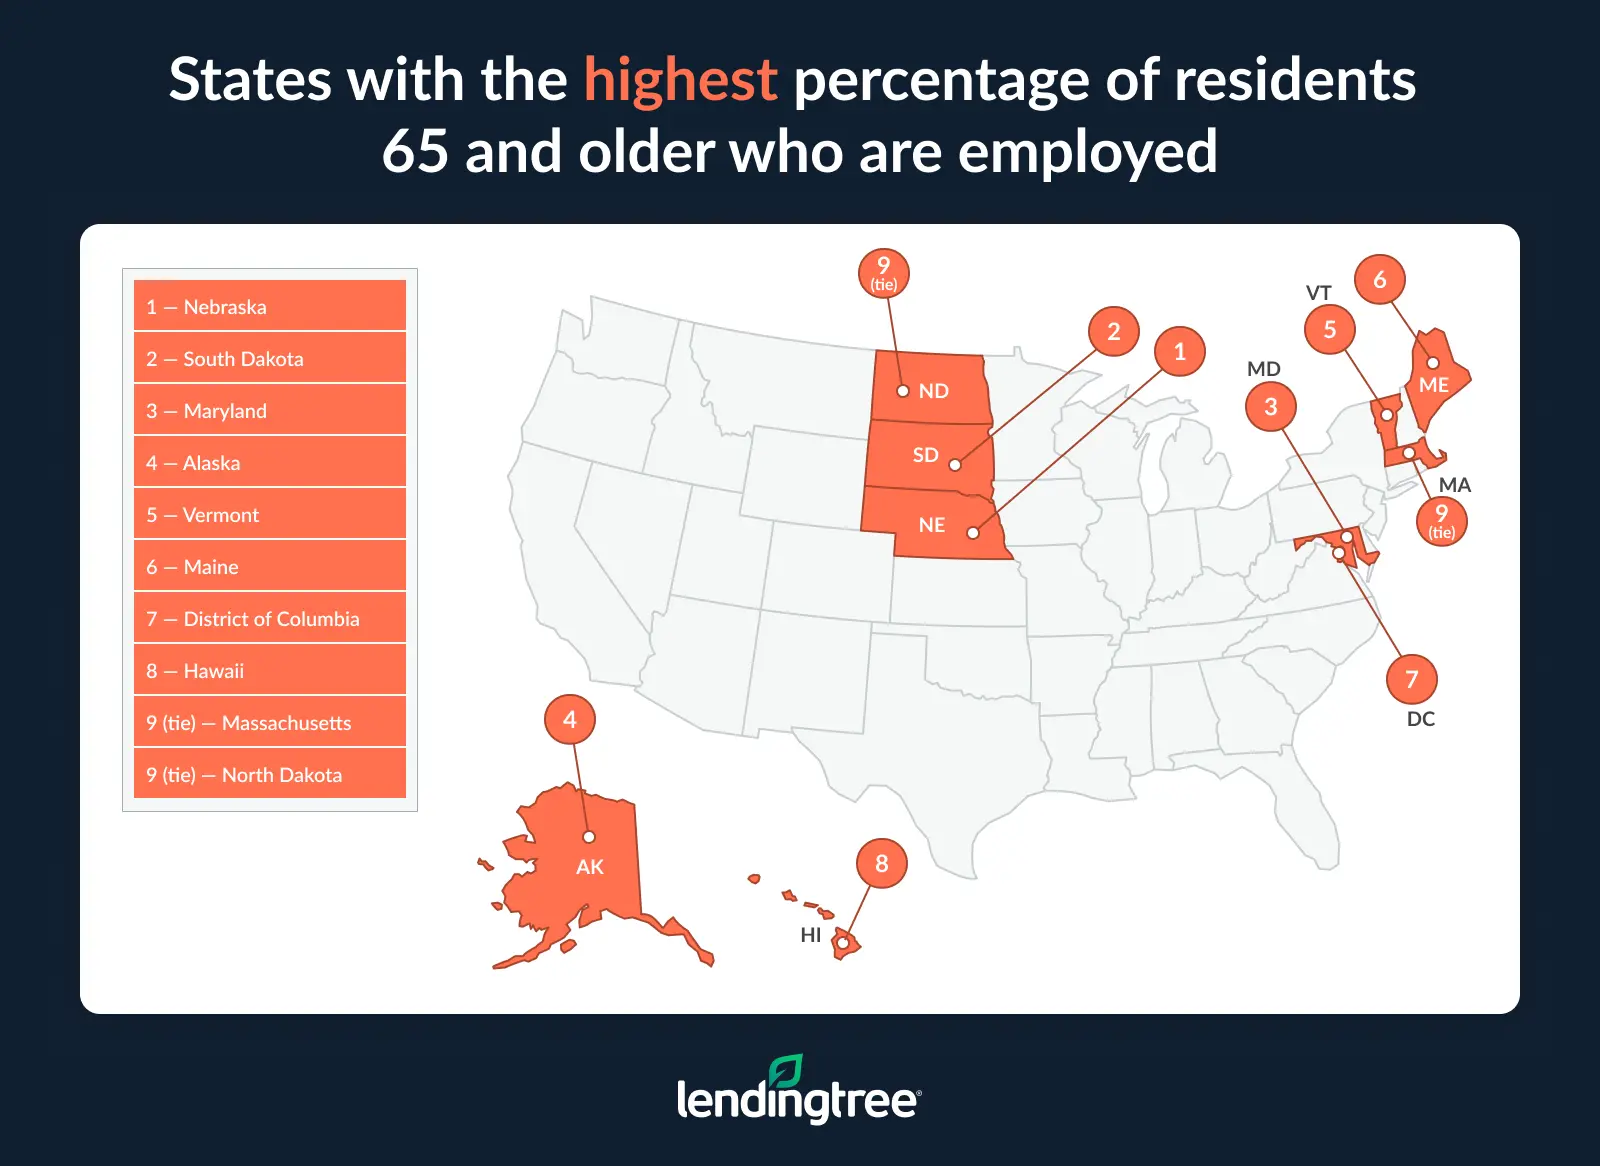
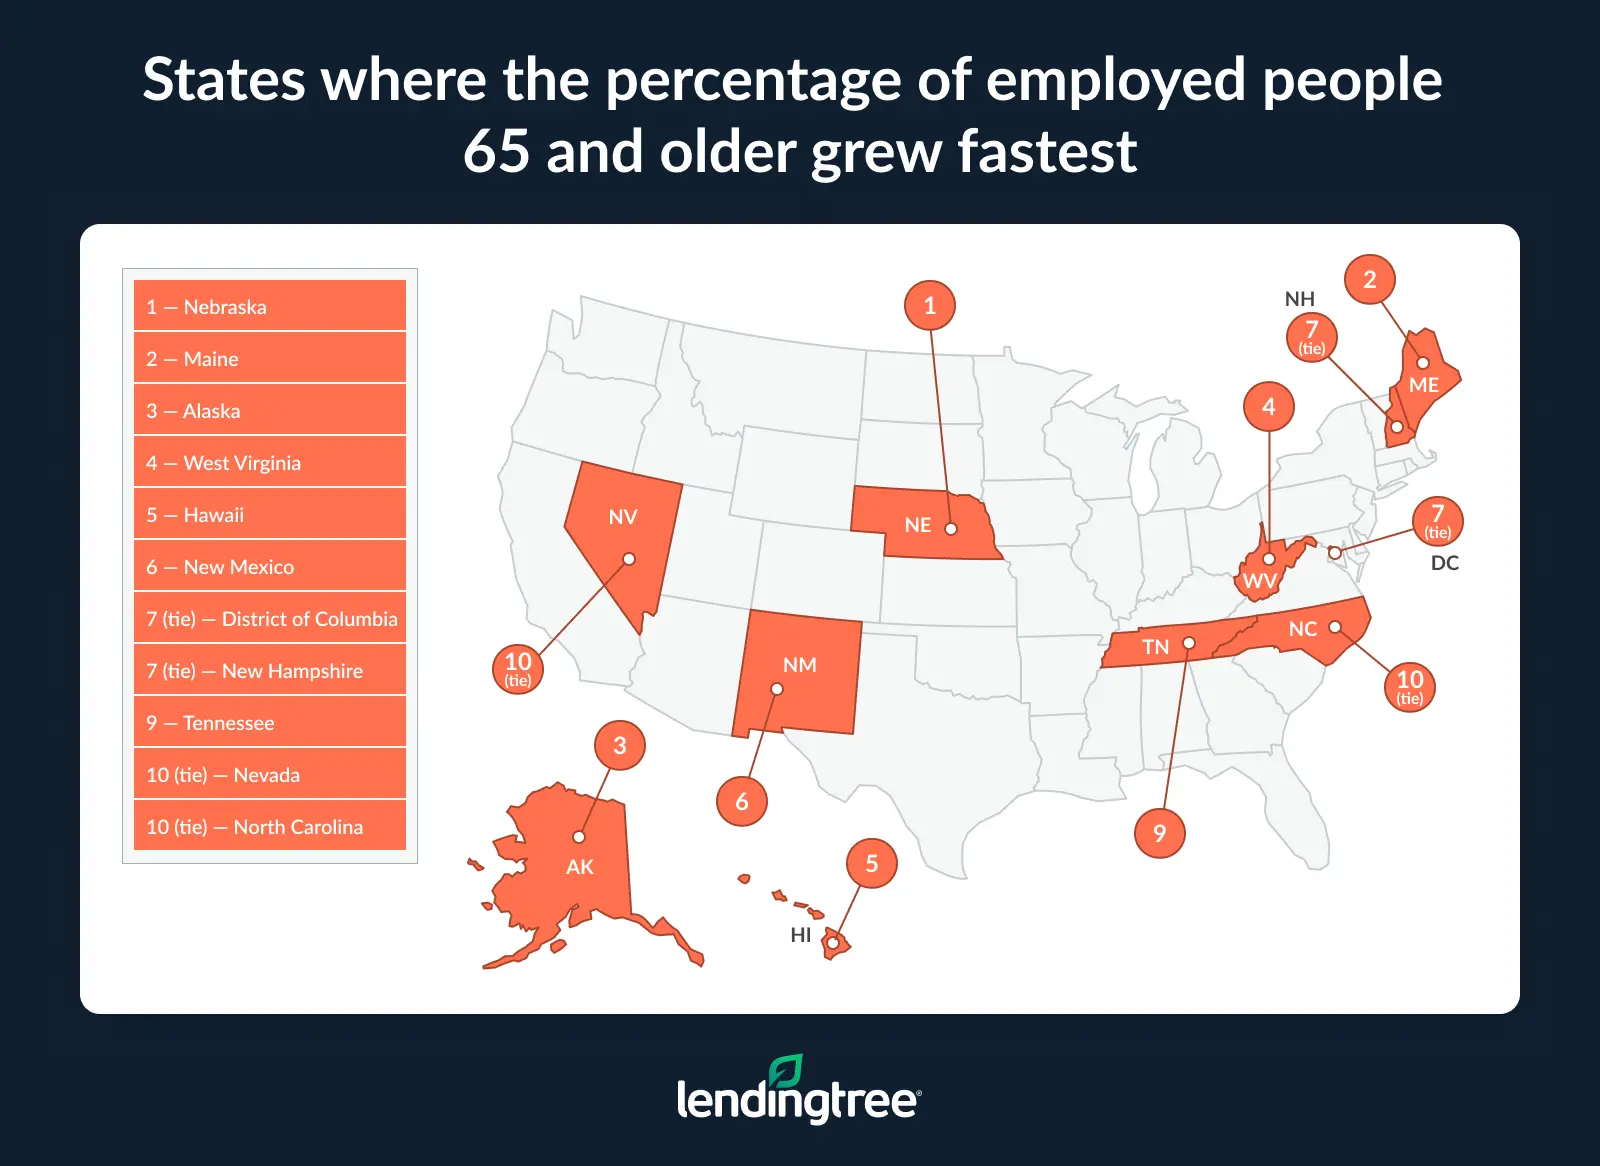
- Nebraska has the highest percentage of retirement-age people working, and it’s rising quickly. In 2025, 31.3% of Nebraskans 65 and older were employed — a 9.4 percentage point increase from 2023 — the biggest jump in the nation. South Dakota, Maryland and Alaska are the only other states where at least 25.0% of residents 65 and older are employed.
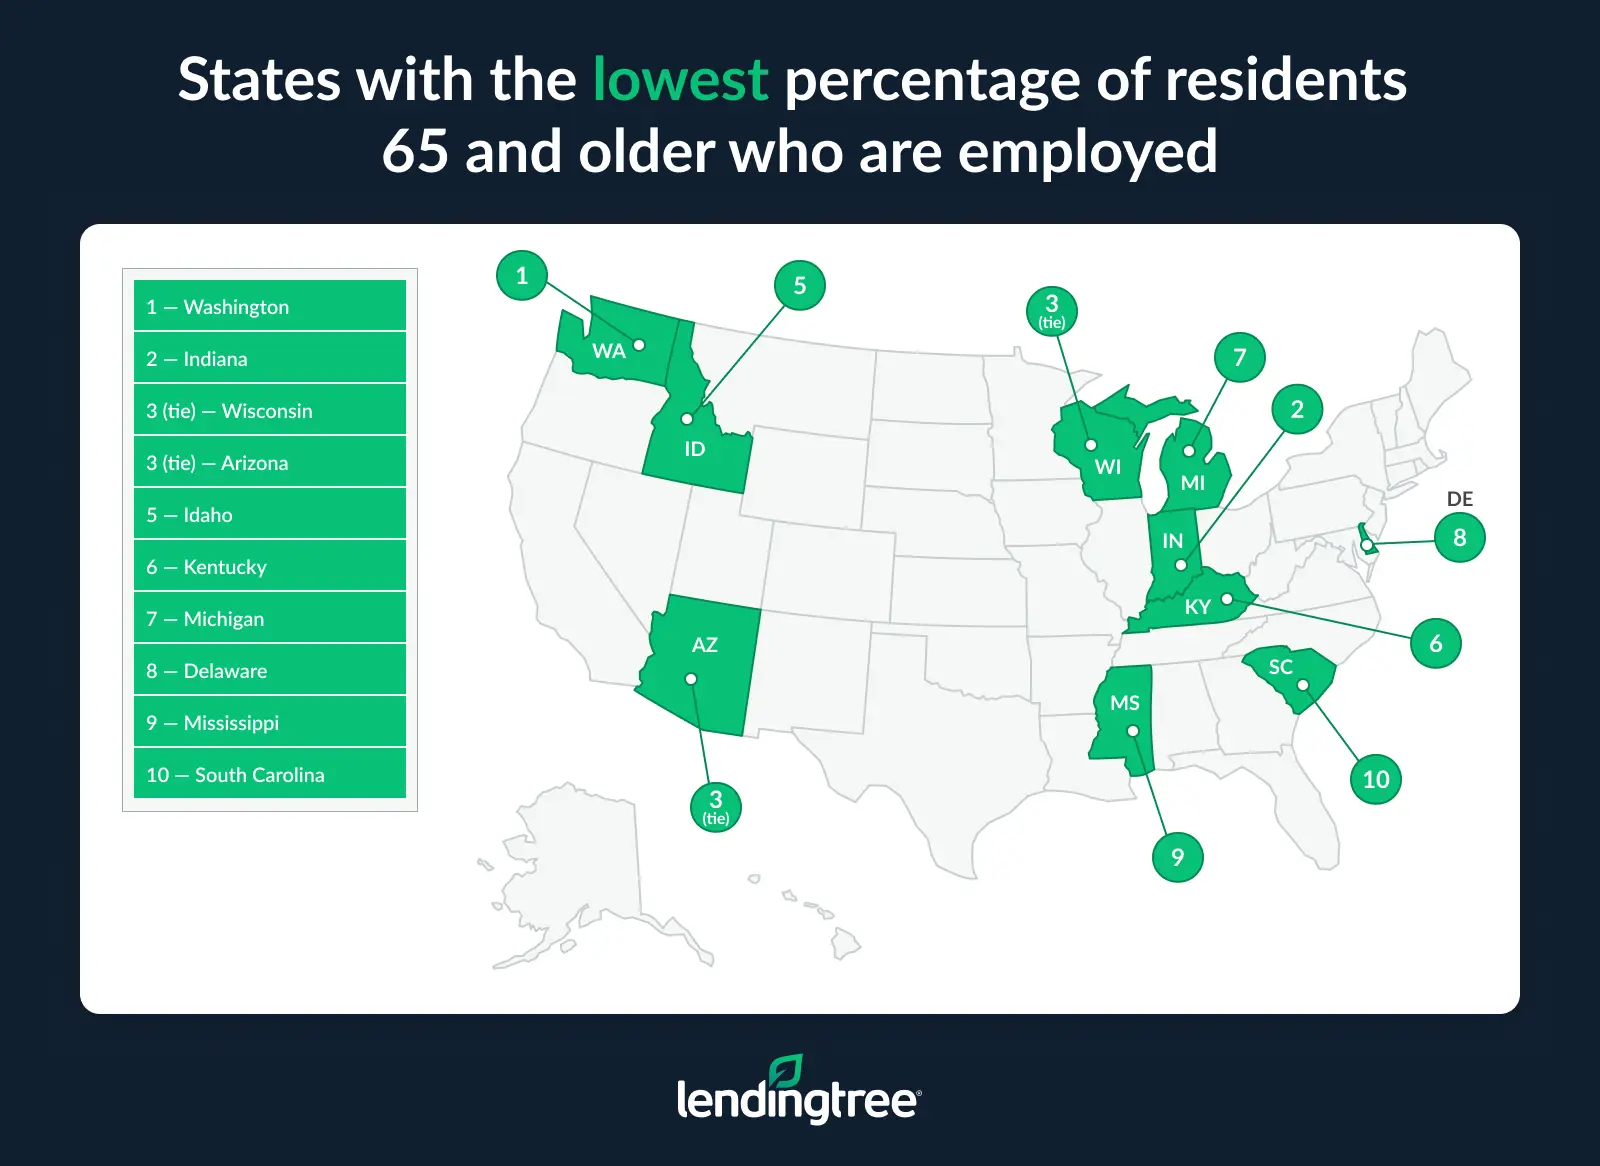
- In Washington state, just a tiny (and declining) percentage of residents 65 and older are still working. Just 11.6% of Washington residents 65 and older are employed, down from 19.1% in 2023 — a 7.5 percentage point drop, the largest decline nationwide. Four other states have fewer than 15.0% of their residents 65 and older employed.
- Older workers are especially common in certain occupations, including politics. We found significant variation across occupations in the percentage of workers 65 and older. Broadcast announcers and radio disc jockeys have the highest share at 44.4%, but legislators (38.9%) aren’t far behind. Farmers, ranchers and other agricultural managers (32.2%) also rank highly, while artists and related workers (10.9%) rank the lowest.
Nearly 1 in 5 Americans 65 and older worked in 2025
Many Americans dream of spending their golden years blissfully retired, removed from the stresses and chaos of the working world. However, for nearly 1 in 5 Americans, that dream has yet to become reality.
Census Bureau data shows that 18.7% of Americans 65 and older were employed either part time or full time in 2025. That’s a slight decrease from 19.1% in 2023. Meanwhile, 74.6% of Americans 65 and older were retired in 2025, virtually unchanged from 74.7% in 2023.
Percentage of workers 65 and older who were still working
| Year | % employed | % retired |
|---|---|---|
| 2023 | 19.1% | 74.7% |
| 2024 | 19.2% | 74.0% |
| 2025 | 18.7% | 74.6% |
The Census Bureau doesn’t specify why these retirement-age Americans are still working. Some likely continue working out of financial necessity, while others may simply enjoy their jobs. Many other factors may also play a role. However, this report focuses on where retirement-age Americans are working and how employment patterns vary rather than the reasons they remain in the workforce.
Nebraska has the highest percentage of retirement-age people working — and it’s rising quickly
Breaking down the numbers by state, we found a massive difference in the percentage of retirement-age workers who are still employed. The gap between the highest- and lowest-ranking states is nearly 20 percentage points.
Nebraska leads the way with 31.3% of its residents 65 and older being employed. In three other states — South Dakota, Maryland and Alaska — at least 25.0% of residents 65 and older are employed full or part time.
From 2023 to 2025, the percentage of 65-and-older workers increased by at least one percentage point in 19 states, with Nebraska again topping the list after posting a 9.4 percentage point increase. In 2023, 21.9% of Nebraskans 65 and older were employed, ranking 10th nationally and trailing well behind South Dakota, which led the nation at 31.1%.
Maine, Alaska and West Virginia also saw increases of at least six percentage points. Many of the states with the largest two-year gains were smaller and less densely populated.
In Washington state, a tiny (and declining) percentage of residents 65 and older are still working
The story is dramatically different in Washington state. Just 11.6% of its residents 65 and older are employed, the lowest percentage in the nation. Four other states have fewer than than 15.0% of their residents 65 and older employed, led by Indiana at 12.6%.
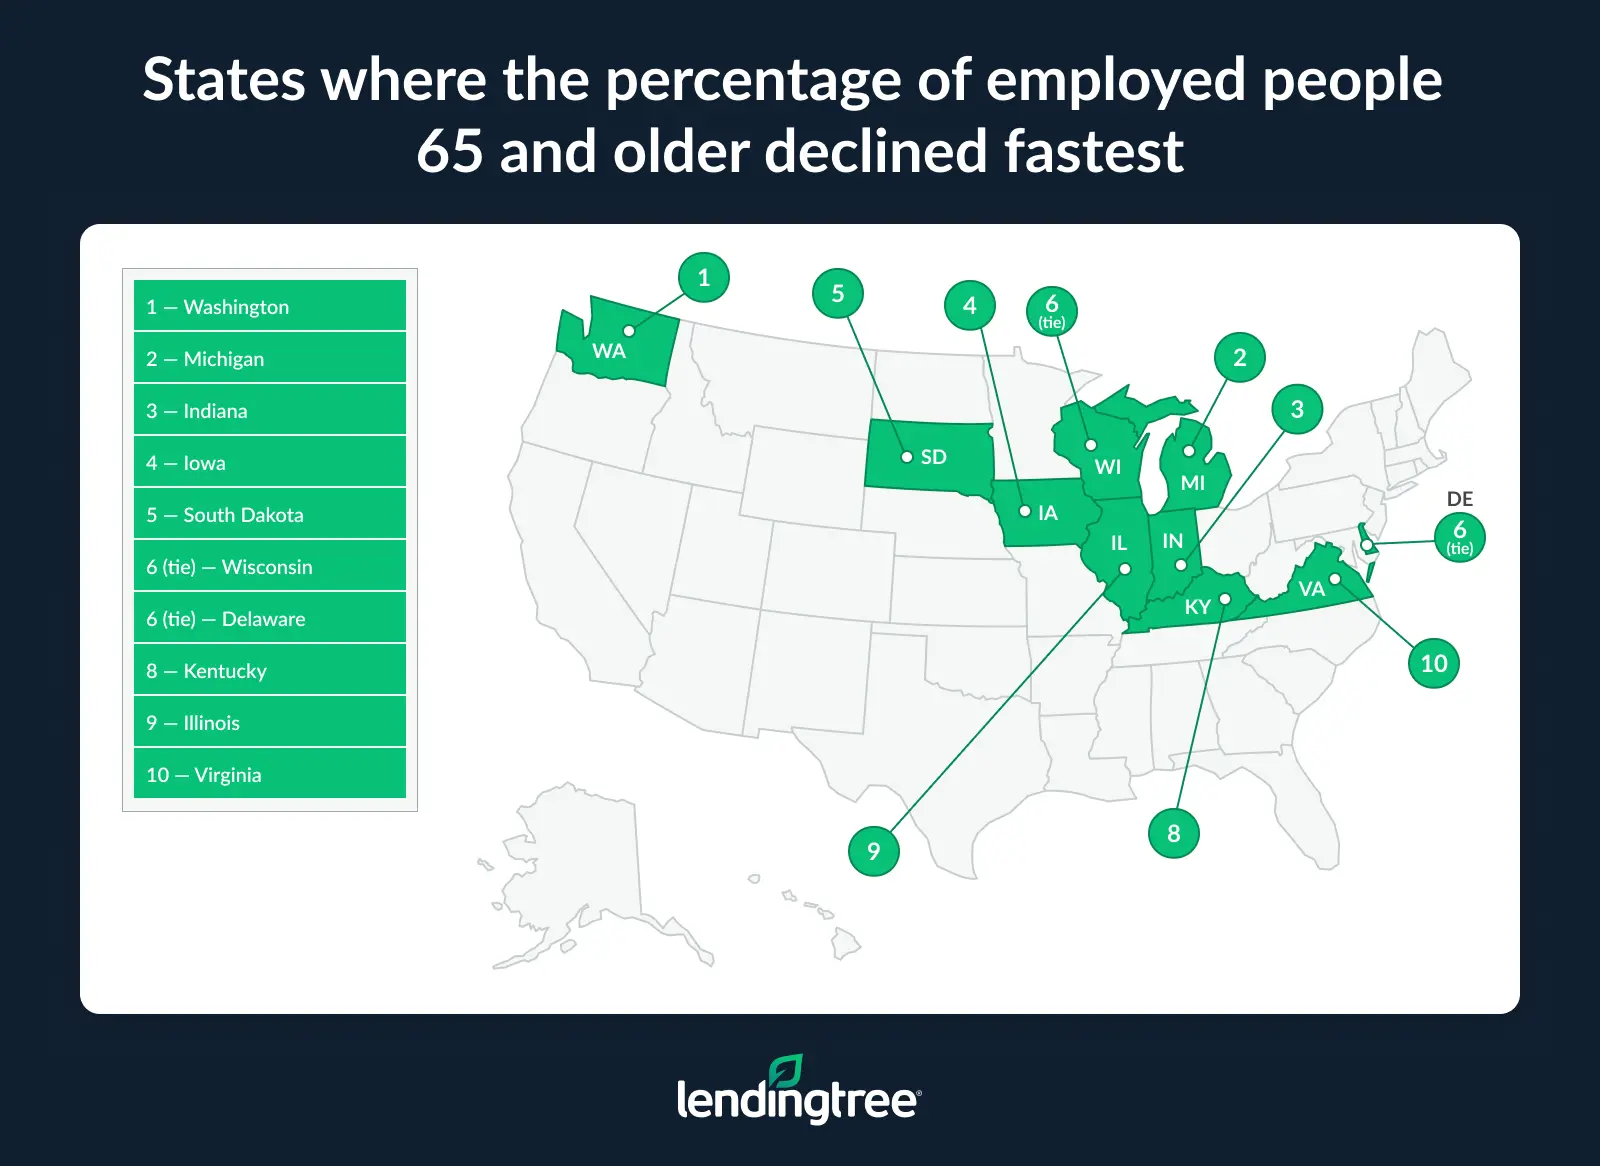
Washington also saw the largest decline in 65-and-older workers, dropping 7.5 percentage points from 19.1% in 2023. In 2023, Washington ranked ahead of 21 states in the share of residents 65 and older who were employed, with West Virginia posting the nation’s lowest rate at 11.7%. By 2025, Washington had fallen all the way to the bottom of the list.
In all, 19 states saw employment among retirement-age workers decrease by at least one percentage point. Aside from Washington, Midwestern states saw the biggest decreases, led by Michigan (down 5.8 points), Indiana (down 4.1 points) and Iowa (down 3.7 points).
States where retirement-age residents are rejoining the workforce
| Rank | State | % employed, 2025 | % employed, 2023 | % point change, 2023 to 2025 |
|---|---|---|---|---|
| 1 | Nebraska | 31.3% | 21.9% | 9.4 |
| 2 | Maine | 23.7% | 16.1% | 7.6 |
| 3 | Alaska | 25.0% | 18.5% | 6.5 |
| 4 | West Virginia | 17.8% | 11.7% | 6.2 |
| 5 | Hawaii | 23.2% | 19.1% | 4.1 |
| 6 | New Mexico | 18.3% | 14.3% | 4.0 |
| 7 | District of Columbia | 23.3% | 20.3% | 3.0 |
| 7 | New Hampshire | 20.4% | 17.4% | 3.0 |
| 9 | Tennessee | 18.3% | 15.4% | 2.9 |
| 10 | Nevada | 22.6% | 20.0% | 2.6 |
| 10 | North Carolina | 18.9% | 16.4% | 2.6 |
| 12 | Mississippi | 16.1% | 14.3% | 1.9 |
| 13 | Ohio | 16.9% | 15.0% | 1.8 |
| 13 | Montana | 21.8% | 20.1% | 1.8 |
| 15 | North Dakota | 23.0% | 21.3% | 1.7 |
| 16 | Wyoming | 20.5% | 19.0% | 1.5 |
| 16 | Texas | 21.2% | 19.8% | 1.5 |
| 18 | Rhode Island | 21.9% | 20.5% | 1.4 |
| 19 | Alabama | 17.7% | 16.5% | 1.2 |
| 20 | Minnesota | 20.5% | 19.6% | 0.9 |
| 21 | Arkansas | 17.0% | 16.1% | 0.8 |
| 21 | Arizona | 14.1% | 13.4% | 0.8 |
| 23 | Massachusetts | 23.0% | 22.3% | 0.7 |
| 24 | Maryland | 26.4% | 25.8% | 0.6 |
| 25 | Missouri | 19.6% | 19.2% | 0.3 |
| 25 | South Carolina | 16.6% | 16.3% | 0.3 |
| 25 | Kansas | 19.5% | 19.2% | 0.3 |
| 28 | Pennsylvania | 18.6% | 18.5% | 0.2 |
| 29 | Vermont | 24.1% | 24.0% | 0.1 |
| 30 | California | 17.7% | 17.7% | 0.0 |
| 31 | Georgia | 18.9% | 19.3% | -0.4 |
| 32 | Utah | 20.0% | 20.9% | -0.9 |
| 33 | Idaho | 14.8% | 15.8% | -1.0 |
| 33 | Florida | 18.3% | 19.3% | -1.0 |
| 35 | Louisiana | 18.3% | 19.5% | -1.1 |
| 36 | Oklahoma | 22.1% | 23.4% | -1.3 |
| 36 | New York | 20.1% | 21.5% | -1.3 |
| 38 | Colorado | 22.1% | 23.6% | -1.5 |
| 39 | Oregon | 18.3% | 19.9% | -1.6 |
| 40 | New Jersey | 20.9% | 22.7% | -1.8 |
| 41 | Connecticut | 21.4% | 23.3% | -1.9 |
| 42 | Virginia | 18.8% | 20.8% | -2.0 |
| 43 | Illinois | 18.1% | 20.5% | -2.3 |
| 44 | Kentucky | 15.2% | 17.8% | -2.5 |
| 45 | Delaware | 15.9% | 19.0% | -3.0 |
| 45 | Wisconsin | 14.1% | 17.1% | -3.0 |
| 47 | South Dakota | 27.5% | 31.1% | -3.6 |
| 48 | Iowa | 20.6% | 24.4% | -3.7 |
| 49 | Indiana | 12.6% | 16.7% | -4.1 |
| 50 | Michigan | 15.3% | 21.2% | -5.8 |
| 51 | Washington | 11.6% | 19.1% | -7.5 |
Older workers are especially common in certain occupations, including politics
Breaking down the rates by occupation, we found even more variation in the percentage of workers 65 and older than we did at the state level.
Broadcast announcers and radio disc jockeys have the highest share, with 44.4% of people employed in that occupation being 65 or older. That’s more than four times the share seen among artists and related workers — the occupation at the bottom of the list at 10.9%.
Interestingly, legislators ranked second, with 38.9% of workers in that occupation being 65 and older. Only two other occupations — farmers, ranchers and other agricultural managers (32.2%) and funeral home managers (30.0%) — had at least 30% of workers who were 65 or older.
Occupations most reliant on older workers
| Rank | Occupation | % of workers 65 and older |
|---|---|---|
| 1 | Broadcast announcers and radio disc jockeys | 44.4% |
| 2 | Legislators | 38.9% |
| 3 | Farmers, ranchers and other agricultural managers | 32.2% |
| 4 | Funeral home managers | 30.0% |
| 5 | Clinical and counseling psychologists | 26.3% |
| 6 | Other psychologists | 23.0% |
| 7 | Judges, magistrates and other judicial workers | 21.1% |
| 8 | Musicians and singers | 20.4% |
| 9 | Clergy | 20.2% |
| 10 | Mining and geological engineers, including mining safety engineers | 20.0% |
| 10 | Judicial law clerks | 20.0% |
| 12 | Chiropractors | 19.7% |
| 13 | Religious workers, all other | 19.5% |
| 14 | Floral designers | 18.4% |
| 15 | Nurse midwives | 18.2% |
| 16 | Music directors and composers | 17.2% |
| 17 | Property appraisers and assessors | 17.1% |
| 18 | Court reporters and simultaneous captioners | 16.7% |
| 19 | Property, real estate and community association managers | 16.5% |
| 20 | Library technicians | 16.1% |
| 21 | Radiologists | 15.8% |
| 22 | Surgeons | 15.1% |
| 23 | Acupuncturists | 15.0% |
| 24 | Tax preparers | 14.9% |
| 25 | Directors, religious activities and education | 14.6% |
| 25 | Optometrists | 14.6% |
| 27 | Nuclear engineers | 14.3% |
| 27 | Social science research assistants | 14.3% |
| 27 | Commercial and industrial designers | 14.3% |
| 30 | Lawyers | 14.1% |
| 30 | Facilities managers | 14.1% |
| 32 | Postsecondary teachers | 13.6% |
| 33 | Marine engineers and naval architects | 13.3% |
| 34 | Writers and authors | 13.2% |
| 34 | Broadcast, sound and lighting technicians | 13.2% |
| 36 | Chief executives | 13.0% |
| 37 | Mathematicians | 12.5% |
| 38 | Veterinarians | 12.1% |
| 39 | Librarians and media collections specialists | 11.8% |
| 39 | Disc jockeys, except radio | 11.8% |
| 41 | Management analysts | 11.7% |
| 42 | Cost estimators | 11.6% |
| 42 | Actors | 11.6% |
| 44 | Surveying and mapping technicians | 11.5% |
| 44 | Dentists | 11.5% |
| 46 | Other educational instruction and library workers | 11.3% |
| 47 | Respiratory therapists | 11.2% |
| 47 | Other physicians | 11.2% |
| 49 | Umpires, referees and other sports officials | 11.1% |
| 50 | Artists and related workers | 10.9% |
6 tips to put yourself in a stronger position for retirement
For many Americans, working past 65 is a choice driven by passion, purpose or the desire to stay active. For others, however, it’s a financial necessity. While no one can perfectly predict what retirement will look like decades down the road, there are steps people can take now to improve their odds of having more flexibility later in life.
The good news is that preparing for retirement isn’t only about building a bigger savings account. Long-term financial security is often shaped by a combination of smart money habits, good health and career flexibility. Here are a few ways Americans can put themselves in a stronger position for the future and make the best of the situation if working later in life becomes part of the plan.
- Start preparing for retirement earlier than you think you need to: One of the biggest reasons people continue working later in life is financial necessity. Building retirement savings consistently, even in small amounts, can make a huge difference over time because of compound growth. Increasing retirement contributions after raises, paying down high-interest debt and avoiding lifestyle inflation can all help create more flexibility later in life.
- Protect your health as much as your finances: This is extremely important, but it often gets overlooked. The ability to retire comfortably isn’t just about money. Good physical and mental health can reduce medical expenses, preserve quality of life and give people more choices as they age. Prioritizing preventive care, exercise, sleep and stress management during working years can pay dividends long after retirement age arrives.
- Build multiple sources of income before retirement: This may certainly be easier said than done, but it can be a game-changer. Relying solely on Social Security or a single retirement account can leave people vulnerable to inflation, market swings or unexpected expenses. Developing additional income streams through investments, side hustles or other means can provide added security and reduce the pressure to keep working full time later in life.
- Knock down your debts as much as possible: Of course, this may be far easier said than done as well, but it’s critically important. Paying down debt is challenging even when you’re in your peak earning years. It becomes a far-steeper hill to climb in retirement, when you may be on a fixed income. Consider using a 0% balance transfer credit card or a low-interest personal loan to dramatically reduce your interest payments and turbocharge your debt payoff. Doing so can provide much-needed breathing room in your finances.
- If working later in life becomes necessary, look for flexibility and purpose: Not everyone who works past 65 does so reluctantly. Some people continue working because they enjoy the structure, social connection or sense of purpose their jobs provide. If retirement isn’t financially possible or just isn’t appealing, seeking flexible, lower-stress or passion-driven work can make the experience far more rewarding and sustainable.
- Keep your skills current: Workers who stay adaptable often have more choices later in life. Continuing to learn new technology, maintain professional networks and develop transferable skills can make it easier to shift into part-time, freelance or less physically demanding roles as retirement age approaches.
Methodology
Researchers analyzed the U.S. Census Bureau Current Population Survey (CPS) Annual Social and Economic Supplement (ASEC) for 2023, 2024 and 2025 to find the employment status of Americans 65 and older.
Specifically, we ranked the states by the rate of residents who are retired and who are employed, and where those figures changed the most between 2023 and 2025.
Additionally, we used the U.S. Bureau of Labor Statistics (BLS) Current Population Survey (CPS) to find the jobs with the highest rates of workers 65 and older.
Get debt consolidation loan offers from up to 5 lenders in minutes