These States Offer the Worst Access to High-Quality Prenatal and Maternal Care


Where a woman lives can shape how easily she gets prenatal checkups, finds an in-network OB-GYN or delivers at a hospital with strong maternity practices — and a LendingTree analysis shows that access and quality are improving in some states while worsening in others.
Using measures spanning insurance coverage, provider availability and hospital performance, LendingTree ranked 49 states (Rhode Island was excluded because of a lack of new quality data) to determine where pregnant women and those giving birth are best — and worst — served. Here’s what we found.
- Six of the 10 states offering the worst access to high-quality prenatal and maternal care are in the South: Texas, Arkansas, Oklahoma, Alabama, Florida and Georgia.
- Wyoming has the worst overall maternal care access, falling from 40th in our 2024 report to 49th. Its average Merit-based Incentive Payment System (MIPS) score among OB-GYN specialists is 76.9, compared with 85.5 nationally, while its average hospital maternity practice score is 73, versus 82 nationally.
- Texas ranks third-worst and has the nation’s lowest insurance coverage rate among women ages 18 to 44. Its rate of 77.5% is 10.9 percentage points below the national rate of 88.4%. Texas also has the second-lowest primary care provider rate, at 66.0%.
- Mississippi has the highest infant mortality rate. The state has 9.7 infant deaths per 1,000 live births, compared with 5.5 nationally. New Hampshire has the lowest rate, at 3.0. Meanwhile, the U.S. maternal mortality rate was 17.9 per 100,000 live births in 2024, up 2.9% from 17.4 in 2018.
- New England states account for half of the top 10 states with the best maternal care access. Vermont and Massachusetts rank first and second, while Maine, Connecticut and New Hampshire rank fourth, sixth and seventh, respectively.
- Vermont offers the best access to high-quality prenatal and maternal care, rising from sixth in 2024 to first. The state performs above the national average across all six measures analyzed, including adequate prenatal care for 86.8% of births, versus 75.0% nationally.
The South dominates the bottom of the rankings
Geography plays an outsized role in maternal care access, particularly among the lowest-ranked states. Texas, Arkansas, Oklahoma, Alabama, Florida and Georgia — six of the 10 lowest-ranked states — are in the South. The concentration points to a regional pattern in how insurance coverage, Medicaid eligibility and limited provider networks affect pregnant patients across the region.
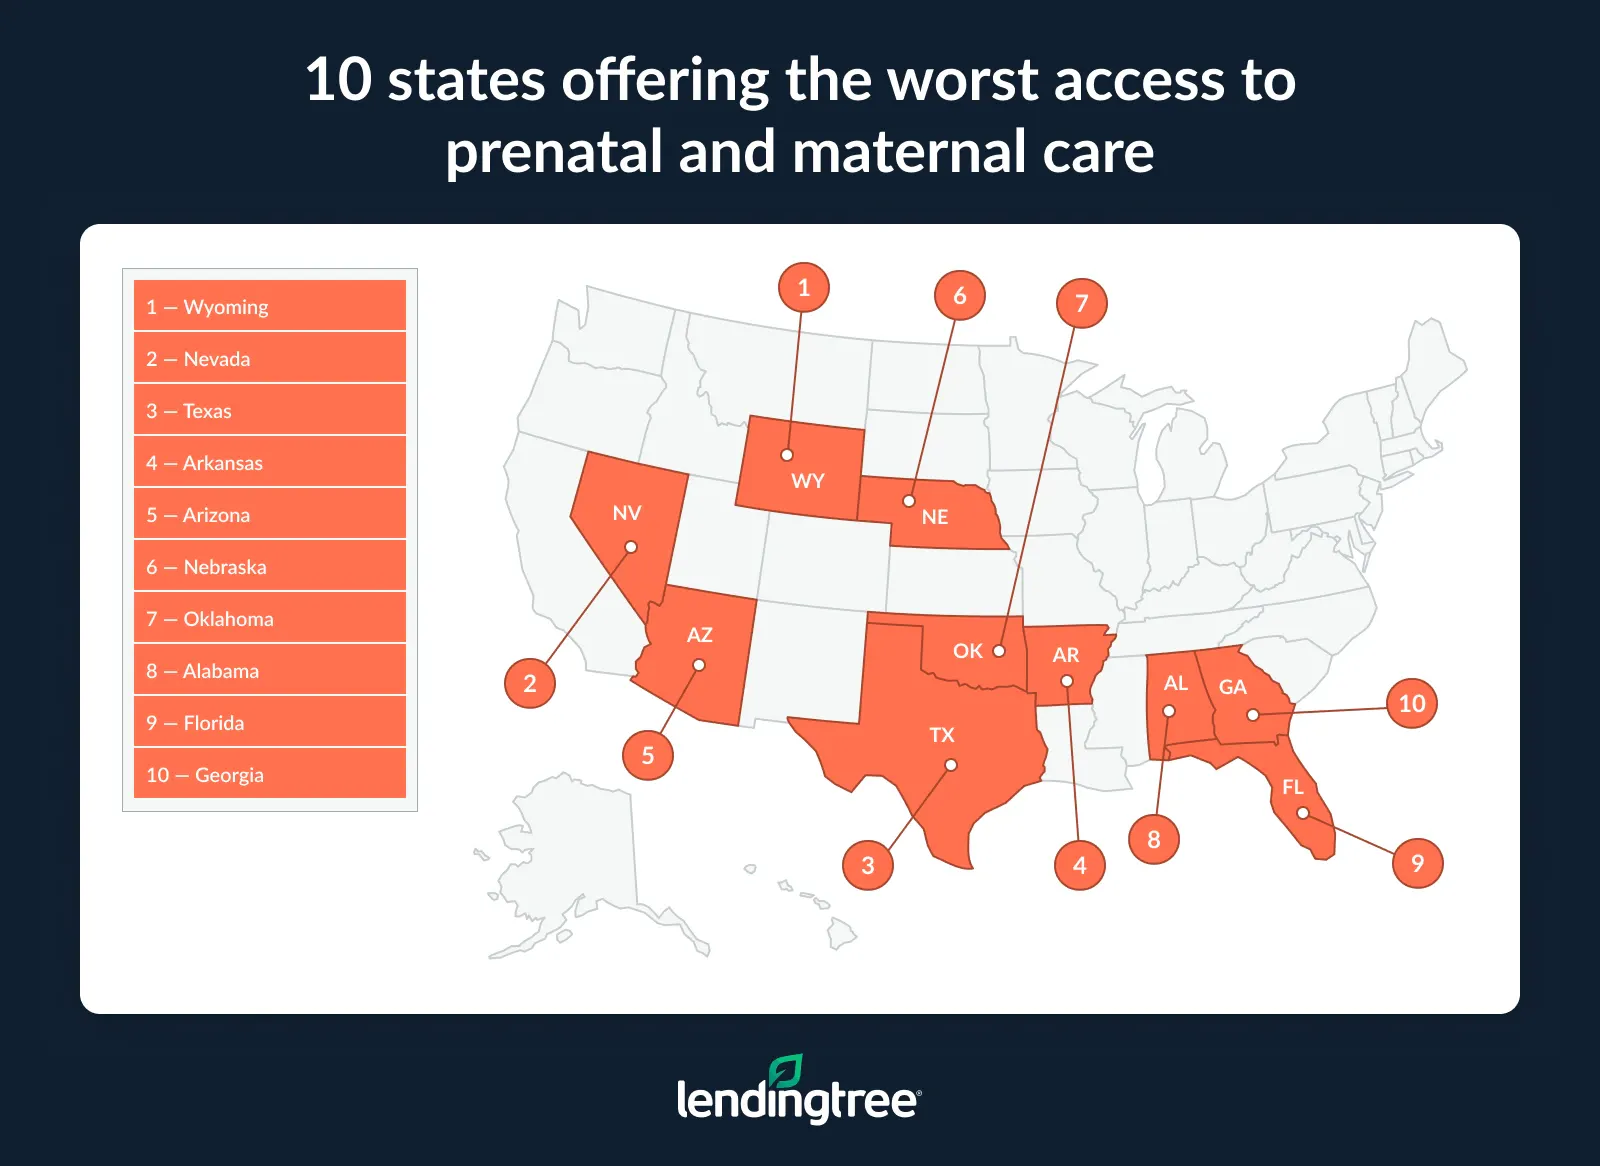
Medicaid expansion status is often a dividing line, LendingTree health insurance expert Cate Deventer says.
“In states that haven’t expanded Medicaid access, it can be much harder to qualify for coverage, even if you’re pregnant,” she says. “Even having Medicaid, group insurance or private insurance doesn’t guarantee that an OB-GYN is accessible. Patients can be limited by their plan’s network or live in areas where maternal care isn’t widely available. While federal rules require insurance plans to meet certain network standards, doctor availability varies by where you live.”
Wyoming has fallen to last
Wyoming now ranks last for maternal care access in the country, sliding from 40th in LendingTree’s 2024 research to 49th.
The state’s OB-GYN specialists have an average Merit-based Incentive Payment System (MIPS) score of 76.9, well below the national average of 85.5, and its hospitals average a maternity practice score of 73, compared with 82 nationally. MIPS incentivizes doctors to focus on the quality of care they deliver under Medicare.
Wyoming’s numbers lag on access, too: While 82.2% of women ages 18 to 44 have insurance coverage, just 73.7% have a primary care provider, and there are only 45.6 maternal care providers for every 100,000 women ages 15 and older.
That thin provider base hits rural patients hardest, Deventer says. “In rural areas, patients may face issues finding providers in their plan’s network or close enough to be accessible,” she says. “They may have a long drive for maternal appointments and worries about whether care is close enough to home should an emergency arise. That can push families toward out-of-network providers, which can come with an added cost.”
Texas’ uninsured rate keeps it near the bottom
Texas ranks third-worst for maternal care access, driven largely by its low insurance coverage rate. Just 77.5% of Texas women ages 18 to 44 have coverage — the lowest rate in the nation and 10.9 percentage points below the 88.4% national average.
Primary care access isn’t much better: Only 66.0% of Texas women ages 18 to 44 have a regular provider, the second-lowest rate among all states. Prenatal care also lags: Only 67.7% of births in Texas involve adequate prenatal care, a lower share than in most other states in the bottom 10.
10 states offering the worst access to prenatal and maternal care
| Rank | State | % of women 18 to 44 with insurance coverage (access) | % of women 18 to 44 with primary care provider (access) | Maternal care providers per 100,000 women 15 and older (access) | % of births with adequate prenatal care (access) | Average Merit-based Incentive Payment System score among OB-GYN specialists (quality) | Average Maternity Practices in Infant Nutrition and Care score among hospitals (quality) |
|---|---|---|---|---|---|---|---|
| 1 | Wyoming | 82.2% | 73.7% | 45.6 | 77.1% | 76.9 | 73 |
| 2 | Nevada | 81.5% | 65.1% | 36.6 | 73.3% | 81.5 | 76 |
| 3 | Texas | 77.5% | 66.0% | 38.9 | 67.7% | 81.4 | 81 |
| 4 | Arkansas | 86.0% | 81.9% | 30.3 | 73.6% | 82.4 | 71 |
| 5 | Arizona | 86.0% | 71.1% | 41.5 | 71.9% | 81.6 | 76 |
| 6 | Nebraska | 89.6% | 77.3% | 41.6 | 78.9% | 79.2 | 75 |
| 7 | Oklahoma | 81.5% | 76.1% | 35.2 | 78.9% | 82.0 | 79 |
| 8 | Alabama | 85.8% | 76.6% | 29 | 72.9% | 87.8 | 76 |
| 9 | Florida | 83.9% | 69.3% | 41.6 | 65.9% | 86.0 | 85 |
| 10 | Georgia | 83.9% | 73.2% | 47.2 | 73.2% | 87.3 | 78 |
Going without insurance leaves patients paying out of pocket at every step, Deventer says.
“Without insurance, patients don’t have a health plan to help pay for the cost of prenatal visits, tests and other maternity care,” she says. “That means they either have to pay the full cost for appointments and tests or negotiate with their medical office for a lower price or payment plan. As a result, uninsured patients may skip important appointments and tests for financial reasons.”
Mississippi’s infant mortality rate is the nation’s highest
While Mississippi didn’t make the bottom 10 in our overall access-and-quality ranking, its infant mortality rate highlights an important dimension of maternal and infant health that the ranking doesn’t capture. Infant mortality isn’t one of the six access and quality measures used to calculate our rankings, but it provides additional context on health outcomes that can be influenced by factors that extend beyond access to care and the quality measures analyzed.
The state has 9.7 infant deaths per 1,000 live births, nearly double the national rate of 5.5. The other states with the 10 highest infant mortality rates are:
- Arkansas (8.3)
- Delaware (7.8)
- Louisiana (7.6)
- South Carolina (7.5)
- Oklahoma (7.4)
- South Dakota (7.3)
- Alabama (7.1)
- Alaska (6.8)
- Ohio (6.7)
New Hampshire, by contrast, has the lowest infant mortality rate in the country at 3.0. New Jersey (3.4) and Massachusetts (3.5) follow, the only other states with rates below 4.0.
Maternal mortality, which also isn’t included in the six measures used for the rankings, offers additional context on outcomes for mothers. Nationally, the U.S. maternal mortality rate was 17.9 deaths per 100,000 live births in 2024, up 2.9% from 17.4 in 2018.
Full rankings: Infant mortality rates by state
| Rank | State | Infant deaths per 1,000 live births |
|---|---|---|
| 1 | Mississippi | 9.7 |
| 2 | Arkansas | 8.3 |
| 3 | Delaware | 7.8 |
| 4 | Louisiana | 7.6 |
| 5 | South Carolina | 7.5 |
| 6 | Oklahoma | 7.4 |
| 7 | South Dakota | 7.3 |
| 8 | Alabama | 7.1 |
| 9 | Alaska | 6.8 |
| 10 | Ohio | 6.7 |
| 11 | West Virginia | 6.6 |
| 12 | Nebraska | 6.5 |
| 13 | Missouri | 6.4 |
| 13 | Tennessee | 6.4 |
| 13 | Georgia | 6.4 |
| 16 | Indiana | 6.3 |
| 16 | Michigan | 6.3 |
| 18 | North Carolina | 6.2 |
| 18 | Montana | 6.2 |
| 20 | District of Columbia | 6.0 |
| 20 | Virginia | 6.0 |
| 22 | North Dakota | 5.9 |
| 22 | Wisconsin | 5.9 |
| 22 | Kentucky | 5.9 |
| 22 | Kansas | 5.9 |
| 26 | Florida | 5.7 |
| 26 | Illinois | 5.7 |
| 26 | Texas | 5.7 |
| 26 | Pennsylvania | 5.7 |
| 30 | Vermont | 5.6 |
| 31 | Maryland | 5.5 |
| 32 | Arizona | 5.4 |
| 33 | Nevada | 5.3 |
| 34 | New Mexico | 5.2 |
| 34 | Utah | 5.2 |
| 36 | Oregon | 4.9 |
| 37 | Washington | 4.8 |
| 38 | Idaho | 4.7 |
| 39 | Minnesota | 4.6 |
| 39 | Wyoming | 4.6 |
| 41 | Colorado | 4.5 |
| 41 | Connecticut | 4.5 |
| 41 | Iowa | 4.5 |
| 41 | Maine | 4.5 |
| 45 | Hawaii | 4.4 |
| 46 | Rhode Island | 4.2 |
| 47 | California | 4.2 |
| 48 | New York | 4.0 |
| 49 | Massachusetts | 3.5 |
| 50 | New Jersey | 3.4 |
| 51 | New Hampshire | 3.0 |
New England claims half of the top 10
On the other end of the spectrum, New England states make up half of the 10 highest-ranked states for prenatal and maternal care access. Vermont and Massachusetts take the top two spots, while Maine, Connecticut and New Hampshire rank fourth, sixth and seventh, respectively.
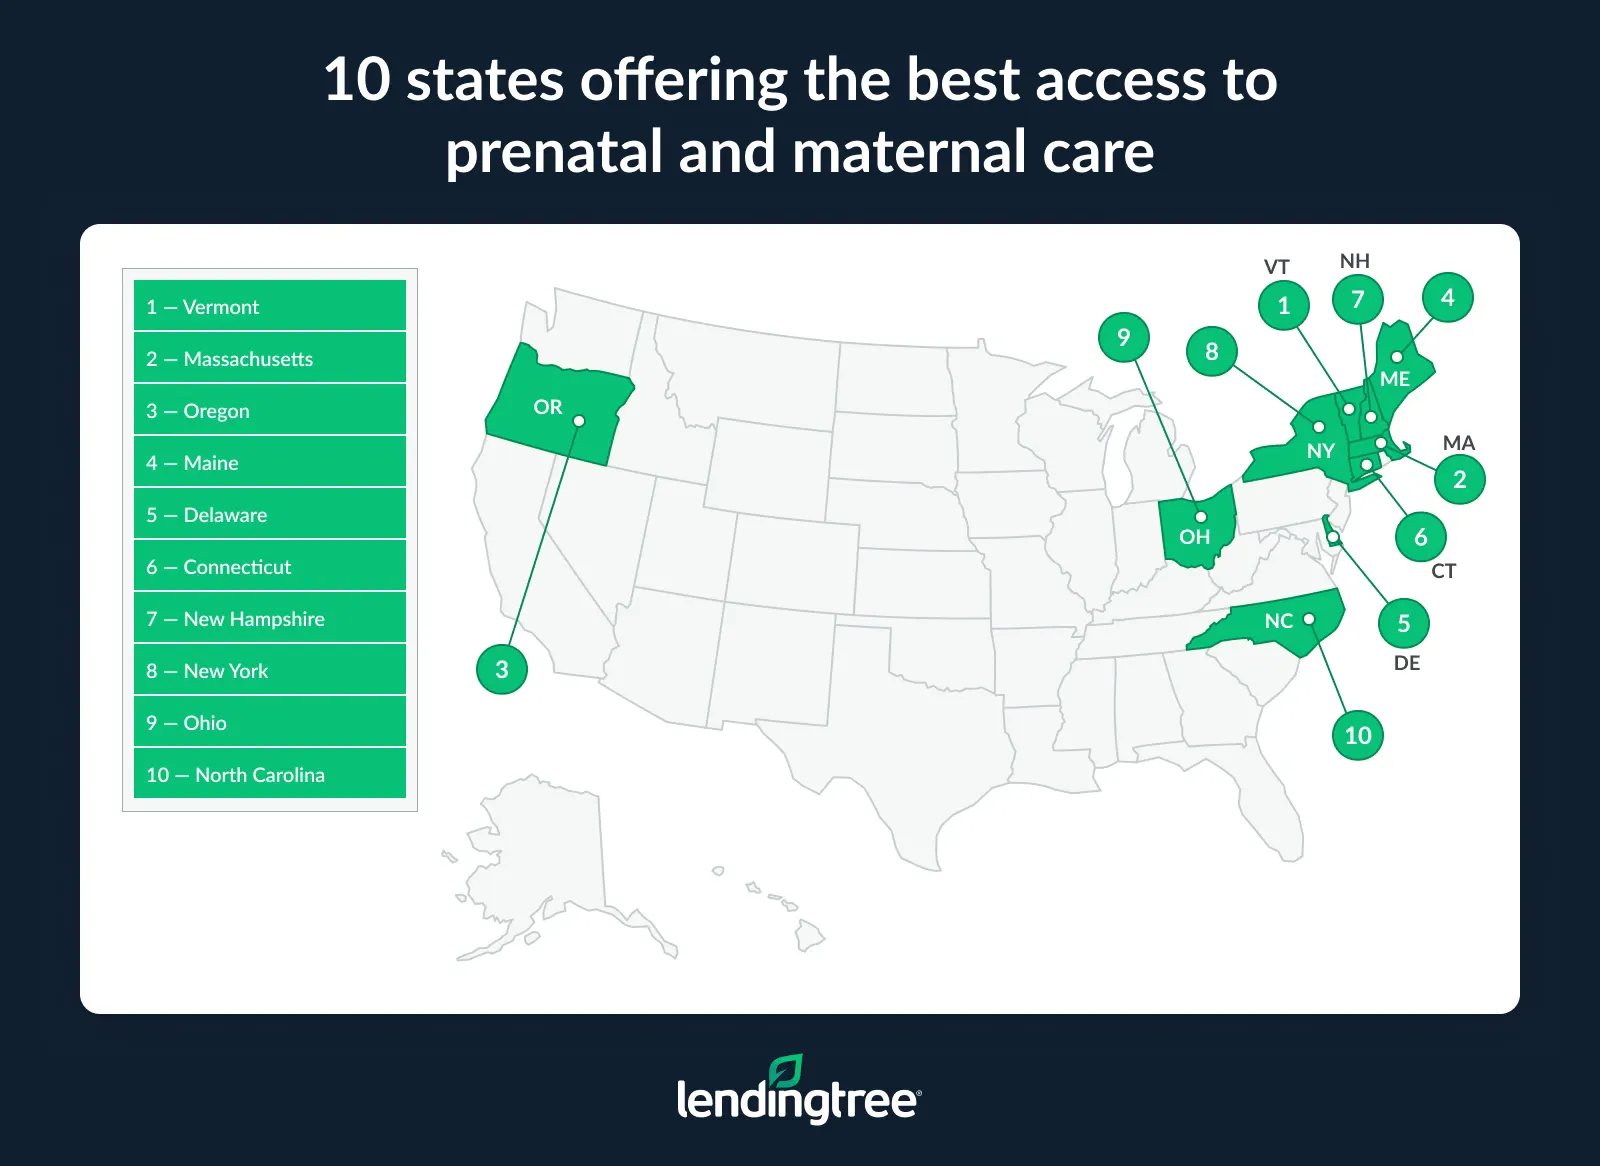
Massachusetts, the No. 2 state, has 95.8% insurance coverage among women ages 18 to 44 and an OB-GYN MIPS score of 88.9. Meanwhile, Maine has the highest primary care provider rate in the U.S., at 90.6%, along with an OB-GYN MIPS score of 92.3.
Connecticut reports 93.0% insurance coverage and a hospital maternity practice score of 88, while New Hampshire has the highest rate of adequate prenatal care among the top 10, at 87.2%. Beyond New England, Oregon — at No. 3 overall — has the highest concentration of maternal care providers among the top 10, at 72.5 per 100,000 women ages 15 and older.
North Carolina ranks No. 10 — the only Southern state to make the list. It also has the highest OB-GYN MIPS score among the top 10, at 92.9.
Vermont jumps from 6th to 1st place
Vermont takes the top overall spot this year, up from sixth place in our 2024 research. The state outperforms the national average on all six measures used in the ranking, including adequate prenatal care for 86.8% of births, compared with 75.0% nationally.
10 states offering the best access to prenatal and maternal care
| Rank | State | % of women 18 to 44 with insurance coverage (access) | % of women 18 to 44 with primary care provider (access) | Maternal care providers per 100,000 women 15 and older (access) | % of births with adequate prenatal care (access) | Average Merit-based Incentive Payment System score among OB-GYN specialists (quality) | Average Maternity Practices in Infant Nutrition and Care score among hospitals (quality) |
|---|---|---|---|---|---|---|---|
| 1 | Vermont | 96.0% | 89.7% | 69.3 | 86.8% | 90.7 | 90 |
| 2 | Massachusetts | 95.8% | 87.0% | 59.6 | 81.7% | 88.9 | 89 |
| 3 | Oregon | 94.7% | 82.2% | 72.5 | 78.8% | 89.1 | 87 |
| 4 | Maine | 88.3% | 90.6% | 59.6 | 84.6% | 92.3 | 82 |
| 5 | Delaware | 92.9% | 80.4% | 48.2 | 78.0% | 86.7 | 93 |
| 6 | Connecticut | 93.0% | 82.8% | 66.1 | 85.7% | 84.3 | 88 |
| 7 | New Hampshire | 91.1% | 89.1% | 70.8 | 87.2% | 78.9 | 90 |
| 8 | New York | 94.1% | 81.0% | 56.3 | 75.2% | 89.0 | 84 |
| 9 | Ohio | 92.7% | 83.2% | 46.6 | 79.8% | 85.5 | 85 |
| 10 | North Carolina | 85.8% | 77.5% | 48.3 | 76.8% | 92.9 | 84 |
Vermont also has a 96.0% insurance coverage rate among women ages 18 to 44, along with an 89.7% rate of women in that age group with a primary care provider, 69.3 maternal care providers per 100,000 women ages 15 and older, an OB-GYN MIPS score of 90.7 and a hospital maternity practice score of 90.
Full rankings: States offering the best/worst access to prenatal and maternal care
| Rank | State | % of women 18 to 44 with insurance coverage (access) | % of women 18 to 44 with primary care provider (access) | Maternal care providers per 100,000 women 15 and older (access) | % of births with adequate prenatal care (access) | Average Merit-based Incentive Payment System score among OB-GYN specialists (quality) | Average Maternity Practices in Infant Nutrition and Care score among hospitals (quality) | Access score | Quality score | Final score |
|---|---|---|---|---|---|---|---|---|---|---|
| 1 | Vermont | 96.0% | 89.7% | 69.3 | 86.8% | 90.7 | 90 | 85.8 | 87.4 | 86.6 |
| 2 | Massachusetts | 95.8% | 87.0% | 59.6 | 81.7% | 88.9 | 89 | 74.3 | 80.7 | 77.5 |
| 3 | Oregon | 94.7% | 82.2% | 72.5 | 78.8% | 89.1 | 87 | 69.4 | 76.6 | 73.0 |
| 4 | Maine | 88.3% | 90.6% | 59.6 | 84.6% | 92.3 | 82 | 71.3 | 73.4 | 72.3 |
| 5 | Delaware | 92.9% | 80.4% | 48.2 | 78.0% | 86.7 | 93 | 56.5 | 84.3 | 70.4 |
| 6 | Connecticut | 93.0% | 82.8% | 66.1 | 85.7% | 84.3 | 88 | 73 | 66.9 | 69.9 |
| 7 | New Hampshire | 91.1% | 89.1% | 70.8 | 87.2% | 78.9 | 90 | 79.8 | 57.8 | 68.8 |
| 8 | New York | 94.1% | 81.0% | 56.3 | 75.2% | 89.0 | 84 | 58.4 | 69.6 | 64.0 |
| 9 | Ohio | 92.7% | 83.2% | 46.6 | 79.8% | 85.5 | 85 | 60.4 | 63.1 | 61.7 |
| 10 | North Carolina | 85.8% | 77.5% | 48.3 | 76.8% | 92.9 | 84 | 43.3 | 79.3 | 61.3 |
| 11 | Wisconsin | 89.8% | 81.8% | 47.9 | 82.5% | 85.0 | 85 | 58.5 | 61.7 | 60.1 |
| 12 | Michigan | 89.3% | 86.5% | 57.4 | 77.3% | 88.9 | 79 | 60.1 | 58.0 | 59.0 |
| 13 | Washington | 88.5% | 81.6% | 57.6 | 71.0% | 87.3 | 86 | 47.7 | 69.9 | 58.8 |
| 14 | Montana | 93.8% | 80.7% | 54.2 | 78.1% | 84.2 | 84 | 60.0 | 57.5 | 58.7 |
| 14 | West Virginia | 91.4% | 83.4% | 41.1 | 81.8% | 91.7 | 76 | 59.2 | 58.3 | 58.7 |
| 16 | New Jersey | 93.2% | 80.7% | 46.9 | 73.0% | 87.4 | 84 | 51.5 | 65.5 | 58.5 |
| 17 | Minnesota | 91.4% | 80.8% | 59.4 | 81.0% | 85.0 | 81 | 61.8 | 52.5 | 57.1 |
| 18 | Louisiana | 89.3% | 84.4% | 41.6 | 73.8% | 86.1 | 85 | 49.2 | 64.6 | 56.9 |
| 19 | Colorado | 87.1% | 77.9% | 63.9 | 70.2% | 87.2 | 86 | 43.6 | 69.6 | 56.6 |
| 20 | Pennsylvania | 91.6% | 86.2% | 50.9 | 74.8% | 84.2 | 83 | 58.0 | 55.1 | 56.5 |
| 21 | Kentucky | 91.1% | 82.8% | 40.3 | 79.2% | 93.0 | 74 | 55.2 | 56.8 | 56.0 |
| 22 | Utah | 90.3% | 77.4% | 54 | 79.0% | 89.5 | 78 | 53.2 | 57.2 | 55.2 |
| 23 | California | 92.7% | 75.5% | 44.3 | 75.4% | 81.8 | 89 | 47.4 | 62.8 | 55.1 |
| 24 | Indiana | 89.5% | 83.5% | 42.3 | 78.9% | 83.8 | 83 | 54.2 | 54.0 | 54.1 |
| 25 | Illinois | 88.5% | 77.9% | 50.8 | 77.3% | 87.4 | 81 | 48.5 | 58.8 | 53.6 |
| 26 | South Carolina | 88.6% | 72.8% | 40.6 | 79.4% | 89.8 | 80 | 42.5 | 62.6 | 52.5 |
| 27 | Kansas | 85.1% | 83.7% | 41.7 | 84.2% | 83.7 | 81 | 54.1 | 49.3 | 51.7 |
| 28 | Idaho | 88.2% | 83.6% | 47.5 | 82.2% | 83.2 | 79 | 57.8 | 43.5 | 50.6 |
| 29 | North Dakota | 92.7% | 83.8% | 41.5 | 78.2% | 83.9 | 78 | 57.6 | 43.1 | 50.3 |
| 30 | Hawaii | 96.9% | 84.8% | 62.5 | 63.4% | 83.6 | 78 | 55.3 | 42.3 | 48.8 |
| 31 | New Mexico | 84.5% | 69.1% | 65.9 | 67.0% | 84.4 | 88 | 28.9 | 67.1 | 48.0 |
| 32 | Virginia | 88.7% | 77.6% | 47.5 | 79.5% | 81.4 | 82 | 49.7 | 45.9 | 47.8 |
| 33 | Alaska | 84.5% | 75.9% | 105.1 | 69.4% | 85.2 | 77 | 50.9 | 44.2 | 47.5 |
| 34 | Iowa | 92.1% | 80.3% | 39.1 | 84.1% | 82.9 | 76 | 58.8 | 36.0 | 47.4 |
| 35 | Mississippi | 82.1% | 77.2% | 32.2 | 79.3% | 81.6 | 87 | 35.6 | 57.8 | 46.7 |
| 36 | Missouri | 90.9% | 79.9% | 43.3 | 78.7% | 83.1 | 77 | 52.6 | 38.8 | 45.7 |
| 37 | Maryland | 94.7% | 83.4% | 59.9 | 76.3% | 73.2 | 83 | 63.8 | 27.3 | 45.5 |
| 38 | Tennessee | 85.5% | 77.1% | 42.5 | 74.3% | 89.5 | 76 | 38.0 | 52.7 | 45.3 |
| 39 | South Dakota | 91.0% | 83.7% | 41.9 | 76.6% | 82.0 | 75 | 53.8 | 31.4 | 42.6 |
| 40 | Georgia | 83.9% | 73.2% | 47.2 | 73.2% | 87.3 | 78 | 32.5 | 51.5 | 42.0 |
| 41 | Florida | 83.9% | 69.3% | 41.6 | 65.9% | 86.0 | 85 | 19.2 | 64.4 | 41.8 |
| 42 | Alabama | 85.8% | 76.6% | 29 | 72.9% | 87.8 | 76 | 32.0 | 48.3 | 40.1 |
| 43 | Oklahoma | 81.5% | 76.1% | 35.2 | 78.9% | 82.0 | 79 | 34.2 | 40.6 | 37.4 |
| 44 | Nebraska | 89.6% | 77.3% | 41.6 | 78.9% | 79.2 | 75 | 48.0 | 24.5 | 36.2 |
| 45 | Arizona | 86.0% | 71.1% | 41.5 | 71.9% | 81.6 | 76 | 29.9 | 32.6 | 31.2 |
| 46 | Arkansas | 86.0% | 81.9% | 30.3 | 73.6% | 82.4 | 71 | 38.6 | 23.3 | 30.9 |
| 47 | Texas | 77.5% | 66.0% | 38.9 | 67.7% | 81.4 | 81 | 8.7 | 43.6 | 26.1 |
| 48 | Nevada | 81.5% | 65.1% | 36.6 | 73.3% | 81.5 | 76 | 18.1 | 32.5 | 25.3 |
| 49 | Wyoming | 82.2% | 73.7% | 45.6 | 77.1% | 76.9 | 73 | 34.3 | 14.0 | 24.2 |
Planning ahead for maternity care costs: Top expert tips
Understanding your health insurance coverage early can help you avoid unexpected expenses throughout pregnancy, delivery and postpartum care. Deventer recommends taking these steps:
- Confirm coverage and your care team. “Review what your plan covers for prenatal, delivery and postpartum care and make sure your preferred doctor and hospital are in network,” Deventer says. “If they aren’t, consider your options during open enrollment.”
- Know your potential costs. “Check your deductible, copays, coinsurance and out-of-pocket maximum,” she says. “Understanding how these costs work can give you a better idea of how much you may need to pay out of pocket.”
- Check plan requirements. “Find out whether your plan requires referrals or prior authorization for certain tests, treatments or procedures,” she says. “Following those requirements can help you avoid unexpected bills.”
Methodology
LendingTree analysts created access and quality scores relevant to pregnant women and those giving birth across 49 states. Rhode Island was excluded because of a lack of new quality data.
The access score comprises four equally weighted measures:
- Percentage of women ages 18 to 44 with health insurance
- Percentage of women ages 18 to 44 with a primary care provider
- Number of obstetricians, gynecologists and midwives per 100,000 women ages 15 and older
- Percentage of live births receiving adequate or better prenatal care
The quality score comprises two equally weighted measures:
- Average Merit-based Incentive Payment System (MIPS) score among OB-GYN specialists
- Average statewide Maternity Practices in Infant Nutrition and Care (mPINC) score among hospitals
The analysis used data from the:
- U.S. Census Bureau/U.S. Bureau of Labor Statistics (BLS) Current Population Survey (March 2025)
- Centers for Disease Control and Prevention (CDC) Behavioral Risk Factor Surveillance System (BRFSS) (2022-23)
- Centers for Medicare & Medicaid Services (CMS) National Plan and Provider Enumeration System (NPPES) (September 2024)
- March of Dimes PeriStats (2024)
- CMS provider data
- CDC Maternity Practices in Infant Nutrition and Care (mPINC) state reports (2024)
- KFF
Infant and maternal mortality rates were determined separately from the access and quality rankings using CDC data. These mortality measures provide additional context on maternal and infant health outcomes but weren’t included in the calculations used to rank states. Infant mortality rates were sourced from the CDC’s state infant mortality statistics and the National Vital Statistics Reports. Maternal mortality rates were sourced from the CDC’s 2021 and 2024 reports.