Comparing Mortgage Offers Could Save Borrowers Tens of Thousands — Yet Many Don’t Negotiate
Buying a home is one of the biggest financial decisions many Americans will ever make, but too many buyers could leave tens of thousands of dollars on the table by skipping one simple step: shopping around.
A LendingTree analysis finds that borrowers who compare mortgage offers could save an average of $62,572 over the life of a 30-year, fixed-rate mortgage — yet many still fail to do so.
Here’s what we found.
- Borrowers could save an average of $62,572 over the life of a 30-year, fixed-rate mortgage by shopping around. That’s equivalent to $174 a month or $2,086 a year by choosing the best available offer. However, this is down from $80,024 in our early 2025 analysis, as rate spreads have narrowed and mortgage rates have declined.
- More mortgage offers mean more opportunities to save. The rate spread between borrowers receiving the lowest and highest average offered interest rates is 0.79 percentage points. But borrowers receiving six or more offers saw a spread of 0.98 percentage points, boosting potential monthly savings from $174 to $227.
- Borrowers in Hawaii ($89,621), New Jersey ($81,955) and California ($81,705) could benefit the most from comparing offers. Meanwhile, borrowers in New York ($32,909), West Virginia ($41,037) and Mississippi ($44,521) could see the lowest — but still significant — potential savings.
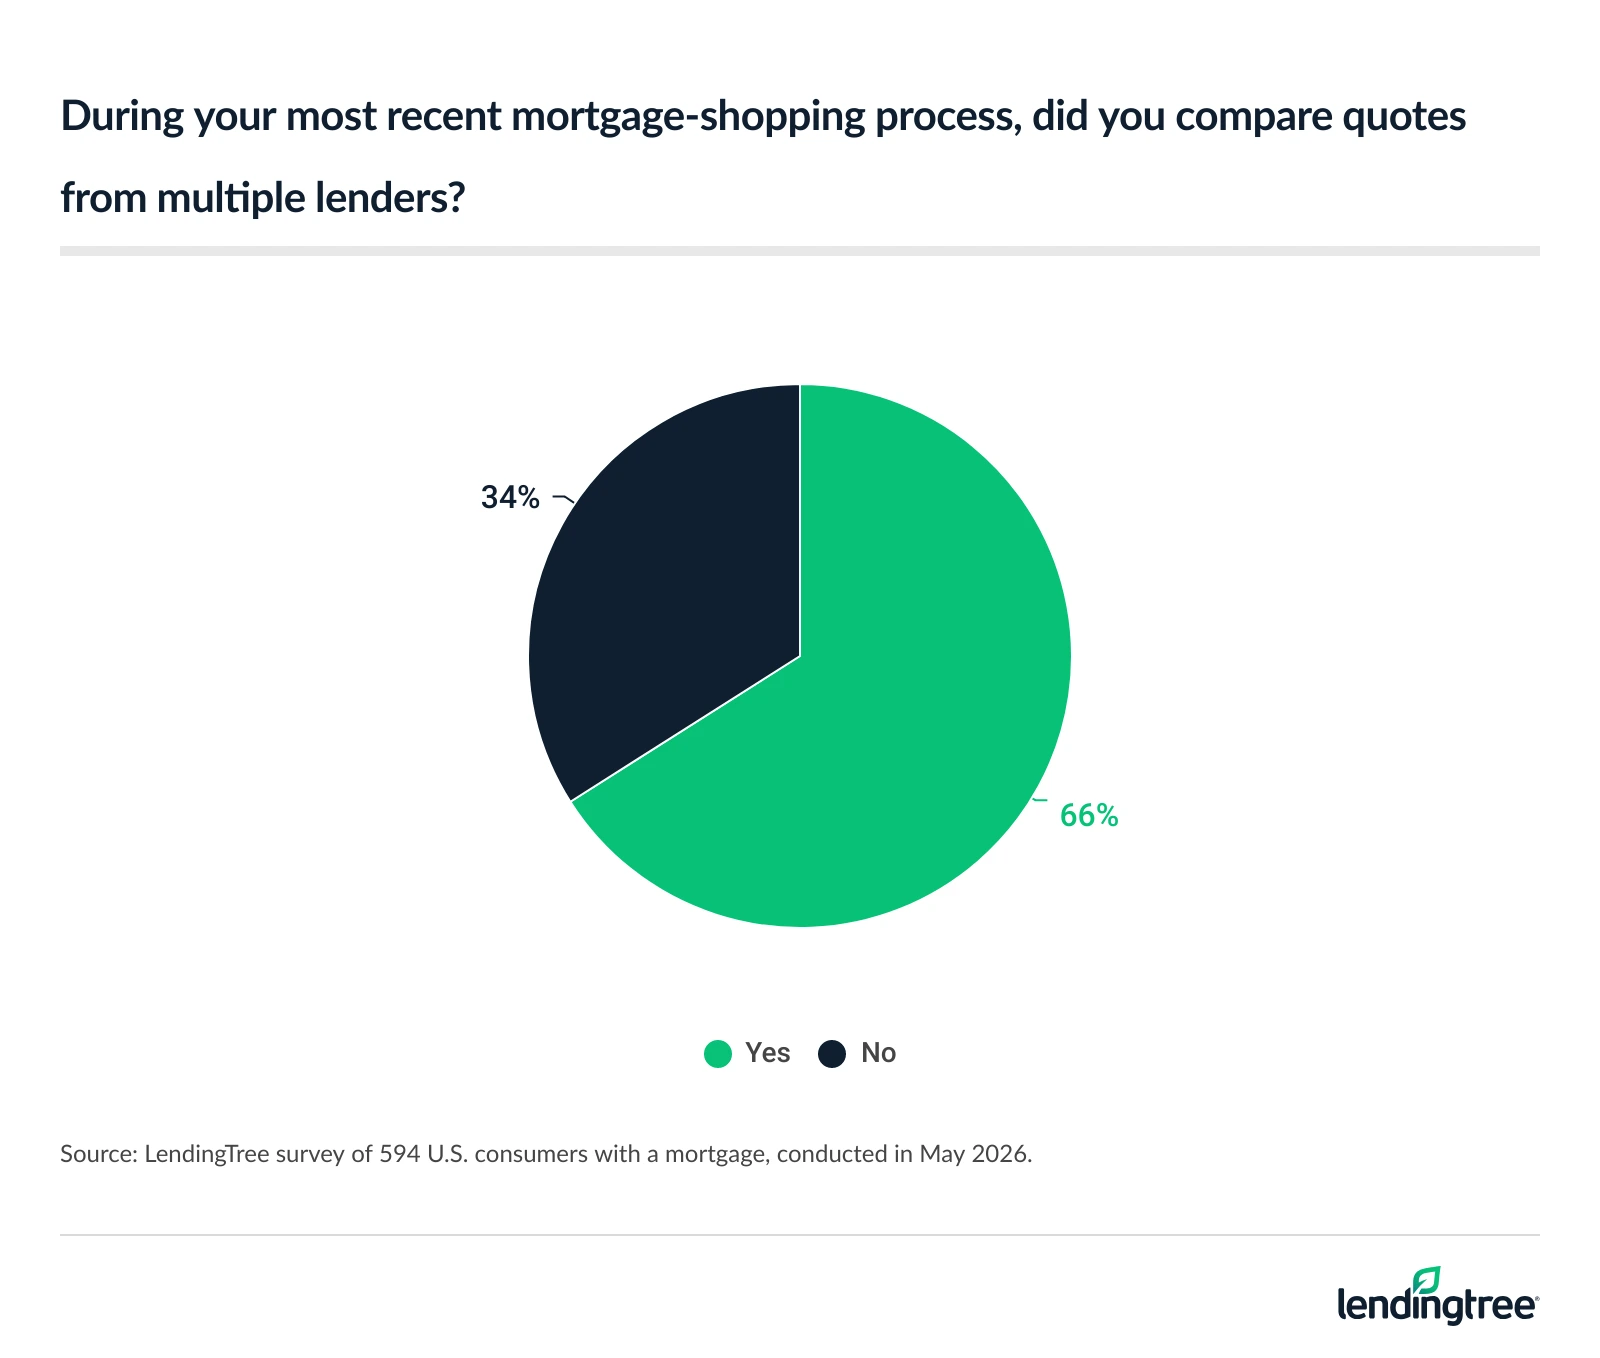
- Not all borrowers shop around or negotiate their mortgage. Two-thirds (66%) of mortgage holders compared quotes from multiple lenders during their most recent home loan shopping process, but only 54% tried to negotiate. Baby boomers are the least likely to negotiate at just 18%, compared with about 70% of Gen Zers and millennials. Men are also significantly more likely than women to negotiate (67% versus 36%).
- Most borrowers who negotiated focused on their interest rate (79%), and many negotiated closing costs or lender fees (62%). Among those who negotiated their rate, 93% lowered their monthly payment — including 37% who lowered it by $100 or more. Fee negotiators fared well, too: 34% reduced upfront costs by at least $2,000 — including 12% who saved $5,000 or more.
Shoppers could save an average of $62,572 over the life of a loan
The potential savings from comparing mortgage offers are substantial. Borrowers who receive the lowest available rate rather than the highest could save an average of $62,572 over a 30-year, fixed-rate mortgage — equivalent to $174 a month or $2,086 a year.
How much borrowers could save by shopping around for a mortgage (nationally)
| Avg. lowest offered interest rate | 5.93% |
| Avg. highest offered interest rate | 6.72% |
| Rate spread (percentage points) | 0.79 |
| Avg. requested mortgage amount | $337,187 |
| Monthly payment, lowest avg. rate | $2,006 |
| Monthly payment, highest avg. rate | $2,180 |
| Monthly savings | $174 |
| Yearly savings | $2,086 |
| Lifetime savings | $62,572 |
That’s equivalent to 78% of the median U.S. household income of $80,734 in 2024.
It’s also worth noting that the $62,572 figure is down from $80,024 in our early 2025 analysis, as rate spreads have narrowed and mortgage rates have declined.
So why don’t more borrowers shop around? Matt Schulz — LendingTree chief consumer finance analyst and author of “Ask Questions, Save Money, Make More: How to Take Control of Your Financial Life” — says people leave those savings on the table for many reasons.
“Some don’t know that shopping around makes a difference,” he says. “Some don’t know how to shop around. Some are nervous about asking and fear that doing so might make things worse. Some trust their real estate agent or others to point them to the right lender and don’t want to take the time to compare. There may be as many reasons as there are shoppers, but failing to shop around can be a big mistake. Life’s expensive enough today. The last thing any of us need is to pay more than we should, especially with a mortgage.”
For every $100,000 borrowed, landing the lowest available rate instead of the highest could save borrowers an estimated $18,557 over the life of a 30-year loan, or $52 a month.
More offers could unlock more opportunities to save
The more shopping you do, the better your chances of securing a lower rate. Across all consumers, the lowest average interest rate offered is 5.93%, while the highest is 6.72% — a spread of 0.79 percentage points.
However, among consumers who received six or more offers, that spread widens to 0.98 percentage points — equating to potential monthly savings of $227, significantly higher than the $174 average across all consumers. That translates to lifetime loan savings of $81,735.
With that in mind, how much should you shop around? “Three should be the minimum you receive,” Schulz says. “That can help give you a good feel for what the market looks like. Sites like LendingTree make it easier than ever to potentially get far more quotes than that, which can lead to additional savings. However, you should aim to get at least three.”
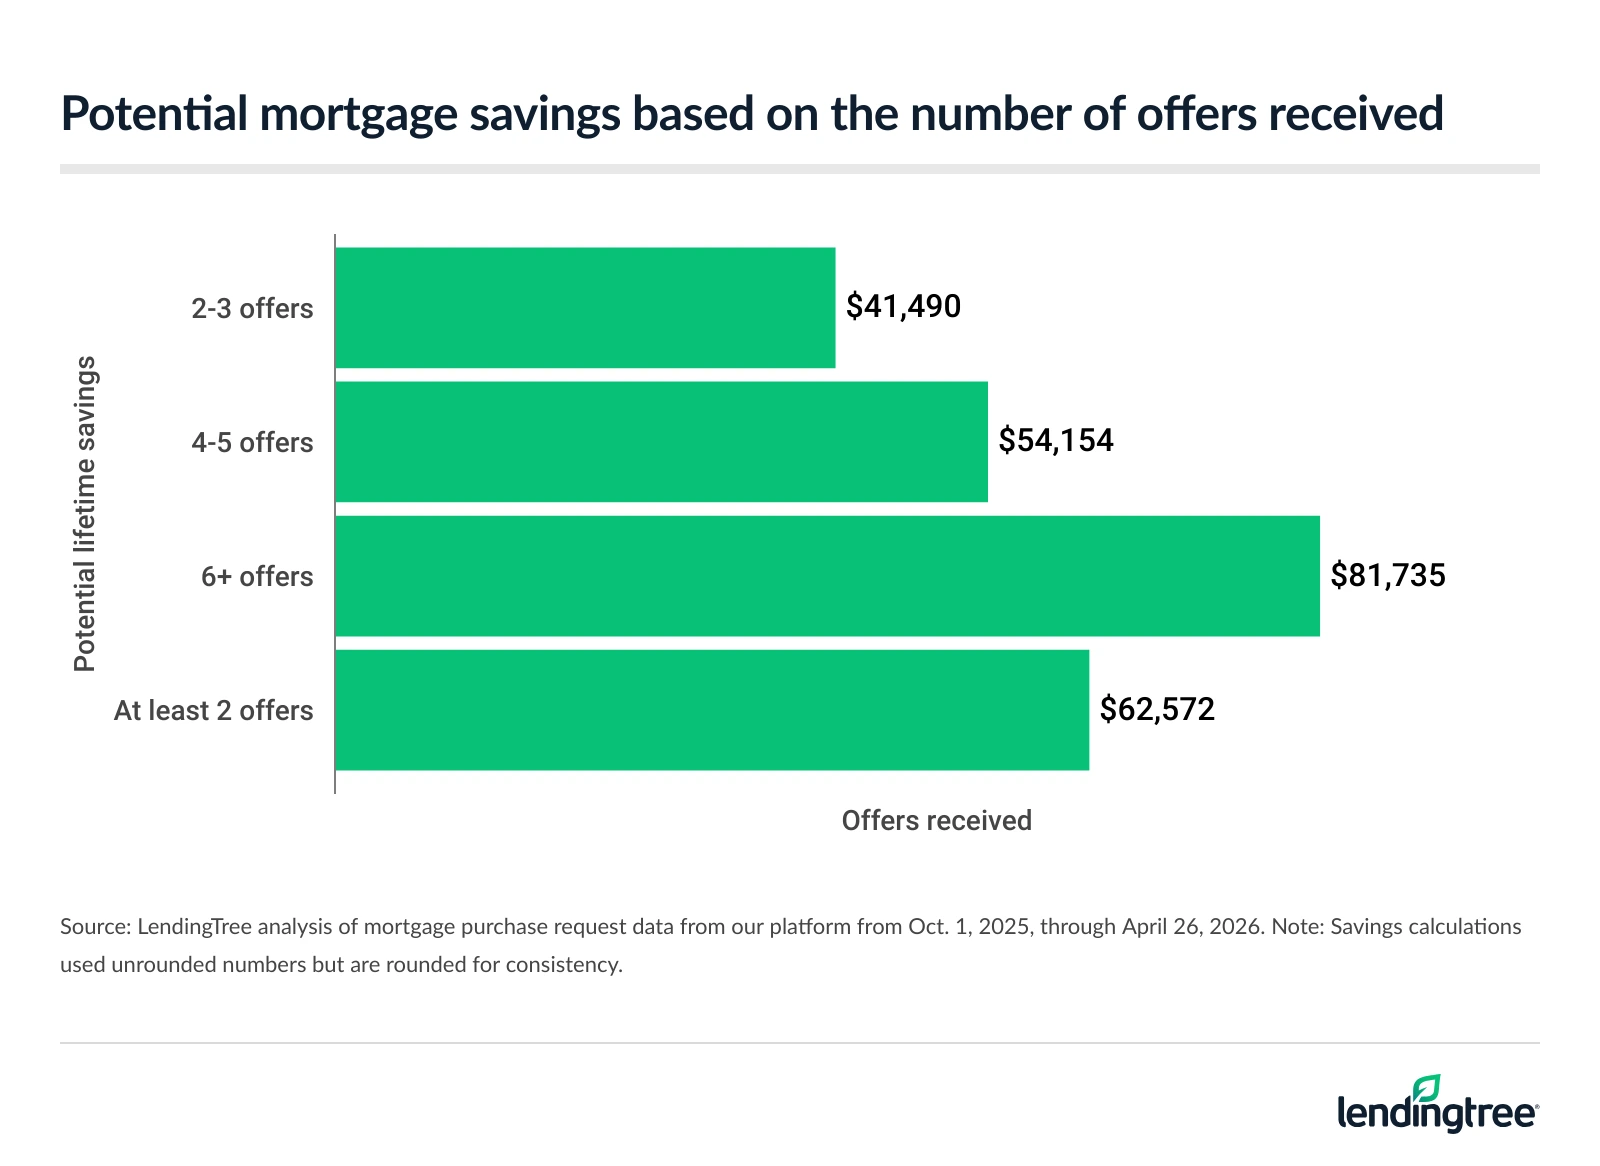
How much borrowers could save by shopping around for a mortgage based on the number of offers received
| Metric | All consumers | 2-3 offers | 4-5 offers | 6+ offers |
|---|---|---|---|---|
| Avg. lowest offered interest rate | 5.93% | 6.16% | 5.97% | 5.78% |
| Avg. highest offered interest rate | 6.72% | 6.72% | 6.67% | 6.76% |
| Rate spread (percentage points) | 0.79 | 0.56 | 0.70 | 0.98 |
| Avg. requested mortgage amount | $337,187 | $313,780 | $329,406 | $355,958 |
| Monthly payment, lowest avg. rate | $2,006 | $1,914 | $1,969 | $2,084 |
| Monthly payment, highest avg. rate | $2,180 | $2,029 | $2,119 | $2,311 |
| Monthly savings | $174 | $115 | $150 | $227 |
| Yearly savings | $2,086 | $1,383 | $1,805 | $2,724 |
| Lifetime savings | $62,572 | $41,490 | $54,154 | $81,735 |
Where you live affects how much you’ll save
Savings potential varies significantly by state. Borrowers in Hawaii stand to save the most, with those who shop around potentially saving $89,621 over the life of a loan. That’s followed by New Jersey ($81,955) and California ($81,705).
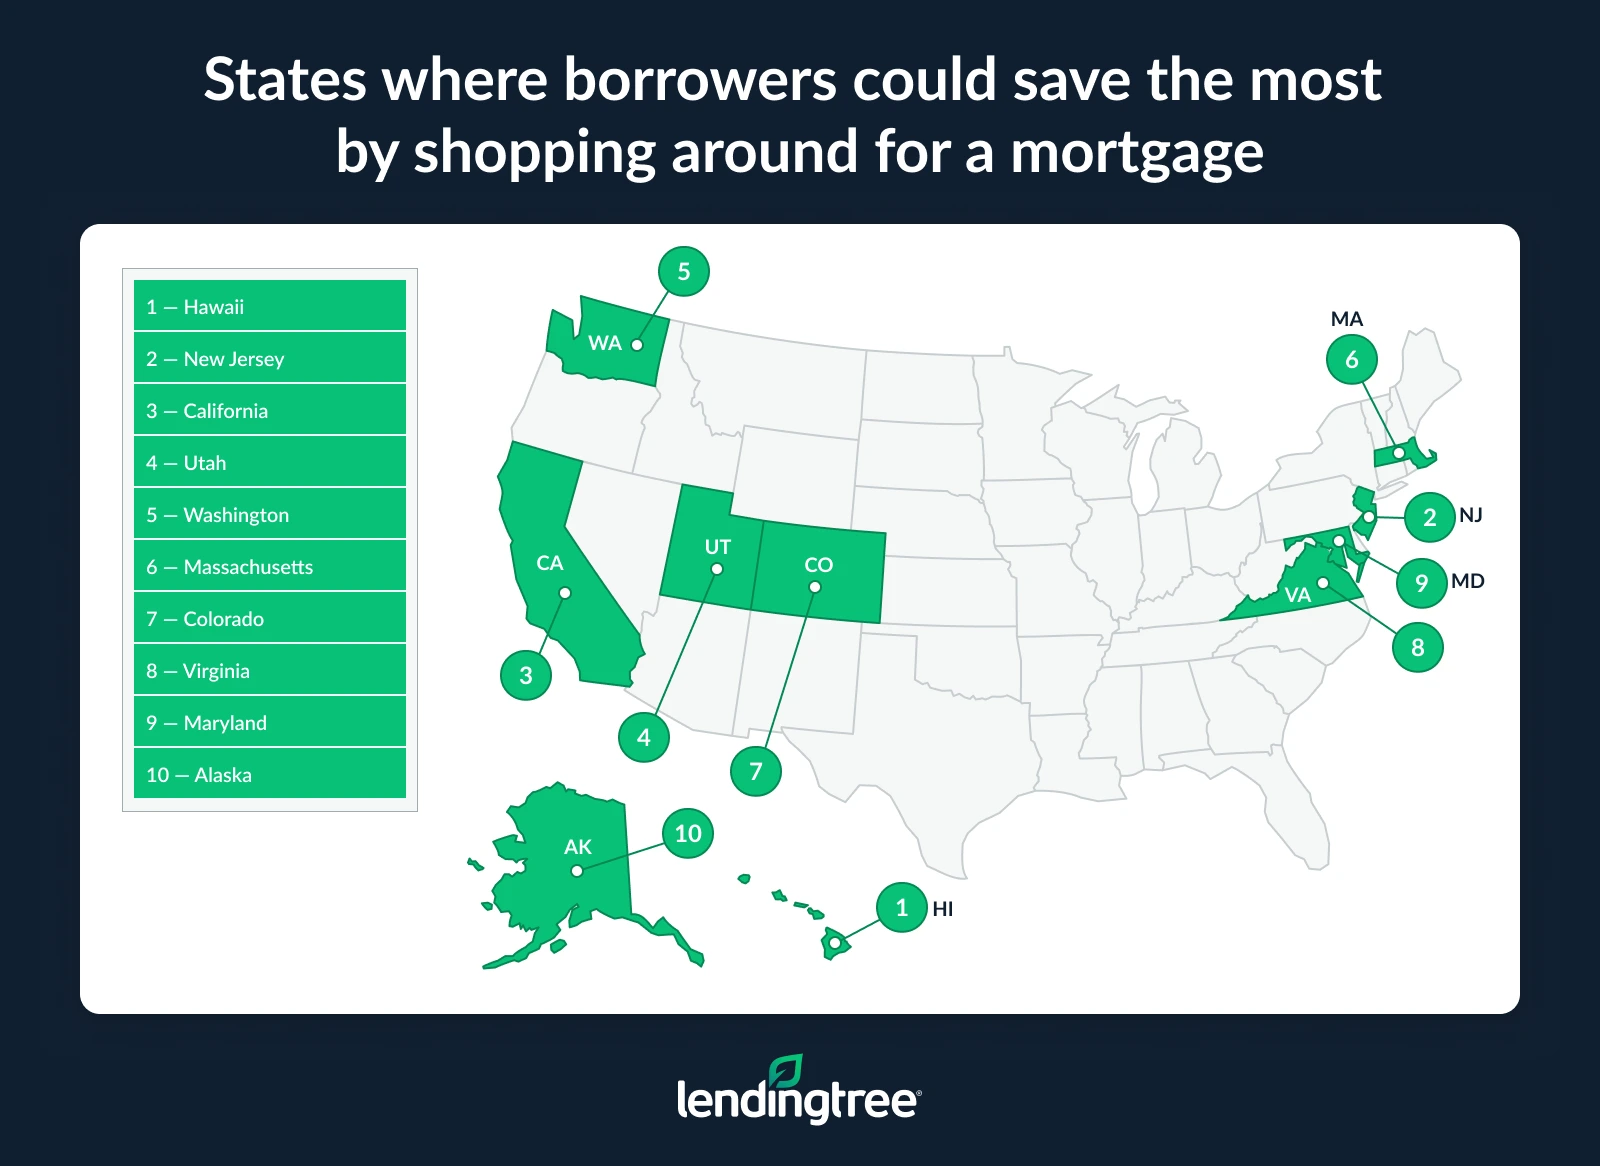
“This is primarily about property value,” Schulz says. “The more expensive the property, the more you stand to save by reducing your interest rate. Home prices in Hawaii, New Jersey and California are so high that even a tiny reduction in the interest rate can lead to significant savings over the life of a mortgage.”
Meanwhile, borrowers in New York could save the least, at a still meaningful $32,909. West Virginia ($41,037) and Mississippi ($44,521) follow.
At the metro level, borrowers in San Francisco ($112,942), San Jose, Calif. ($111,893), and San Diego ($96,200) have the most to gain from shopping around.
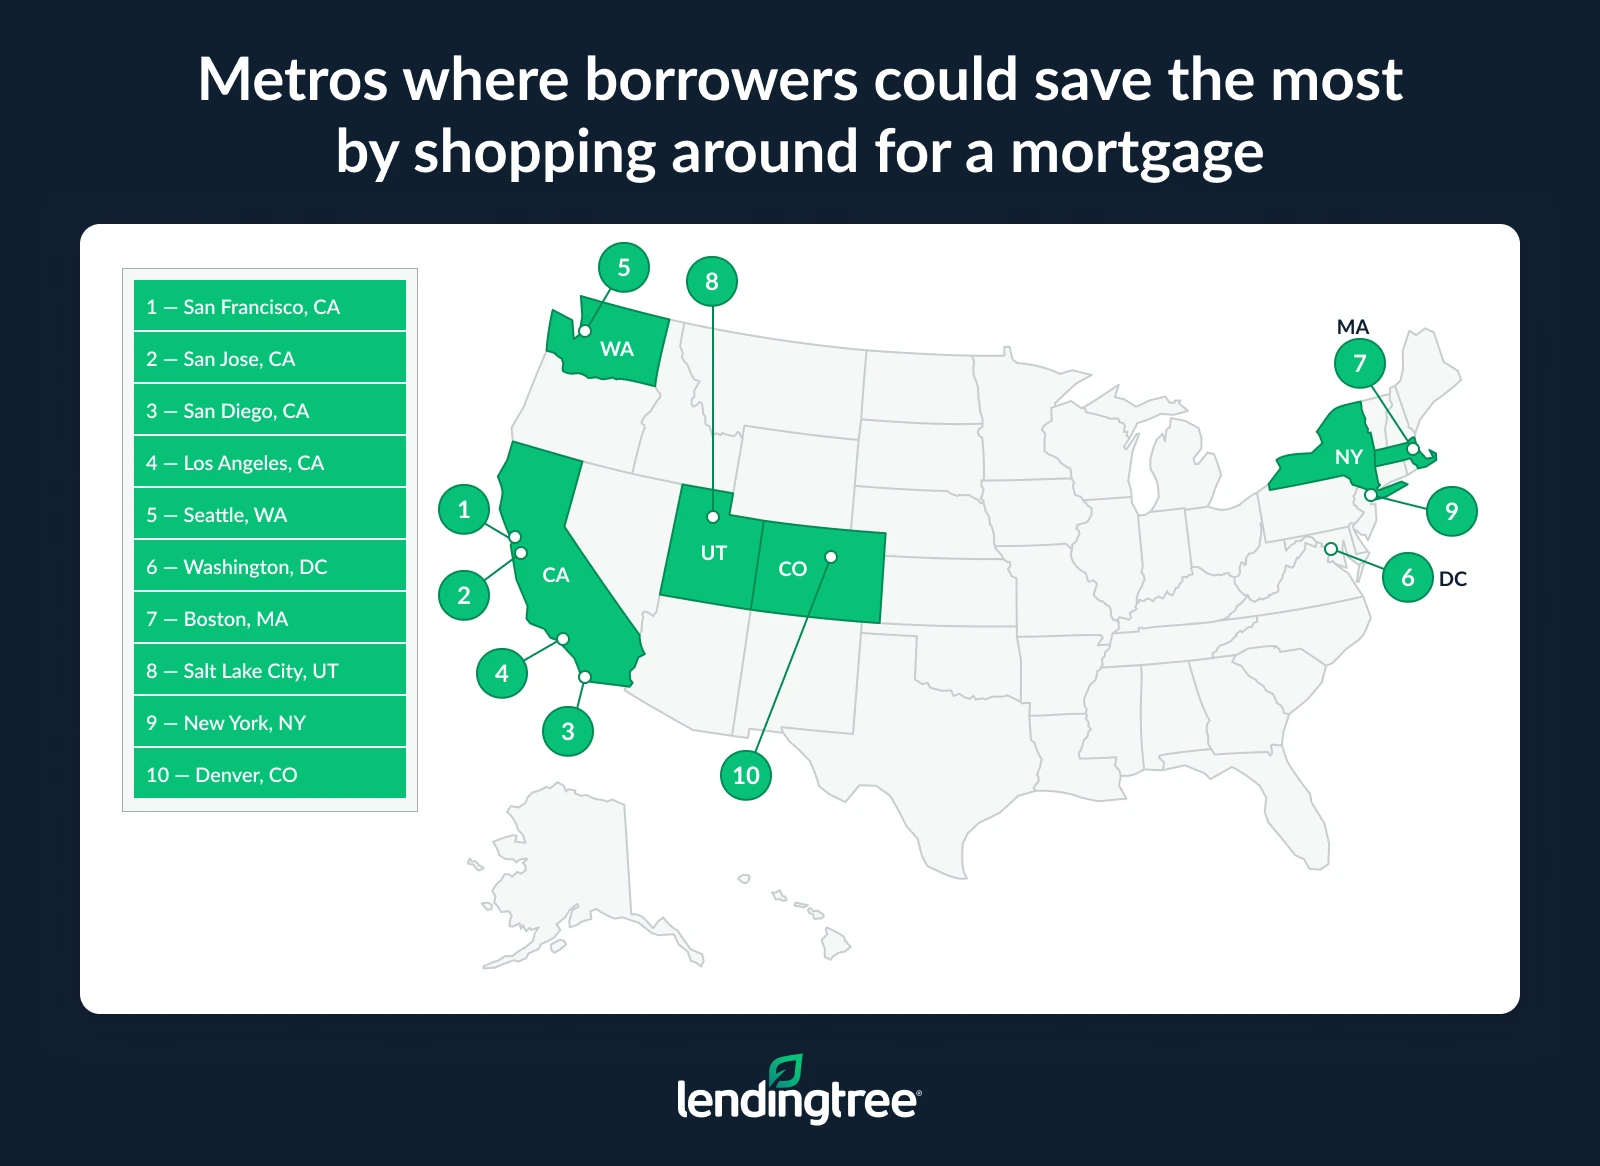
At the other end, borrowers in Buffalo, N.Y. ($22,764), St. Louis ($51,686) and Louisville, Ky. ($52,324), could see the lowest potential savings.
In metros like Cleveland (0.91), Virginia Beach, Va. (0.86), and Columbus, Ohio (0.86), rate spreads exceed 0.85 percentage points, creating more opportunity to find better deals. In contrast, Buffalo has the narrowest spread at just 0.32 percentage points, followed by New York (0.67) and Las Vegas (0.70).
Full rankings: States where borrowers could save the most by shopping around for a mortgage
| Rank | State | Avg. lowest offered interest rate | Avg. highest offered interest rate | Rate spread (percentage points) | Avg. requested mortgage amount | Monthly payment, lowest avg. rate | Monthly payment, highest avg. rate | Monthly savings | Yearly savings | Lifetime savings |
|---|---|---|---|---|---|---|---|---|---|---|
| 1 | Hawaii | 5.97% | 6.65% | 0.68 | $561,430 | $3,355 | $3,604 | $249 | $2,987 | $89,621 |
| 2 | New Jersey | 5.80% | 6.61% | 0.81 | $433,074 | $2,541 | $2,769 | $228 | $2,732 | $81,955 |
| 3 | California | 5.83% | 6.56% | 0.73 | $479,276 | $2,821 | $3,048 | $227 | $2,723 | $81,705 |
| 4 | Utah | 5.79% | 6.62% | 0.83 | $403,269 | $2,364 | $2,581 | $217 | $2,607 | $78,198 |
| 5 | Washington | 5.83% | 6.59% | 0.76 | $432,153 | $2,544 | $2,757 | $213 | $2,558 | $76,751 |
| 6 | Massachusetts | 5.89% | 6.61% | 0.72 | $449,707 | $2,664 | $2,875 | $211 | $2,527 | $75,803 |
| 7 | Colorado | 5.81% | 6.55% | 0.74 | $416,978 | $2,449 | $2,649 | $200 | $2,400 | $72,009 |
| 8 | Virginia | 5.88% | 6.71% | 0.83 | $367,871 | $2,177 | $2,376 | $199 | $2,388 | $71,625 |
| 9 | Maryland | 5.88% | 6.67% | 0.79 | $367,798 | $2,177 | $2,366 | $189 | $2,270 | $68,100 |
| 10 | Alaska | 5.88% | 6.65% | 0.77 | $359,230 | $2,126 | $2,306 | $180 | $2,160 | $64,800 |
| 11 | Georgia | 5.93% | 6.77% | 0.84 | $328,010 | $1,952 | $2,132 | $180 | $2,160 | $64,793 |
| 12 | Arizona | 5.90% | 6.69% | 0.79 | $345,821 | $2,051 | $2,229 | $178 | $2,136 | $64,088 |
| 13 | Idaho | 5.87% | 6.64% | 0.77 | $353,556 | $2,090 | $2,267 | $177 | $2,125 | $63,748 |
| 14 | Oregon | 5.88% | 6.63% | 0.75 | $359,323 | $2,127 | $2,302 | $175 | $2,104 | $63,105 |
| 15 | Wyoming | 5.94% | 6.77% | 0.83 | $319,332 | $1,902 | $2,075 | $173 | $2,078 | $62,342 |
| 16 | Connecticut | 5.86% | 6.59% | 0.73 | $362,375 | $2,140 | $2,312 | $172 | $2,062 | $61,860 |
| 17 | North Carolina | 5.90% | 6.72% | 0.82 | $320,437 | $1,901 | $2,072 | $171 | $2,056 | $61,680 |
| 18 | Nevada | 5.96% | 6.67% | 0.71 | $368,277 | $2,199 | $2,369 | $171 | $2,047 | $61,395 |
| 19 | Florida | 5.86% | 6.66% | 0.80 | $326,668 | $1,929 | $2,099 | $170 | $2,040 | $61,208 |
| 20 | New Hampshire | 6.01% | 6.72% | 0.71 | $363,926 | $2,184 | $2,353 | $169 | $2,027 | $60,805 |
| 21 | Rhode Island | 5.91% | 6.60% | 0.69 | $375,590 | $2,230 | $2,399 | $169 | $2,023 | $60,686 |
| 22 | Texas | 5.90% | 6.72% | 0.82 | $314,287 | $1,864 | $2,032 | $168 | $2,017 | $60,496 |
| 23 | South Carolina | 5.95% | 6.80% | 0.85 | $298,684 | $1,781 | $1,947 | $166 | $1,992 | $59,769 |
| 24 | Illinois | 5.96% | 6.76% | 0.80 | $312,962 | $1,868 | $2,032 | $164 | $1,963 | $58,904 |
| 25 | Delaware | 5.96% | 6.73% | 0.77 | $323,253 | $1,930 | $2,092 | $163 | $1,951 | $58,521 |
| 26 | Tennessee | 5.93% | 6.73% | 0.80 | $310,038 | $1,845 | $2,007 | $162 | $1,943 | $58,275 |
| 27 | Minnesota | 5.95% | 6.77% | 0.82 | $301,095 | $1,796 | $1,957 | $161 | $1,936 | $58,087 |
| 28 | Pennsylvania | 5.95% | 6.77% | 0.82 | $300,252 | $1,791 | $1,951 | $161 | $1,931 | $57,924 |
| 29 | Montana | 6.02% | 6.72% | 0.70 | $349,891 | $2,102 | $2,262 | $160 | $1,922 | $57,650 |
| 30 | Vermont | 6.11% | 6.80% | 0.69 | $338,543 | $2,054 | $2,207 | $153 | $1,840 | $55,190 |
| 31 | Ohio | 5.94% | 6.84% | 0.90 | $260,303 | $1,551 | $1,704 | $153 | $1,840 | $55,188 |
| 32 | Kansas | 6.01% | 6.87% | 0.86 | $269,176 | $1,616 | $1,767 | $152 | $1,822 | $54,655 |
| 33 | Oklahoma | 6.02% | 6.90% | 0.88 | $261,462 | $1,571 | $1,722 | $151 | $1,812 | $54,370 |
| 34 | Maine | 6.08% | 6.83% | 0.75 | $303,354 | $1,834 | $1,984 | $149 | $1,792 | $53,753 |
| 35 | New Mexico | 6.04% | 6.81% | 0.77 | $295,658 | $1,780 | $1,929 | $149 | $1,791 | $53,715 |
| 36 | Wisconsin | 5.99% | 6.76% | 0.77 | $291,956 | $1,749 | $1,896 | $147 | $1,764 | $52,925 |
| 37 | Alabama | 6.05% | 6.86% | 0.81 | $273,297 | $1,647 | $1,793 | $145 | $1,743 | $52,300 |
| 38 | South Dakota | 6.03% | 6.78% | 0.75 | $292,389 | $1,759 | $1,902 | $144 | $1,723 | $51,696 |
| 39 | North Dakota | 6.02% | 6.78% | 0.76 | $288,000 | $1,730 | $1,874 | $143 | $1,720 | $51,588 |
| 40 | Michigan | 6.02% | 6.83% | 0.81 | $266,565 | $1,602 | $1,743 | $142 | $1,698 | $50,945 |
| 41 | Nebraska | 6.00% | 6.78% | 0.78 | $276,493 | $1,658 | $1,799 | $141 | $1,694 | $50,807 |
| 42 | Indiana | 6.03% | 6.84% | 0.81 | $265,527 | $1,597 | $1,738 | $141 | $1,692 | $50,769 |
| 43 | Louisiana | 6.00% | 6.78% | 0.78 | $271,495 | $1,628 | $1,766 | $139 | $1,663 | $49,889 |
| 44 | Missouri | 6.09% | 6.84% | 0.75 | $276,495 | $1,674 | $1,810 | $136 | $1,634 | $49,015 |
| 45 | Arkansas | 6.07% | 6.87% | 0.80 | $252,302 | $1,524 | $1,657 | $133 | $1,591 | $47,718 |
| 46 | Iowa | 6.07% | 6.86% | 0.79 | $253,100 | $1,529 | $1,660 | $131 | $1,575 | $47,260 |
| 47 | Kentucky | 6.08% | 6.86% | 0.78 | $256,060 | $1,548 | $1,680 | $131 | $1,574 | $47,218 |
| 48 | Mississippi | 6.18% | 6.92% | 0.74 | $253,596 | $1,550 | $1,674 | $124 | $1,484 | $44,521 |
| 49 | West Virginia | 6.23% | 6.93% | 0.70 | $246,782 | $1,516 | $1,630 | $114 | $1,368 | $41,037 |
| 50 | New York | 6.19% | 6.51% | 0.32 | $437,265 | $2,675 | $2,767 | $91 | $1,097 | $32,909 |
Full rankings: Metros where borrowers could save the most money by shopping around for a mortgage
| Rank | Metro | Avg. lowest offered interest rate | Avg. highest offered interest rate | Rate spread (percentage points) | Avg. requested mortgage amount | Monthly payment, lowest avg. rate | Monthly payment, highest avg. rate | Monthly savings | Yearly savings | Lifetime savings |
|---|---|---|---|---|---|---|---|---|---|---|
| 1 | San Francisco, CA | 5.78% | 6.54% | 0.76 | $637,387 | $3,732 | $4,046 | $314 | $3,765 | $112,942 |
| 2 | San Jose, CA | 5.82% | 6.58% | 0.76 | $630,313 | $3,706 | $4,017 | $311 | $3,730 | $111,893 |
| 3 | San Diego, CA | 5.75% | 6.49% | 0.74 | $558,605 | $3,260 | $3,527 | $267 | $3,207 | $96,200 |
| 4 | Los Angeles, CA | 5.83% | 6.56% | 0.73 | $535,587 | $3,153 | $3,406 | $254 | $3,043 | $91,304 |
| 5 | Seattle, WA | 5.76% | 6.51% | 0.75 | $517,628 | $3,024 | $3,275 | $251 | $3,014 | $90,411 |
| 6 | Washington, DC | 5.78% | 6.59% | 0.81 | $457,183 | $2,677 | $2,917 | $240 | $2,881 | $86,438 |
| 7 | Boston, MA | 5.86% | 6.58% | 0.72 | $486,544 | $2,873 | $3,101 | $228 | $2,730 | $81,901 |
| 8 | Salt Lake City, UT | 5.79% | 6.57% | 0.78 | $427,492 | $2,506 | $2,722 | $216 | $2,594 | $77,814 |
| 9 | New York, NY | 5.84% | 6.51% | 0.67 | $487,255 | $2,871 | $3,083 | $212 | $2,539 | $76,169 |
| 10 | Denver, CO | 5.78% | 6.49% | 0.71 | $440,654 | $2,580 | $2,782 | $202 | $2,429 | $72,862 |
| 11 | Riverside, CA | 5.85% | 6.59% | 0.74 | $420,514 | $2,481 | $2,683 | $202 | $2,425 | $72,752 |
| 12 | Miami, FL | 5.82% | 6.59% | 0.77 | $403,317 | $2,372 | $2,573 | $202 | $2,419 | $72,555 |
| 13 | Sacramento, CA | 5.78% | 6.50% | 0.72 | $413,920 | $2,423 | $2,616 | $193 | $2,314 | $69,421 |
| 14 | Atlanta, GA | 5.87% | 6.68% | 0.81 | $365,362 | $2,160 | $2,353 | $193 | $2,312 | $69,361 |
| 15 | Phoenix, AZ | 5.85% | 6.64% | 0.79 | $371,366 | $2,191 | $2,382 | $191 | $2,289 | $68,667 |
| 16 | Austin, TX | 5.80% | 6.58% | 0.78 | $376,794 | $2,211 | $2,401 | $191 | $2,287 | $68,617 |
| 17 | Charlotte, NC | 5.83% | 6.63% | 0.80 | $365,743 | $2,153 | $2,343 | $190 | $2,281 | $68,436 |
| 18 | Portland, OR | 5.81% | 6.55% | 0.74 | $393,697 | $2,313 | $2,501 | $189 | $2,266 | $67,988 |
| 19 | Richmond, VA | 5.86% | 6.71% | 0.85 | $336,050 | $1,985 | $2,171 | $186 | $2,233 | $66,976 |
| 20 | Raleigh, NC | 5.80% | 6.59% | 0.79 | $361,508 | $2,121 | $2,306 | $185 | $2,223 | $66,692 |
| 21 | Virginia Beach, VA | 5.88% | 6.74% | 0.86 | $330,023 | $1,953 | $2,138 | $185 | $2,221 | $66,623 |
| 22 | Nashville, TN | 5.82% | 6.58% | 0.76 | $374,149 | $2,200 | $2,385 | $184 | $2,214 | $66,419 |
| 23 | Philadelphia, PA | 5.86% | 6.65% | 0.79 | $354,965 | $2,096 | $2,279 | $182 | $2,189 | $65,664 |
| 24 | Dallas, TX | 5.84% | 6.64% | 0.80 | $347,265 | $2,046 | $2,227 | $181 | $2,167 | $65,008 |
| 25 | Baltimore, MD | 5.87% | 6.64% | 0.77 | $357,600 | $2,114 | $2,293 | $179 | $2,149 | $64,477 |
| 26 | Chicago, IL | 5.90% | 6.69% | 0.79 | $341,125 | $2,023 | $2,199 | $176 | $2,107 | $63,218 |
| 27 | Providence, RI | 5.92% | 6.64% | 0.72 | $373,696 | $2,221 | $2,397 | $175 | $2,103 | $63,076 |
| 28 | Orlando, FL | 5.80% | 6.59% | 0.79 | $340,837 | $2,000 | $2,175 | $175 | $2,096 | $62,879 |
| 29 | Minneapolis, MN | 5.89% | 6.69% | 0.80 | $325,893 | $1,931 | $2,101 | $170 | $2,038 | $61,146 |
| 30 | Fresno, CA | 5.86% | 6.61% | 0.75 | $348,266 | $2,057 | $2,227 | $170 | $2,037 | $61,108 |
| 31 | Tampa, FL | 5.85% | 6.65% | 0.80 | $323,878 | $1,911 | $2,079 | $168 | $2,022 | $60,658 |
| 32 | Columbus, OH | 5.88% | 6.74% | 0.86 | $298,766 | $1,768 | $1,936 | $168 | $2,010 | $60,313 |
| 33 | San Antonio, TX | 5.91% | 6.77% | 0.86 | $297,377 | $1,766 | $1,933 | $167 | $2,004 | $60,113 |
| 34 | Houston, TX | 5.88% | 6.69% | 0.81 | $315,381 | $1,867 | $2,033 | $166 | $1,997 | $59,899 |
| 35 | Las Vegas, NV | 5.95% | 6.65% | 0.70 | $363,410 | $2,167 | $2,333 | $166 | $1,990 | $59,690 |
| 36 | Jacksonville, FL | 5.79% | 6.60% | 0.81 | $311,617 | $1,826 | $1,990 | $164 | $1,965 | $58,943 |
| 37 | Cleveland, OH | 5.89% | 6.80% | 0.91 | $272,672 | $1,616 | $1,778 | $162 | $1,945 | $58,336 |
| 38 | Milwaukee, WI | 5.92% | 6.67% | 0.75 | $322,725 | $1,918 | $2,076 | $158 | $1,893 | $56,780 |
| 39 | Memphis, TN | 5.97% | 6.78% | 0.81 | $296,572 | $1,772 | $1,929 | $157 | $1,885 | $56,554 |
| 40 | Indianapolis, IN | 5.96% | 6.77% | 0.81 | $292,350 | $1,745 | $1,900 | $155 | $1,857 | $55,724 |
| 41 | Birmingham, AL | 5.99% | 6.81% | 0.82 | $287,103 | $1,719 | $1,874 | $154 | $1,850 | $55,486 |
| 42 | Cincinnati, OH | 5.93% | 6.79% | 0.86 | $273,582 | $1,628 | $1,782 | $154 | $1,845 | $55,353 |
| 43 | Kansas City, MO | 5.98% | 6.76% | 0.78 | $299,464 | $1,792 | $1,944 | $153 | $1,833 | $54,979 |
| 44 | Grand Rapids, MI | 5.99% | 6.78% | 0.79 | $292,978 | $1,755 | $1,906 | $151 | $1,817 | $54,514 |
| 45 | Pittsburgh, PA | 5.97% | 6.80% | 0.83 | $272,598 | $1,629 | $1,777 | $148 | $1,776 | $53,289 |
| 46 | Oklahoma City, OK | 5.99% | 6.82% | 0.83 | $270,356 | $1,619 | $1,766 | $147 | $1,763 | $52,898 |
| 47 | Detroit, MI | 5.95% | 6.73% | 0.78 | $287,372 | $1,714 | $1,860 | $146 | $1,756 | $52,689 |
| 48 | Louisville, KY | 5.98% | 6.78% | 0.80 | $277,755 | $1,662 | $1,807 | $145 | $1,744 | $52,324 |
| 49 | St. Louis, MO | 6.06% | 6.83% | 0.77 | $284,236 | $1,715 | $1,859 | $144 | $1,723 | $51,686 |
| 50 | Buffalo, NY | 6.36% | 6.68% | 0.32 | $300,220 | $1,870 | $1,933 | $63 | $759 | $22,764 |
Many borrowers don’t shop around or negotiate
Despite how much money is on the line, only 66% of mortgage holders compared quotes from multiple lenders during their most recent home loan shopping process — and an even smaller share, 54%, tried to negotiate.
By age group, baby boomer mortgage holders ages 62 to 80 are the least likely to negotiate at just 18%, compared with about 70% of Gen Zers ages 18 to 29 and millennials ages 30 to 45. Men (67%) are also significantly more likely to negotiate than women (36%).
So why do so many borrowers skip negotiating? One in 5 (20%) borrowers who didn’t negotiate say they didn’t know it was an option. Another 16% assumed it wouldn’t make a difference.
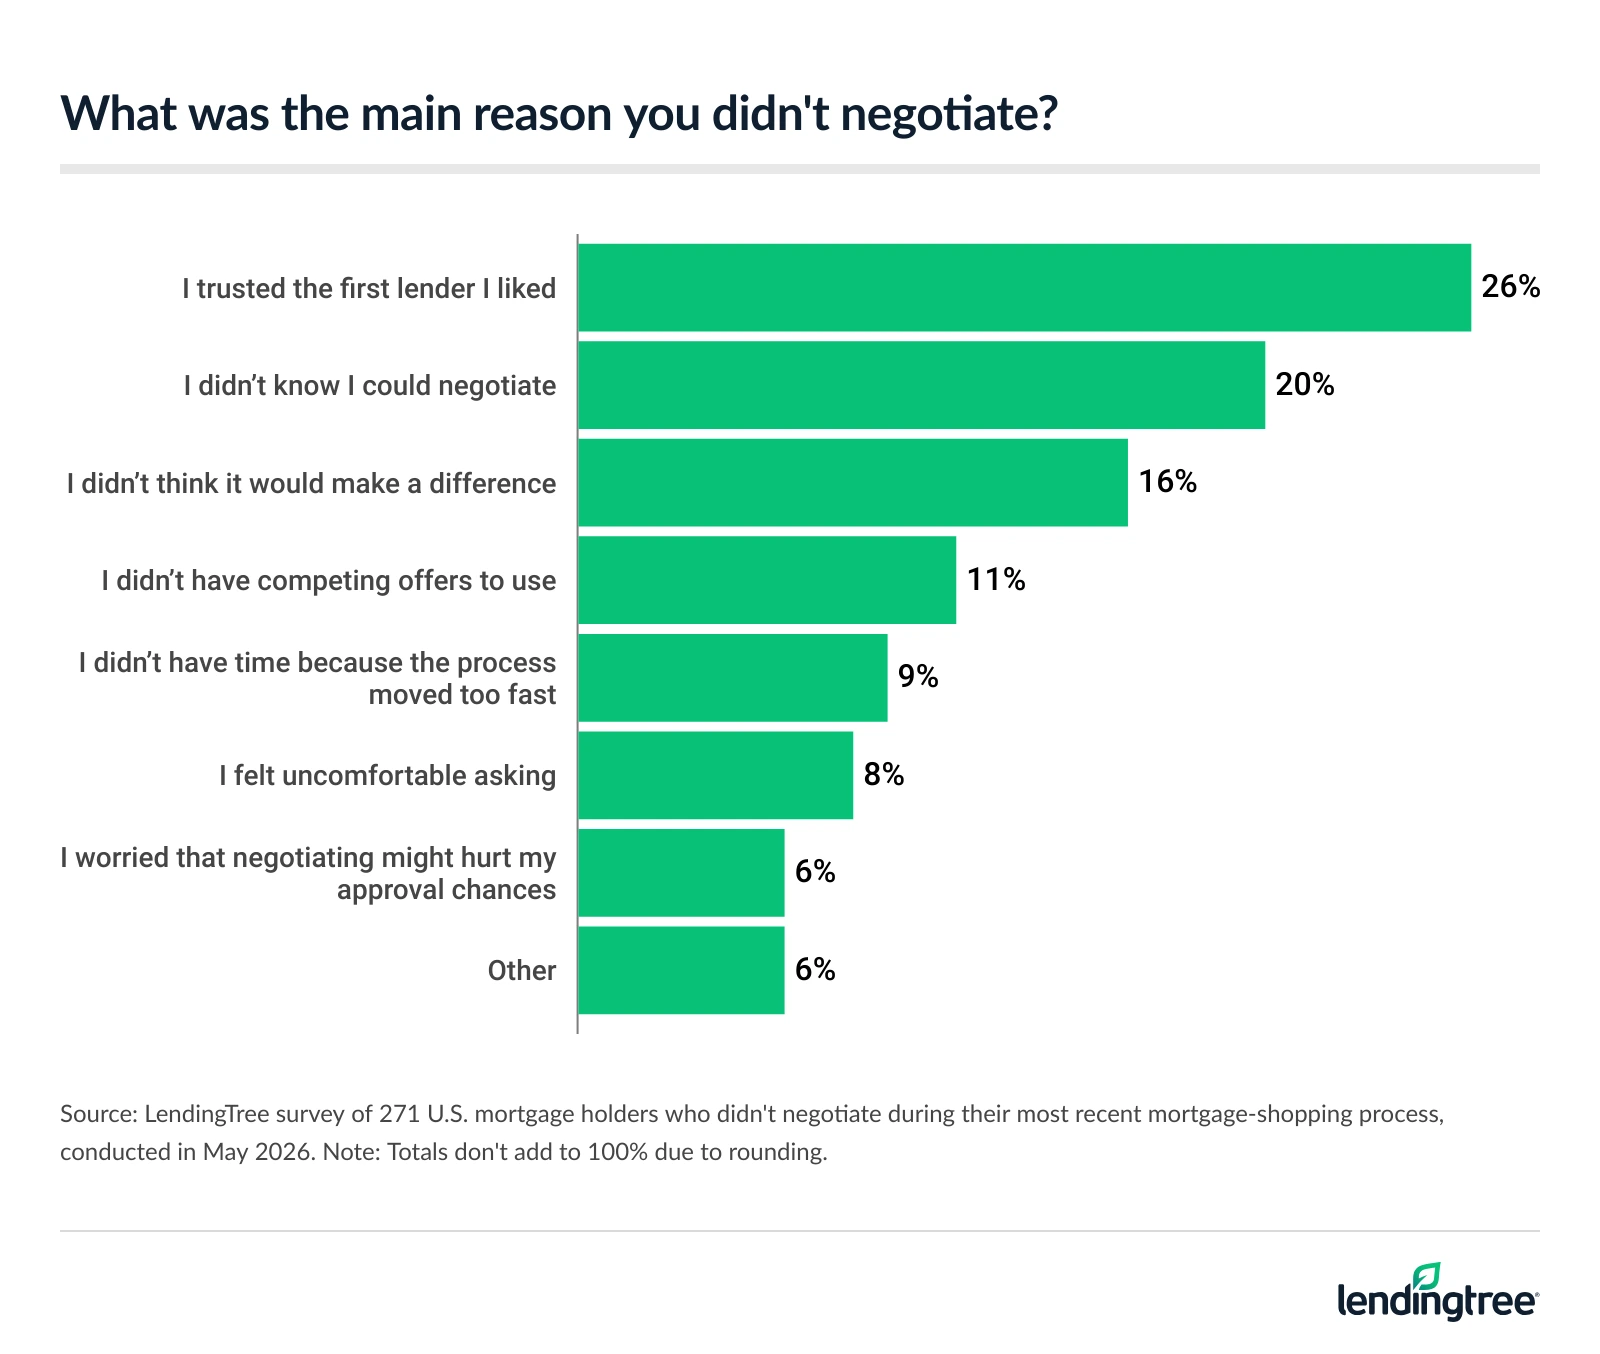
The most common reason, however, is trust: 26% of borrowers who didn’t negotiate say they trusted the lender they chose.
Negotiating pays off, especially on interest rates
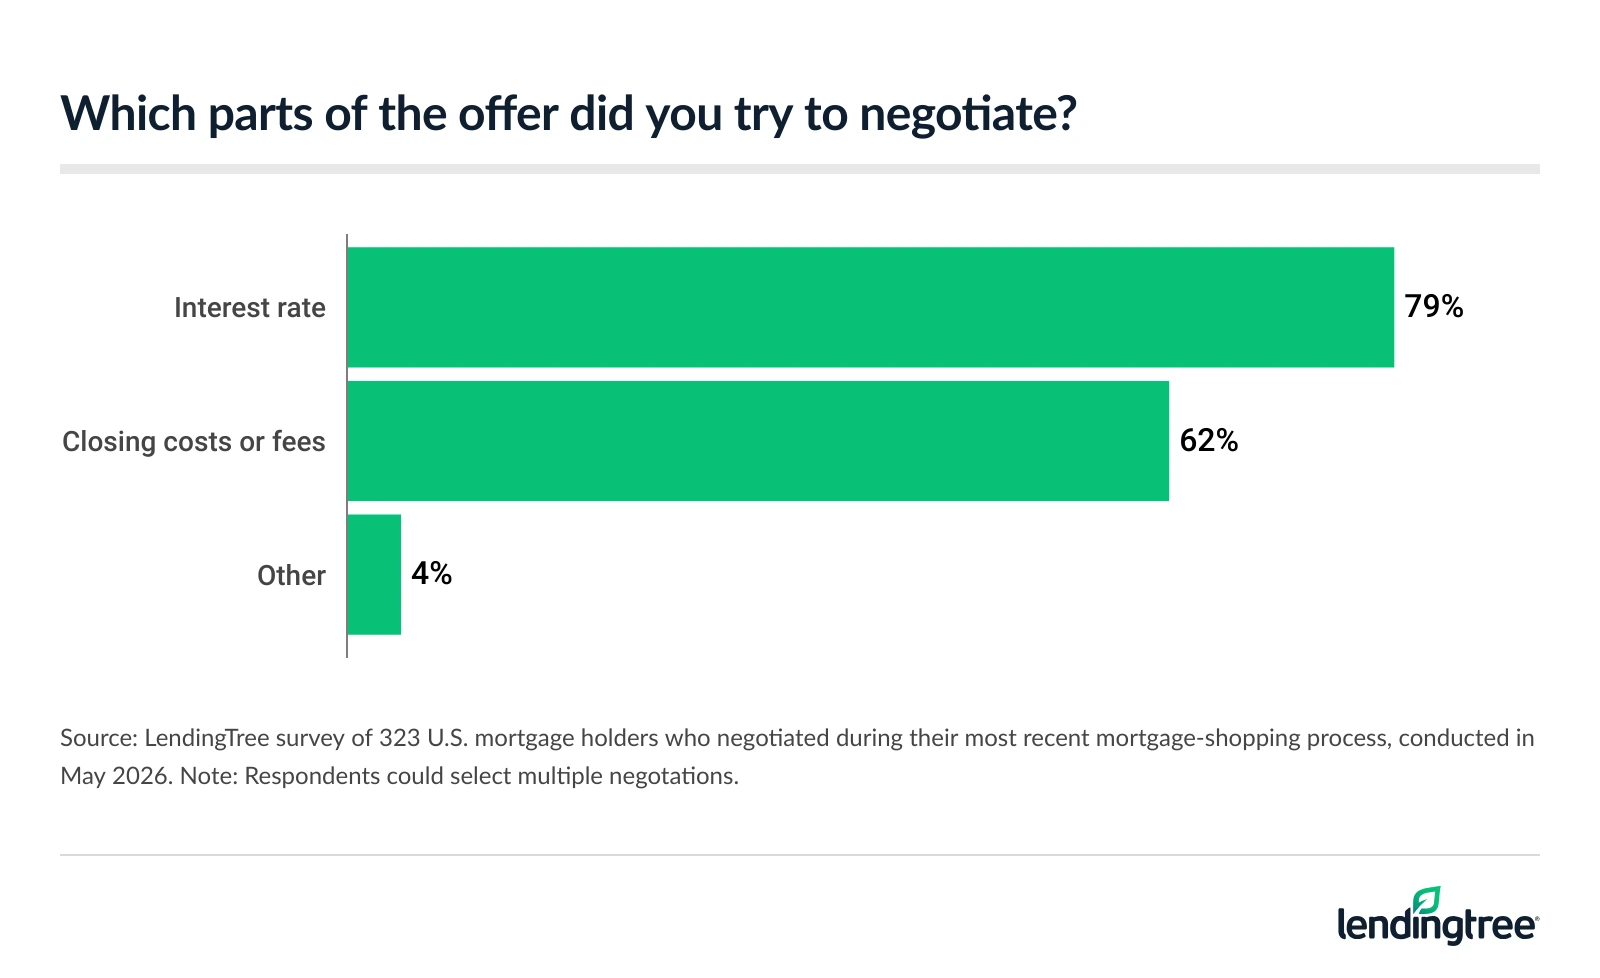
Among borrowers who negotiated, the results were meaningful. Most focused on their interest rate (79%), though many also negotiated closing costs or lender fees (62%).
Among those who negotiated their rate, 93% lowered their monthly payment, including 37% who lowered it by $100 or more. Another 56% were able to do so by $99 or less.
Fee negotiators also saw meaningful savings, with 34% reducing upfront costs by at least $2,000 and 12% saving $5,000 or more. Meanwhile, 56% reduced costs by $1,999 or less.
Schulz says there are pros and cons to negotiating interest rates versus closing costs or lender fees. “The interest rate usually offers the biggest opportunity for savings because even a small reduction can lower monthly payments and save thousands of dollars over the life of the loan,” he says. “However, lender fees and some closing costs are often the easiest to negotiate. Charges like application fees, origination fees, underwriting fees and discount points are more flexible than many third-party costs, and lenders may reduce or waive them to win your business.”
Tips for getting the best mortgage rate
Shopping around for a mortgage doesn’t have to be complicated. A few strategic moves before you sign can mean the difference between leaving money on the table and keeping it in your pocket. We offer the following advice:
- Shop around for a mortgage more than you think you need to. “Getting quotes from at least three to five lenders can potentially save you thousands because rates and fees can vary widely for the same borrower profile,” Schulz says.
- Pay attention to the full cost of the loan, not just the interest rate. “The cost of a mortgage goes far beyond just the interest rate,” he says. “A lower rate doesn’t always mean a cheaper loan overall.”
- Negotiate, negotiate, negotiate. “Many borrowers don’t realize mortgage terms are often flexible,” he says. “Ask lenders to match competing offers, lower fees or improve the rate, especially if you have multiple quotes in hand.”
- Focus on what comfortably fits your budget. “Don’t base your decision solely on what a lender approves you for,” he says. “Make sure the monthly payment still works alongside your other financial goals and expenses. A mortgage affordability calculator can help you understand what you can really afford.”
Methodology
LendingTree analyzed data from more than 80,000 users of LendingTree’s online loan marketplace who received two or more offers for 30-year, fixed-rate mortgages from lenders from Oct. 1, 2025, through April 26, 2026. We analyzed the spread between the lowest and highest interest rates offered to individual users in each state (excluding the District of Columbia), only including users who received two or more loan offers. For each state, we calculated the following:
- The average of the lowest interest rates offered to borrowers
- The average of the highest interest rates offered to borrowers
Using these averages, we estimated the monthly payments based on the average mortgage amount requested in each state. The difference between the payments at the high and low rates indicates how much a borrower could save by choosing a lower interest rate. We then converted these monthly savings into annual and lifetime savings.
To avoid distortion by outliers, we averaged the lowest and highest interest rates received by each individual user instead of comparing a single lowest and highest interest rate in each state.
Separately, LendingTree commissioned QuestionPro to conduct an online survey of 2,000 U.S. consumers ages 18 to 80 from May 4 to 6, 2026. The survey was administered using a nonprobability-based sample, and quotas were used to ensure the sample base represented the overall population. Researchers reviewed all responses for quality control.
We defined generations as the following ages in 2026:
- Generation Z: 18 to 29
- Millennials: 30 to 45
- Generation X: 46 to 61
- Baby boomers: 62 to 80
View mortgage loan offers from up to 5 lenders in minutes