Holiday Hosting: A Third Bedroom Comes With a 29% Rental Premium Across Major Metros


Across America’s 100 largest metros, more than 1 in 4 occupied homes are space-constrained, with too many people living in too few rooms.
Compounding the problem, anyone looking to ease space constraints by moving from a two-bedroom to a three-bedroom rental in those metros should expect to pay a nearly 30% premium for the upgrade, according to a LendingTree analysis.
That means millions of Americans are squeezed for space without an affordable solution, creating challenges both in the short term when hosting friends and relatives for the holidays, and in the long term when expanding their families or housing adult children or elderly parents.
Here’s more of what our analysis found.
In this report, we used the U.S. Census Bureau definition of a home: “A house, an apartment, a mobile home or trailer, a group of rooms or a single room occupied as separate living quarters.” Homes could be either rented or owned.
We defined a “space-constrained” home as an occupied housing unit with more than 0.5 occupants per room. The room count includes bedrooms, living rooms, dining rooms, kitchens, finished recreation rooms, rooms used for living purposes in finished basements or attics and permanently enclosed porches usable year-round. It excludes bathrooms, utility rooms, unenclosed porches, balconies, halls, foyers and unfinished attics or basements.
For example, a family of four in a house with eight rooms wouldn’t be considered space-constrained. (Four people in eight rooms is 0.5 people per room.) However, the same family with seven or fewer rooms would be. (Four people in seven rooms is about 0.6 people per room.)
“Space-constrained” doesn’t necessarily mean “overcrowded.” A common measure of overcrowding is more than 1 person per room, such as a family of four in a three-room home. A family of four in a seven-room home would fall below that threshold, but both homes would be considered space-constrained under our definition. A “severely overcrowded” home would be one with more than 1.5 people per room.
Note that this measure compares the number of residents with the number of rooms. It doesn’t account for square footage or directly measure a home’s capacity to host guests.
- Across the nation’s 100 biggest metros, more than 1 in 4 occupied homes, on average, are “space-constrained.” An average of 27.7% of occupied homes meet our definition of “space-constrained” across the 100 metros analyzed. In 18 of the 100 metros, at least one-third of occupied homes have more than 0.5 occupants per room.
- McAllen, Texas, has the highest rate of space-constrained homes, though California metros dominate the rest of the top 10. An estimated 50.1% of occupied homes in McAllen have more than 0.5 occupants per room. Overall, seven of the 10 metros with the highest rates of space-constrained homes are in California. Meanwhile, occupied homes in Pittsburgh (16.6%) and Cleveland (17.8%) are the least likely to be space-constrained.
- The estimated rental premium for a third bedroom averages nearly 30%. Across the metros analyzed, the average estimated premium for a three-bedroom rental compared with a two-bedroom rental is $494 per month, with an average percentage premium of 29.0%.
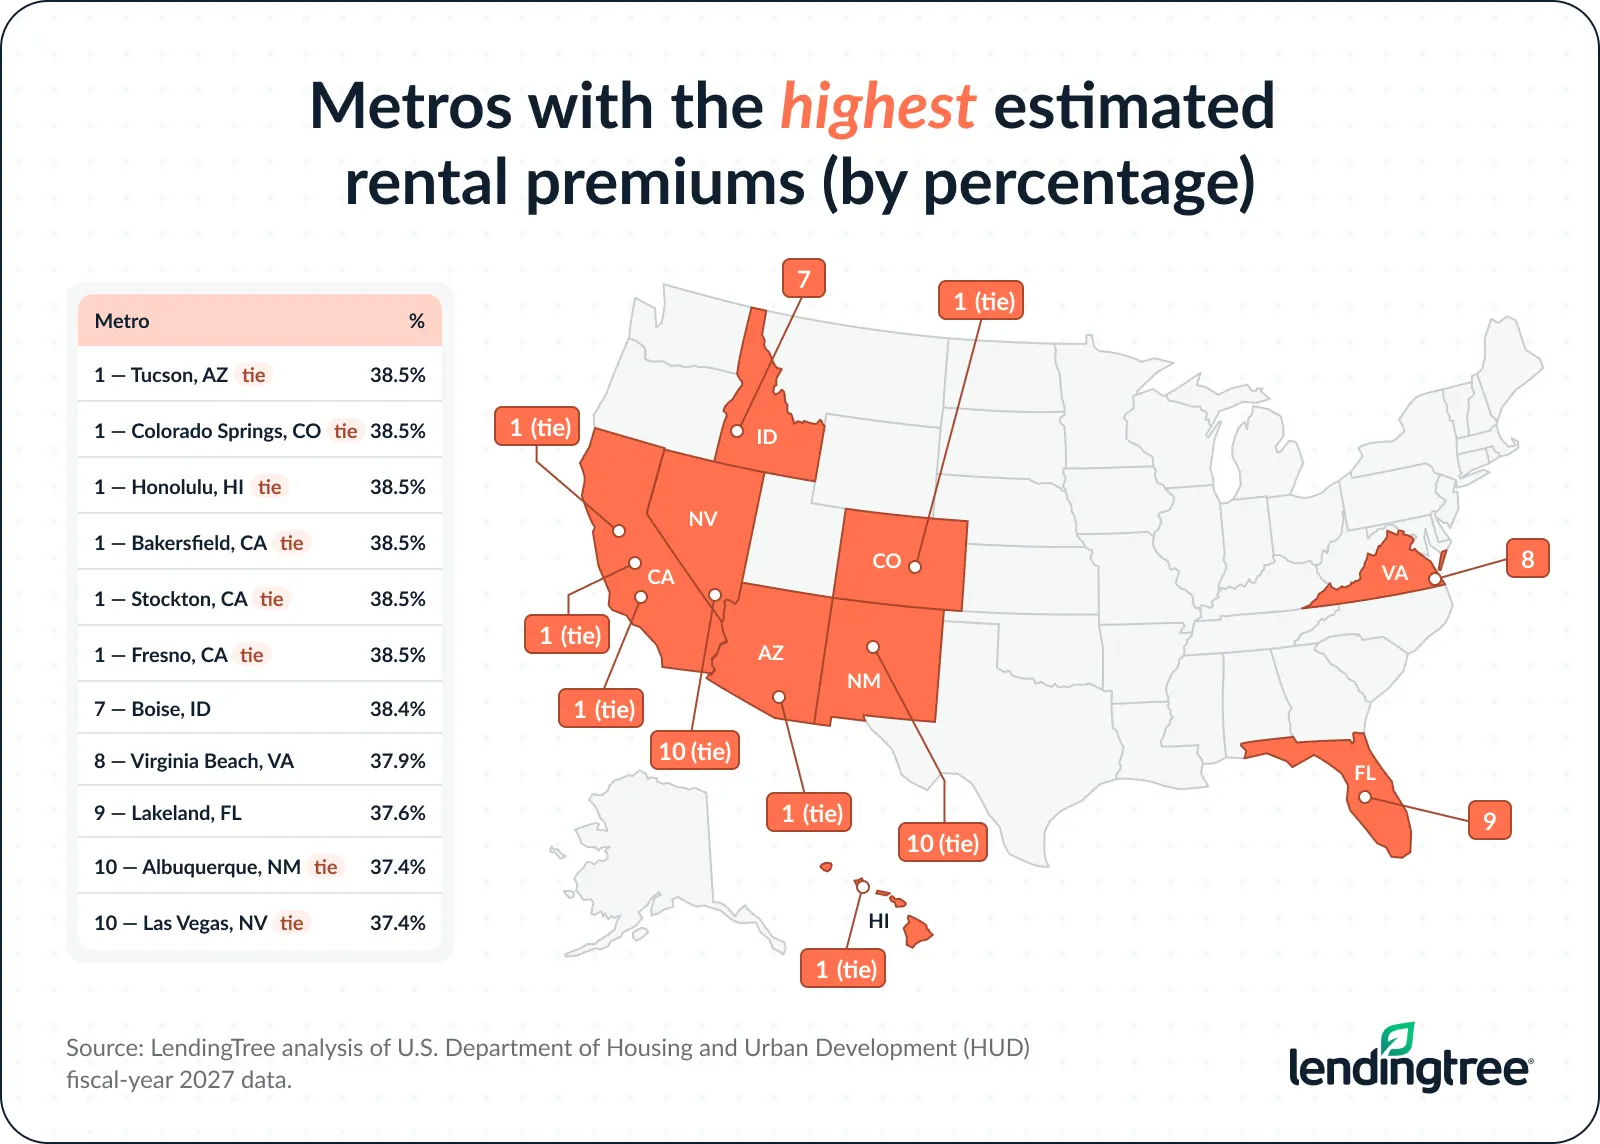
- Western metros have the highest estimated rental premiums for a third bedroom. In dollar terms, San Jose, Calif., has the steepest estimated premium — $1,125 more per month for a third bedroom. By percentage, six metros tie for the highest premium at 38.5%, including three in California. Philadelphia and Hartford, Conn., have the lowest estimated percentage premium at 19.1%, while San Juan, Puerto Rico, has the lowest estimated dollar premium at $213 per month.
Across the nation’s 100 largest metros, more than 1 in 4 occupied homes, on average, are ‘space-constrained’
For millions of Americans across the nation’s largest metros, there’s just not enough space in their homes. In our report, we say that a home is space-constrained if there are more than 0.5 occupants per room. For example, four people in a seven-room house would equal 0.6 people per room, meeting our definition of space-constrained.
More than 1 in 4 (27.7%) homes in the nation’s 100 largest metros qualify as “space-constrained” under our definition. Compare that with an average of 3.3% of homes that are overcrowded (defined as more than 1 person per room) and 1.1% that are severely overcrowded (more than 1.5 people per room).
Space is tight in more than a quarter of U.S. homes
| Average % of space-constrained homes across top 100 metros | 27.7% |
| Average % of overcrowded homes across top 100 metros | 3.3% |
| Average % of severely overcrowded homes across top 100 metros | 1.1% |
Our report focuses on those space-constrained homes. While all of our nation’s largest metros have a substantial share of space-constrained homes, the percentages vary widely. In 18 of the 100 metros, at least one-third of occupied homes have more than 0.5 occupants per room.
McAllen, Texas, has the highest rate of space-constrained homes, though California metros dominate the rest of the top 10
Nowhere among the nation’s 100 largest metros are space-constrained homes more common than in McAllen, Texas. An estimated 50.1% of the 281,450 occupied homes in this South Texas metro are space-constrained, with more than 0.5 occupants per room. It’s the only metro among the 100 biggest where at least half of the homes are space-constrained.
Several metros come close to that 50.0% threshold, however. Fresno, Calif., is second on the list at 47.2%, followed closely by Honolulu (46.8%), Los Angeles (46.6%) and Bakersfield, Calif. (46.4%). Overall, seven of the 10 metros with the highest rates of space-constrained homes are in California, with Stockton, Riverside, San Jose and San Diego joining the three aforementioned Golden State metros. New York and Miami round out the top 10.
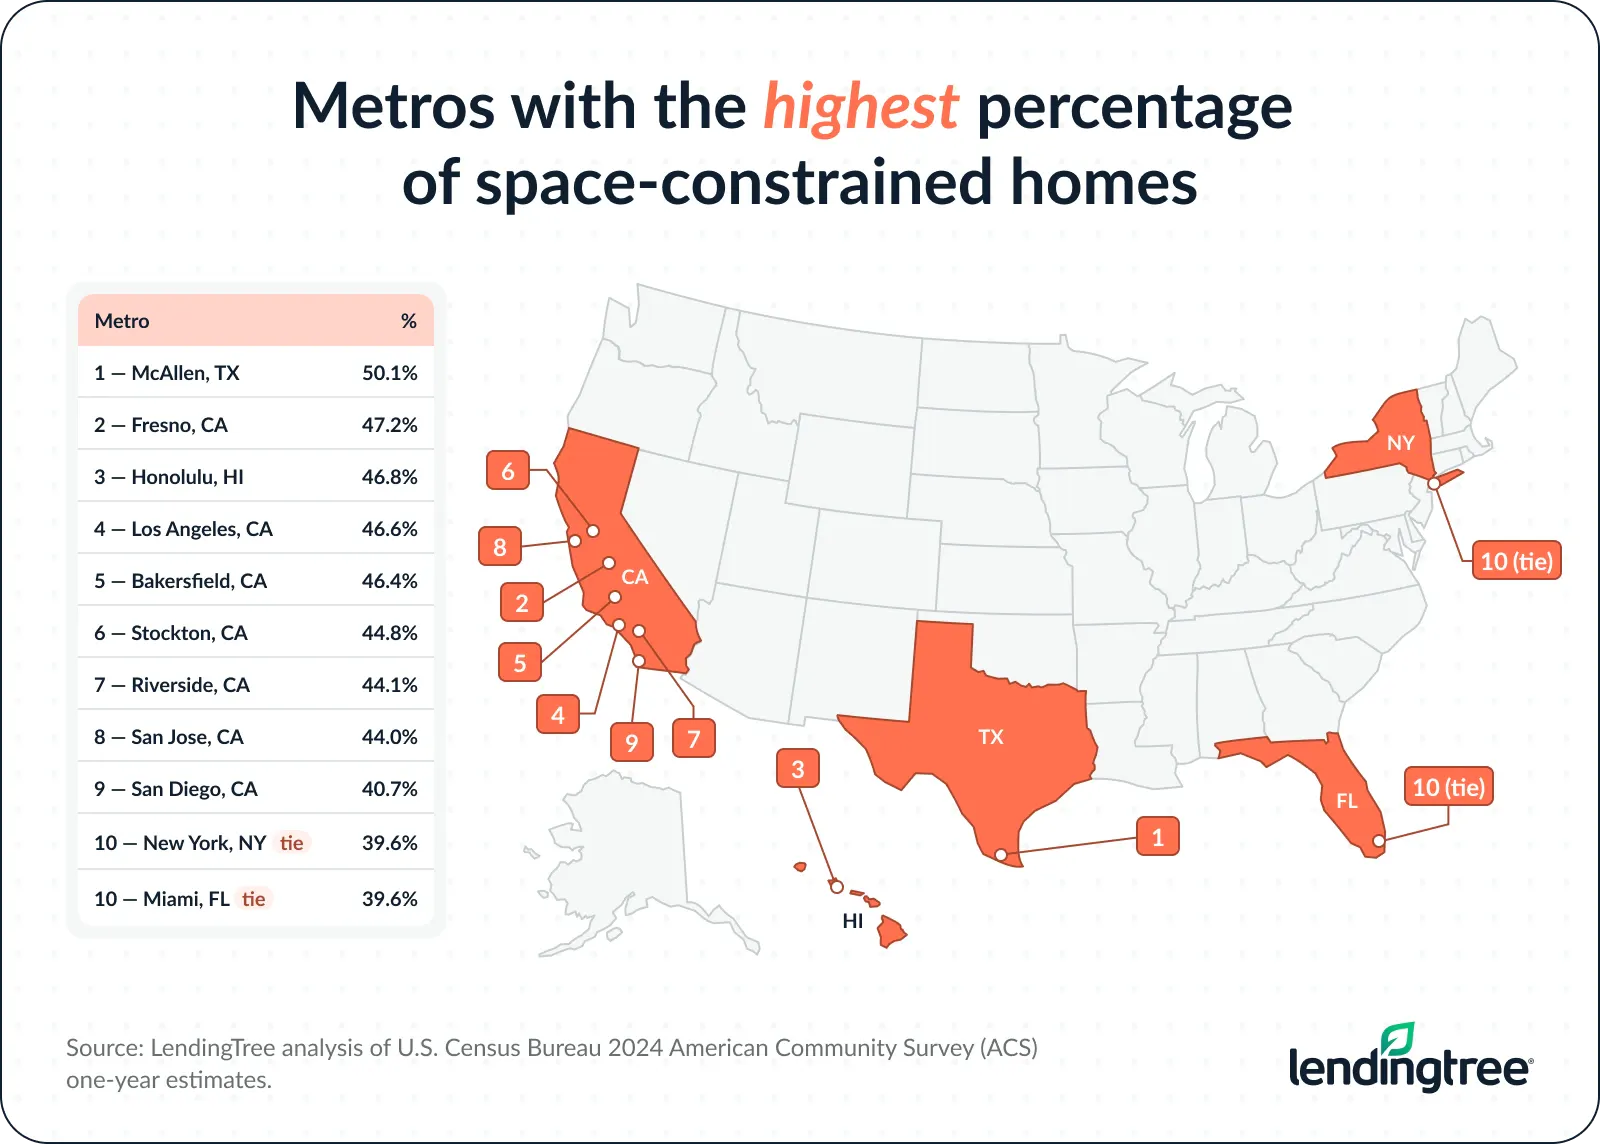
Texas and California dominate the rest of the top 20 as well. Four Texas metros (El Paso, Houston, Dallas and San Antonio) and three in California (San Francisco, Oxnard and Sacramento) all have at least 33.1% of homes that meet our definition of space-constrained.
At the other end of the list, Pittsburgh (16.6%) and Cleveland (17.8%) have the lowest shares of space-constrained homes.
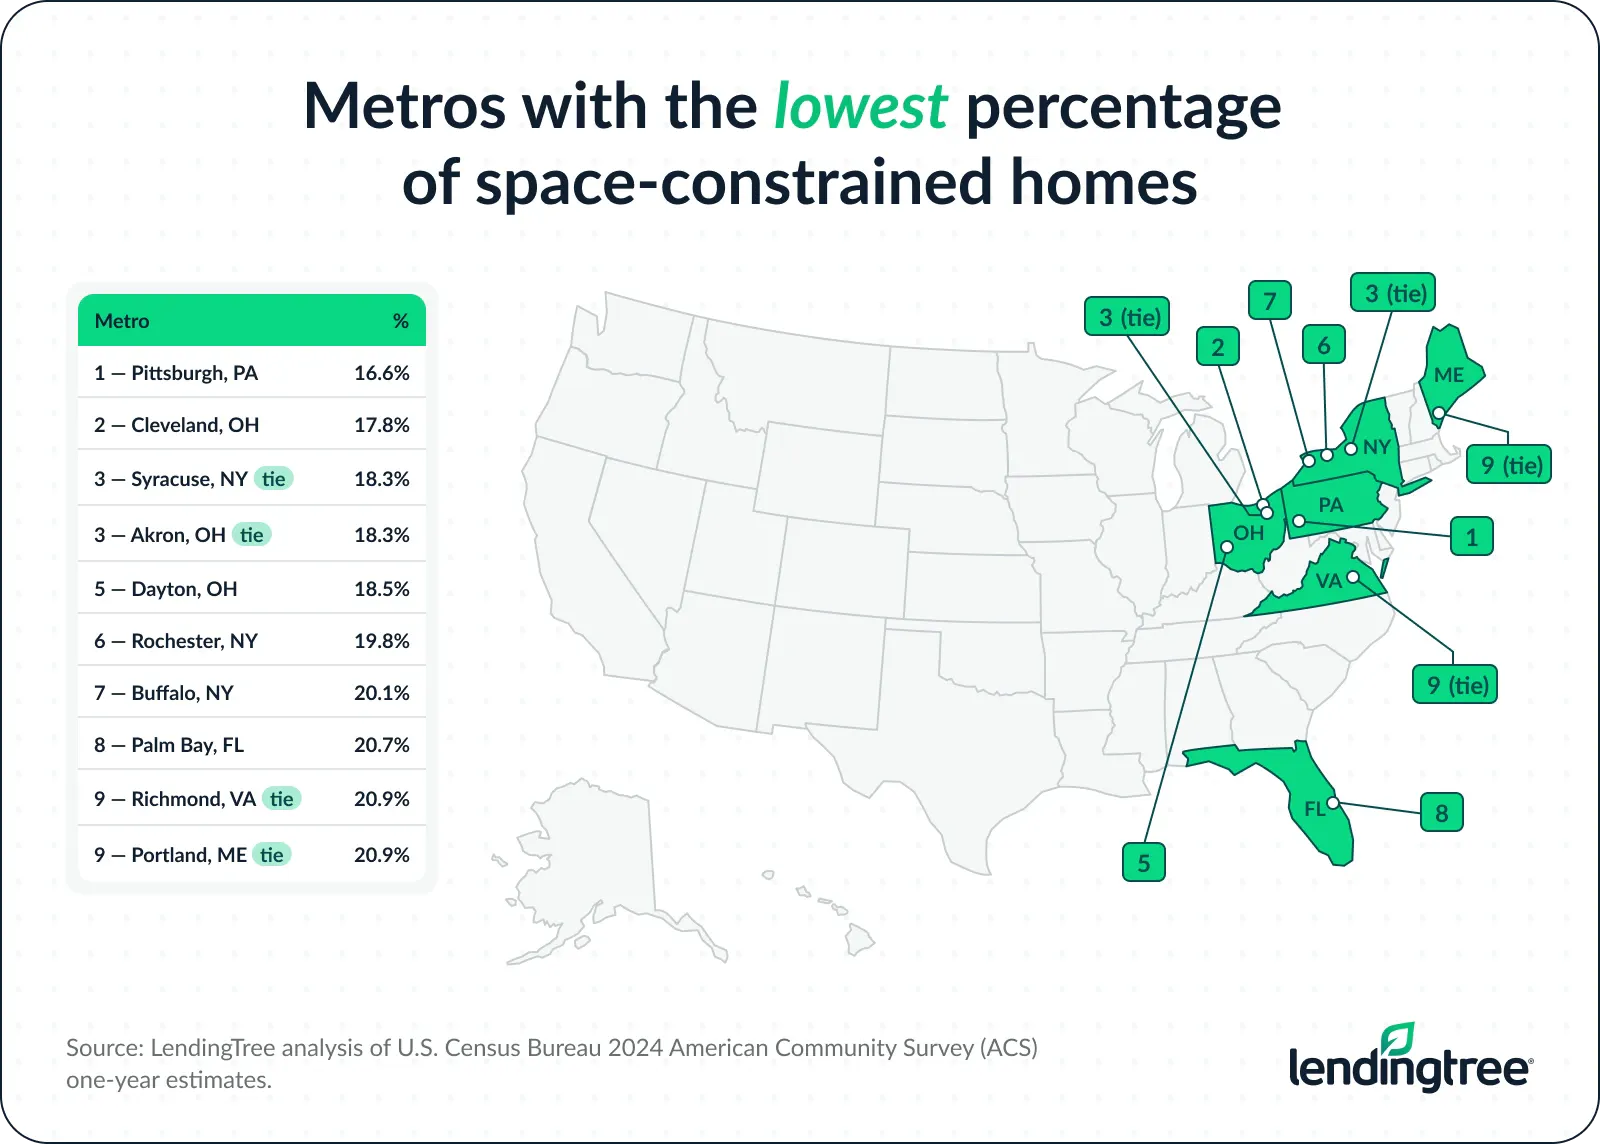
While Texas and California dominate the top of the list, Ohio and New York dominate the bottom. Six of the seven metros with the lowest shares of space-constrained homes are in those two states, with Pittsburgh as the only exception. Akron and Dayton join Cleveland from the Buckeye State, while Syracuse, Rochester and Buffalo represent the Empire State.
Metros with the highest/lowest percentage of space-constrained homes
| Rank | Metro | Total occupied homes | Space-constrained homes | % of space-constrained homes |
|---|---|---|---|---|
| 1 | McAllen, TX | 281,450 | 140,886 | 50.1% |
| 2 | Fresno, CA | 379,101 | 179,053 | 47.2% |
| 3 | Honolulu, HI | 338,627 | 158,539 | 46.8% |
| 4 | Los Angeles, CA | 4,583,939 | 2,136,482 | 46.6% |
| 5 | Bakersfield, CA | 292,654 | 135,820 | 46.4% |
| 6 | Stockton, CA | 252,693 | 113,187 | 44.8% |
| 7 | Riverside, CA | 1,484,661 | 654,435 | 44.1% |
| 8 | San Jose, CA | 693,483 | 305,001 | 44.0% |
| 9 | San Diego, CA | 1,185,092 | 481,885 | 40.7% |
| 10 | New York, NY | 7,486,828 | 2,966,609 | 39.6% |
| 10 | Miami, FL | 2,382,154 | 943,425 | 39.6% |
| 12 | El Paso, TX | 302,873 | 118,845 | 39.2% |
| 13 | San Francisco, CA | 1,770,425 | 676,668 | 38.2% |
| 14 | Oxnard, CA | 282,950 | 103,002 | 36.4% |
| 15 | Houston, TX | 2,768,708 | 980,905 | 35.4% |
| 16 | Sacramento, CA | 900,218 | 306,756 | 34.1% |
| 17 | Orlando, FL | 1,095,333 | 369,360 | 33.7% |
| 18 | Dallas, TX | 3,012,855 | 1,007,114 | 33.4% |
| 19 | San Antonio, TX | 1,006,232 | 332,687 | 33.1% |
| 20 | Reno, NV | 234,814 | 77,222 | 32.9% |
| 21 | Seattle, WA | 1,658,652 | 539,304 | 32.5% |
| 22 | Austin, TX | 1,061,155 | 344,093 | 32.4% |
| 23 | Las Vegas, NV | 890,338 | 286,496 | 32.2% |
| 24 | Phoenix, AZ | 1,967,378 | 618,883 | 31.5% |
| 25 | Salt Lake City, UT | 469,925 | 143,294 | 30.5% |
| 26 | Portland, OR | 1,026,663 | 311,998 | 30.4% |
| 27 | San Juan, PR | 799,804 | 238,216 | 29.8% |
| 28 | Oklahoma City, OK | 588,886 | 174,110 | 29.6% |
| 29 | Boston, MA | 1,970,240 | 575,555 | 29.2% |
| 30 | Chicago, IL | 3,690,402 | 1,070,176 | 29.0% |
| 30 | Worcester, MA | 340,956 | 98,847 | 29.0% |
| 32 | Kiryas Joel, NY | 257,898 | 74,469 | 28.9% |
| 32 | Lakeland, FL | 314,272 | 90,736 | 28.9% |
| 34 | Boise, ID | 323,571 | 92,661 | 28.6% |
| 34 | Washington, DC | 2,415,530 | 690,058 | 28.6% |
| 36 | Tulsa, OK | 421,385 | 119,255 | 28.3% |
| 37 | Bridgeport, CT | 359,988 | 101,436 | 28.2% |
| 38 | Nashville, TN | 869,185 | 237,866 | 27.4% |
| 39 | Tucson, AZ | 453,787 | 123,609 | 27.2% |
| 39 | Providence, RI | 683,183 | 185,827 | 27.2% |
| 41 | Tampa, FL | 1,377,328 | 365,414 | 26.5% |
| 42 | Jacksonville, FL | 707,683 | 186,161 | 26.3% |
| 43 | Greensboro, NC | 329,625 | 85,978 | 26.1% |
| 44 | Albuquerque, NM | 378,607 | 98,383 | 26.0% |
| 45 | Spokane, WA | 245,144 | 63,388 | 25.9% |
| 46 | Baton Rouge, LA | 343,718 | 88,317 | 25.7% |
| 47 | Hartford, CT | 469,594 | 120,131 | 25.6% |
| 48 | Des Moines, IA | 307,502 | 77,954 | 25.4% |
| 49 | Charlotte, NC | 1,128,197 | 285,235 | 25.3% |
| 50 | Jackson, MS | 241,889 | 61,007 | 25.2% |
| 51 | Cape Coral, FL | 337,411 | 83,840 | 24.8% |
| 51 | Columbus, OH | 880,121 | 218,681 | 24.8% |
| 51 | Atlanta, GA | 2,390,346 | 593,760 | 24.8% |
| 51 | Omaha, NE | 400,079 | 99,147 | 24.8% |
| 55 | Little Rock, AR | 321,875 | 79,557 | 24.7% |
| 55 | Denver, CO | 1,265,606 | 312,143 | 24.7% |
| 55 | Deltona, FL | 307,872 | 75,909 | 24.7% |
| 58 | Colorado Springs, CO | 316,919 | 77,865 | 24.6% |
| 59 | Madison, WI | 309,316 | 75,360 | 24.4% |
| 60 | Charleston, SC | 353,647 | 85,894 | 24.3% |
| 60 | Grand Rapids, MI | 447,475 | 108,634 | 24.3% |
| 60 | Augusta, GA | 250,386 | 60,729 | 24.3% |
| 63 | New Orleans, LA | 403,456 | 96,656 | 24.0% |
| 64 | Wichita, KS | 260,869 | 62,199 | 23.8% |
| 65 | Memphis, TN | 527,810 | 124,948 | 23.7% |
| 66 | Kansas City, MO | 914,522 | 215,470 | 23.6% |
| 67 | Raleigh, NC | 623,704 | 146,512 | 23.5% |
| 67 | Chattanooga, TN | 239,474 | 56,193 | 23.5% |
| 69 | Knoxville, TN | 394,645 | 92,462 | 23.4% |
| 69 | Columbia, SC | 351,807 | 82,365 | 23.4% |
| 71 | Indianapolis, IN | 869,616 | 202,628 | 23.3% |
| 72 | Philadelphia, PA | 2,505,818 | 578,858 | 23.1% |
| 72 | Minneapolis, MN | 1,508,526 | 347,858 | 23.1% |
| 74 | Milwaukee, WI | 663,225 | 152,260 | 23.0% |
| 75 | Greenville, SC | 399,170 | 91,284 | 22.9% |
| 76 | Allentown, PA | 341,143 | 77,024 | 22.6% |
| 77 | Albany, NY | 398,349 | 89,619 | 22.5% |
| 78 | Louisville, KY | 570,303 | 127,656 | 22.4% |
| 79 | Birmingham, AL | 476,816 | 106,072 | 22.2% |
| 79 | North Port, FL | 421,244 | 93,675 | 22.2% |
| 81 | Detroit, MI | 1,777,768 | 392,688 | 22.1% |
| 81 | Baltimore, MD | 1,140,975 | 251,812 | 22.1% |
| 83 | Cincinnati, OH | 922,646 | 203,031 | 22.0% |
| 83 | Virginia Beach, VA | 717,911 | 157,806 | 22.0% |
| 85 | Scranton, PA | 238,281 | 52,150 | 21.9% |
| 86 | Durham, NC | 257,745 | 56,247 | 21.8% |
| 87 | St. Louis, MO | 1,178,246 | 255,339 | 21.7% |
| 88 | Harrisburg, PA | 251,165 | 54,067 | 21.5% |
| 89 | Toledo, OH | 257,906 | 54,902 | 21.3% |
| 90 | Winston-Salem, NC | 300,531 | 63,736 | 21.2% |
| 91 | Portland, ME | 248,586 | 52,041 | 20.9% |
| 91 | Richmond, VA | 554,412 | 115,927 | 20.9% |
| 93 | Palm Bay, FL | 267,461 | 55,409 | 20.7% |
| 94 | Buffalo, NY | 504,693 | 101,478 | 20.1% |
| 95 | Rochester, NY | 449,215 | 88,740 | 19.8% |
| 96 | Dayton, OH | 347,200 | 64,207 | 18.5% |
| 97 | Akron, OH | 303,143 | 55,479 | 18.3% |
| 97 | Syracuse, NY | 275,626 | 50,389 | 18.3% |
| 99 | Cleveland, OH | 936,673 | 167,116 | 17.8% |
| 100 | Pittsburgh, PA | 1,071,618 | 177,843 | 16.6% |
The estimated rental premium for a third bedroom averages nearly 30%
Our analysis looked at all occupied homes, whether rented or owned. However, to get a sense of how much it would cost to upgrade to a bigger home, we focused on rental costs. What we found was not great news for those struggling with space constraints.
Across the nation’s 100 biggest metros, we estimated that the average premium for a three-bedroom rental compared with a two-bedroom rental is $494 per month, with an average percentage premium of 29.0%.
The average rent increase for moving from a two-bedroom to a three-bedroom rental is far bigger than the increases seen with other upgrades. Moving from one bedroom to two would cost an additional $271 per month, while going from three to four bedrooms would cost an additional $339 per month.
The 29.0% premium for upgrading from two to three bedrooms is also significantly higher than the 19.0% premium for moving from one to two bedrooms and the 15.4% premium for moving from three to four bedrooms.
The cost of renting a home with an extra bedroom
| Upgrade | Cost | % premium |
|---|---|---|
| From 1 to 2 bedrooms | $271 | 19.0% |
| From 2 to 3 bedrooms | $494 | 29.0% |
| From 3 to 4 bedrooms | $339 | 15.4% |
Western metros have the highest estimated rental premiums for a third bedroom
The cost of upgrading from a two-bedroom to a three-bedroom rental varies enormously across the nation’s 100 largest metros.
In dollar terms, the upgrade costs the most in San Jose, Calif., at $1,125 more per month. The premium tops $900 in just three other metros: Honolulu ($978), San Francisco ($924) and San Diego ($920). Notably, six of the eight most expensive metros by dollar premium are in California.
Meanwhile, getting a third bedroom is the least expensive in San Juan, Puerto Rico, at $213 per month, followed by Akron, Ohio ($243), and Jackson, Miss. ($254).
When comparing by percentage, six Western metros tie for the highest third-bedroom premium at 38.5%: Fresno, Calif.; Tucson, Ariz.; Honolulu; Colorado Springs, Colo.; Bakersfield, Calif.; and Stockton, Calif. Of the 20 metros with the biggest increases, just two of them — Virginia Beach, Va., and Lakeland, Fla. — are east of the Mississippi River.
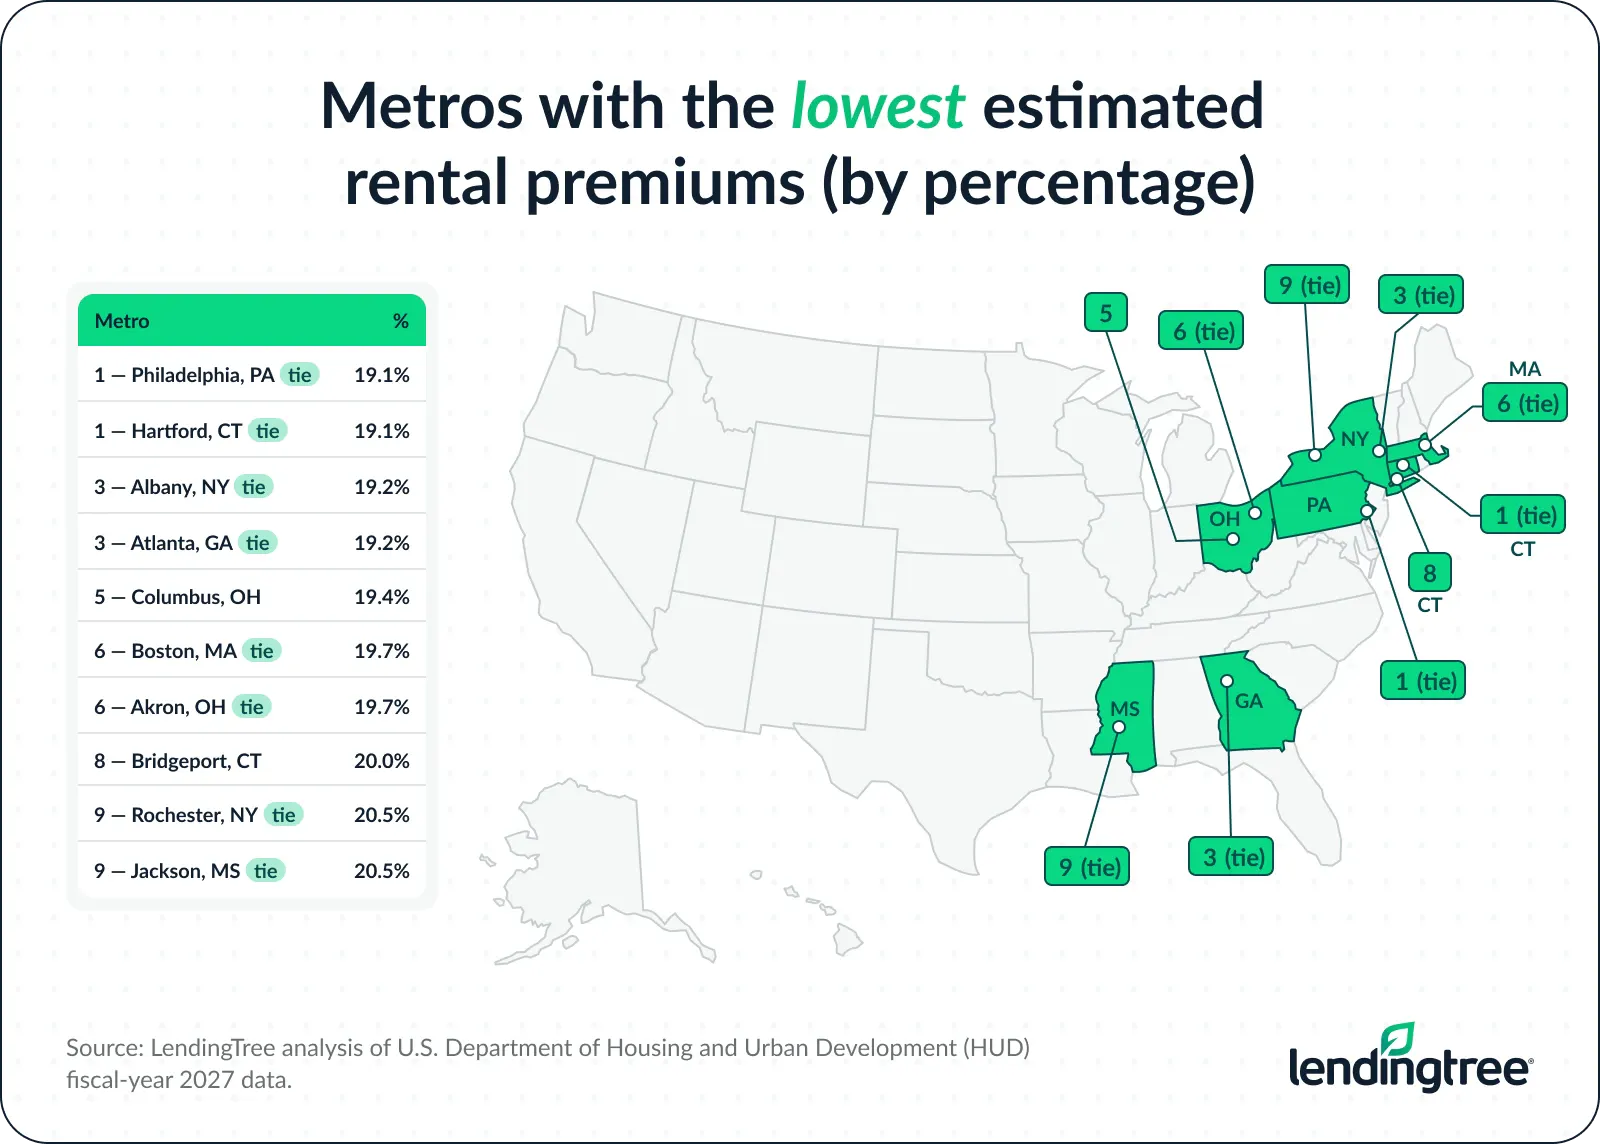
At the other end, Philadelphia and Hartford, Conn., have the lowest estimated percentage premium at 19.1%. Albany, N.Y., and Atlanta are just a tick higher, both at 19.2%, and Columbus, Ohio, isn’t far behind at 19.4%.
In all, there are 25 metros where upgrading from a two-bedroom to a three-bedroom rental would require no more than an estimated 25% increase in rent.
Metros with the highest/lowest estimated rental premiums (by percentage)
| Rank | Metro | 2-bedroom Fair Market Rent | 3-bedroom Fair Market Rent | $ increase | % increase |
|---|---|---|---|---|---|
| 1 | Tucson, AZ | $1,405 | $1,946 | $541 | 38.5% |
| 1 | Colorado Springs, CO | $1,616 | $2,238 | $622 | 38.5% |
| 1 | Honolulu, HI | $2,542 | $3,520 | $978 | 38.5% |
| 1 | Bakersfield, CA | $1,656 | $2,293 | $637 | 38.5% |
| 1 | Stockton, CA | $2,015 | $2,790 | $775 | 38.5% |
| 1 | Fresno, CA | $1,654 | $2,290 | $636 | 38.5% |
| 7 | Boise, ID | $1,528 | $2,115 | $587 | 38.4% |
| 8 | Virginia Beach, VA | $1,663 | $2,292 | $630 | 37.9% |
| 9 | Lakeland, FL | $1,608 | $2,212 | $604 | 37.6% |
| 10 | Albuquerque, NM | $1,384 | $1,902 | $518 | 37.4% |
| 10 | Las Vegas, NV | $1,686 | $2,317 | $631 | 37.4% |
| 12 | Spokane, WA | $1,464 | $2,007 | $543 | 37.1% |
| 13 | Des Moines, IA | $1,341 | $1,829 | $488 | 36.4% |
| 14 | El Paso, TX | $1,145 | $1,558 | $412 | 36.0% |
| 15 | Portland, OR | $1,878 | $2,550 | $672 | 35.8% |
| 16 | Oxnard, CA | $2,424 | $3,287 | $863 | 35.6% |
| 17 | Oklahoma City, OK | $1,246 | $1,688 | $442 | 35.5% |
| 18 | Houston, TX | $1,485 | $2,001 | $516 | 34.8% |
| 19 | San Jose, CA | $3,263 | $4,388 | $1,125 | 34.5% |
| 20 | Little Rock, AR | $1,116 | $1,497 | $381 | 34.1% |
| 21 | Palm Bay, FL | $1,779 | $2,382 | $603 | 33.9% |
| 21 | Reno, NV | $1,776 | $2,377 | $602 | 33.9% |
| 23 | Winston-Salem, NC | $1,271 | $1,692 | $421 | 33.1% |
| 24 | Omaha, NE | $1,443 | $1,915 | $472 | 32.7% |
| 24 | Salt Lake City, UT | $1,586 | $2,104 | $518 | 32.7% |
| 26 | San Diego, CA | $2,823 | $3,743 | $920 | 32.6% |
| 27 | Deltona, FL | $1,688 | $2,232 | $544 | 32.2% |
| 28 | Wichita, KS | $1,043 | $1,378 | $335 | 32.1% |
| 29 | Phoenix, AZ | $1,734 | $2,287 | $553 | 31.9% |
| 29 | Seattle, WA | $2,438 | $3,215 | $777 | 31.9% |
| 31 | Sacramento, CA | $2,195 | $2,893 | $698 | 31.8% |
| 31 | Riverside, CA | $2,103 | $2,771 | $668 | 31.8% |
| 33 | Cincinnati, OH | $1,428 | $1,878 | $450 | 31.5% |
| 34 | Memphis, TN | $1,289 | $1,693 | $404 | 31.4% |
| 35 | Tulsa, OK | $1,214 | $1,594 | $380 | 31.3% |
| 36 | Denver, CO | $2,169 | $2,846 | $677 | 31.2% |
| 37 | San Juan, PR | $683 | $896 | $213 | 31.1% |
| 38 | Scranton, PA | $1,363 | $1,786 | $423 | 31.0% |
| 38 | Miami, FL | $2,434 | $3,189 | $754 | 31.0% |
| 40 | Madison, WI | $1,483 | $1,942 | $459 | 30.9% |
| 41 | Kansas City, MO | $1,543 | $2,015 | $473 | 30.6% |
| 41 | Minneapolis, MN | $1,725 | $2,251 | $527 | 30.6% |
| 43 | Dayton, OH | $1,248 | $1,623 | $375 | 30.0% |
| 44 | Indianapolis, IN | $1,521 | $1,972 | $451 | 29.6% |
| 44 | San Antonio, TX | $1,433 | $1,858 | $424 | 29.6% |
| 46 | Cape Coral, FL | $1,835 | $2,373 | $538 | 29.3% |
| 46 | San Francisco, CA | $3,157 | $4,081 | $924 | 29.3% |
| 48 | Los Angeles, CA | $2,987 | $3,856 | $869 | 29.1% |
| 49 | Greensboro, NC | $1,241 | $1,596 | $356 | 28.7% |
| 50 | Harrisburg, PA | $1,598 | $2,055 | $457 | 28.6% |
| 51 | New Orleans, LA | $1,474 | $1,894 | $421 | 28.5% |
| 52 | Nashville, TN | $1,755 | $2,253 | $498 | 28.4% |
| 53 | Chicago, IL | $1,963 | $2,519 | $556 | 28.3% |
| 53 | McAllen, TX | $1,017 | $1,305 | $288 | 28.3% |
| 53 | St. Louis, MO | $1,341 | $1,720 | $379 | 28.3% |
| 56 | Grand Rapids, MI | $1,545 | $1,978 | $433 | 28.1% |
| 57 | Pittsburgh, PA | $1,370 | $1,753 | $384 | 28.0% |
| 58 | Tampa, FL | $1,917 | $2,448 | $531 | 27.7% |
| 59 | Worcester, MA | $2,057 | $2,624 | $568 | 27.6% |
| 59 | Toledo, OH | $1,145 | $1,461 | $316 | 27.6% |
| 59 | Cleveland, OH | $1,262 | $1,610 | $348 | 27.6% |
| 59 | Washington, DC | $2,413 | $3,078 | $665 | 27.6% |
| 63 | Dallas, TX | $1,781 | $2,272 | $490 | 27.5% |
| 64 | Louisville, KY | $1,252 | $1,596 | $344 | 27.4% |
| 65 | Baton Rouge, LA | $1,135 | $1,443 | $308 | 27.2% |
| 66 | Portland, ME | $2,130 | $2,702 | $572 | 26.9% |
| 67 | North Port, FL | $2,188 | $2,775 | $587 | 26.8% |
| 68 | Austin, TX | $1,817 | $2,292 | $475 | 26.1% |
| 68 | Birmingham, AL | $1,339 | $1,688 | $350 | 26.1% |
| 70 | Knoxville, TN | $1,406 | $1,772 | $366 | 26.0% |
| 70 | Kiryas Joel, NY | $2,131 | $2,685 | $554 | 26.0% |
| 72 | Augusta, GA | $1,325 | $1,668 | $343 | 25.9% |
| 73 | Columbia, SC | $1,204 | $1,515 | $311 | 25.8% |
| 73 | New York, NY | $2,724 | $3,426 | $702 | 25.8% |
| 75 | Baltimore, MD | $2,006 | $2,509 | $503 | 25.1% |
| 76 | Allentown, PA | $1,862 | $2,328 | $466 | 25.0% |
| 77 | Orlando, FL | $1,959 | $2,445 | $486 | 24.8% |
| 78 | Raleigh, NC | $1,689 | $2,103 | $414 | 24.5% |
| 79 | Durham, NC | $1,697 | $2,111 | $414 | 24.4% |
| 80 | Charleston, SC | $1,884 | $2,336 | $452 | 24.0% |
| 81 | Charlotte, NC | $1,670 | $2,066 | $397 | 23.8% |
| 82 | Chattanooga, TN | $1,340 | $1,657 | $317 | 23.7% |
| 83 | Richmond, VA | $1,649 | $2,036 | $387 | 23.5% |
| 84 | Milwaukee, WI | $1,263 | $1,553 | $290 | 23.0% |
| 85 | Jacksonville, FL | $1,684 | $2,068 | $384 | 22.8% |
| 86 | Detroit, MI | $1,460 | $1,789 | $329 | 22.5% |
| 87 | Providence, RI | $1,917 | $2,346 | $429 | 22.4% |
| 88 | Buffalo, NY | $1,423 | $1,732 | $309 | 21.7% |
| 89 | Greenville, SC | $1,391 | $1,689 | $299 | 21.5% |
| 90 | Syracuse, NY | $1,493 | $1,808 | $315 | 21.1% |
| 91 | Jackson, MS | $1,240 | $1,494 | $254 | 20.5% |
| 91 | Rochester, NY | $1,416 | $1,706 | $290 | 20.5% |
| 93 | Bridgeport, CT | $2,399 | $2,878 | $479 | 20.0% |
| 94 | Akron, OH | $1,231 | $1,474 | $243 | 19.7% |
| 94 | Boston, MA | $2,823 | $3,378 | $555 | 19.7% |
| 96 | Columbus, OH | $1,585 | $1,892 | $307 | 19.4% |
| 97 | Atlanta, GA | $1,748 | $2,084 | $336 | 19.2% |
| 97 | Albany, NY | $1,711 | $2,039 | $328 | 19.2% |
| 99 | Hartford, CT | $1,933 | $2,303 | $370 | 19.1% |
| 99 | Philadelphia, PA | $1,860 | $2,216 | $356 | 19.1% |
Tips for making more space without stretching your budget
As our analysis made clear, a bigger home may give you more room, but it can also put more pressure on your budget. Before moving, make sure the math works.
- Add up the full cost. Don’t focus only on the monthly rent or mortgage payment. Include moving costs, deposits, utilities, renters insurance and other expenses. All these costs matter, and without taking them into account, you can’t fully understand how the move would impact your entire budget, including your ability to save, invest and work toward other financial goals.
- Look beyond the bedroom count. The number of bedrooms in a home doesn’t tell the whole story. Square footage is obviously important, too, as is the layout, storage capacity and many other factors. A well-designed two-bedroom may work better for your family than a three-bedroom that doesn’t use its space well.
- Broaden your search. Flexibility brings more options, and that can be huge in a home search. A wider search may give you a better chance of finding the room you need at a price you can manage. The key, however, is taking the time to understand what really matters to you. Some things are worth compromising on in pursuit of the perfect home, but others aren’t, and it is up to you to decide what those are.
- Make your current space work harder. Many homes can be made more functional with a little extra effort and planning. Decluttering, adding vertical storage and using furniture that serves more than one purpose may help. It won’t add square footage, but it could help you avoid an expensive move or at least buy you more time.
- Start planning before the need becomes urgent. If you expect your household to grow, begin researching housing costs and saving for a possible move now. Even a small head start can give you more choices and reduce the chance of making a rushed, costly decision. Start by throwing a few dollars a paycheck into an online high-yield savings account. Over time, you’ll be surprised how quickly it may grow.
Methodology
LendingTree analyzed the 100 largest U.S. metros to examine both household space constraints and the estimated cost of moving from a two-bedroom rental to a three-bedroom rental.
A space-constrained home is defined in our research as an occupied housing unit with more than 0.5 occupants per room. We ranked the metros from highest to lowest based on places with the highest percentage of space-constrained homes. We used the U.S. Census Bureau 2024 American Community Survey (ACS) one-year estimates to derive these figures.
We then estimated the premium that a renter would have to pay to move from a two-bedroom to a three-bedroom rental using fiscal-year 2027 county-level Fair Market Rents from the U.S. Department of Housing and Urban Development (HUD). Metro estimates of Fair Market Rents are population-weighted averages of county-level Fair Market Rents. We ranked metros by both the premium and the percentage premium.
View mortgage loan offers from up to 5 lenders in minutes