A Third of Recent Homebuyers Could Save an Average of $2,000+ a Year by Refinancing
Nearly 1 in 3 people who took out a 30-year, fixed-rate mortgage from 2023 to 2025 could save an average of $2,320 annually by refinancing at market rates observed in early April 2026.
LendingTree compared individual mortgage rates found in government-collected mortgage data from those three years to 6.37% — the average rate for a 30-year, fixed-rate mortgage in early April — to see how many borrowers had rates at least a half-point higher.
The good news is that 32.5% fit that bill. Even better, if mortgage rates fall to 6.00%, roughly in line with levels seen before recent geopolitical tensions, 56.6% would stand to benefit from refinancing — 24.1 percentage points higher.
The percentage of borrowers from 2023 to 2025 who could benefit from refinancing varies significantly by state, as does their total possible savings. However, the sheer number of Americans who may have an opportunity for meaningful savings in a time marked by rising prices and economic uncertainty is certainly noteworthy.
Here’s more on what we found.
- Nearly 1 in 3 recent homebuyers could lower their mortgage payment by refinancing. Based on average rates observed in early April 2026, the average interest rate on a 30-year, fixed-rate mortgage in the U.S. was 6.37%. If they refinanced at that rate, 32.5% of borrowers who took out a 30-year mortgage from 2023 to 2025 could benefit, with potential savings of $193 a month or $2,320 annually. The earlier you borrowed, the more likely you are to benefit.
- If rates fall to 6.00%, more than half of recent homebuyers could benefit from refinancing. Mortgage rates briefly dipped below 6.00% earlier this year, before rising amid geopolitical tensions. Should they fall back to that level soon, 56.6% of recent homebuyers could benefit from refinancing.
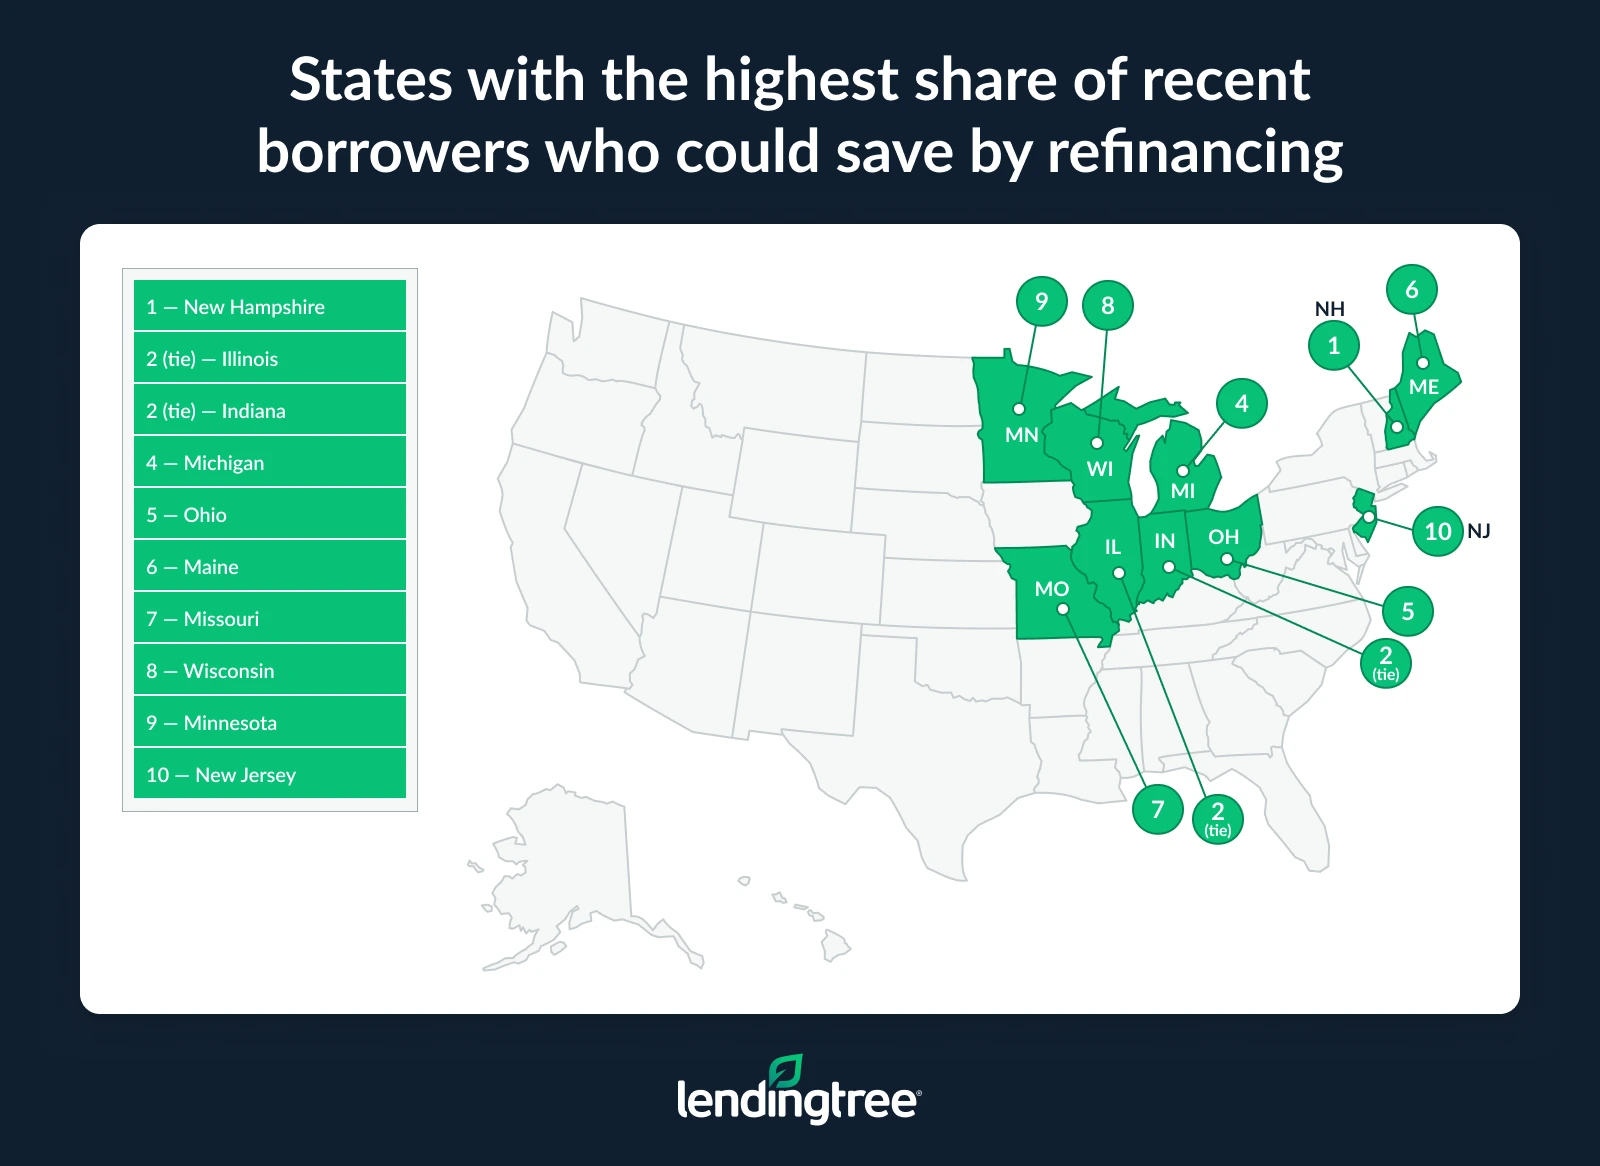
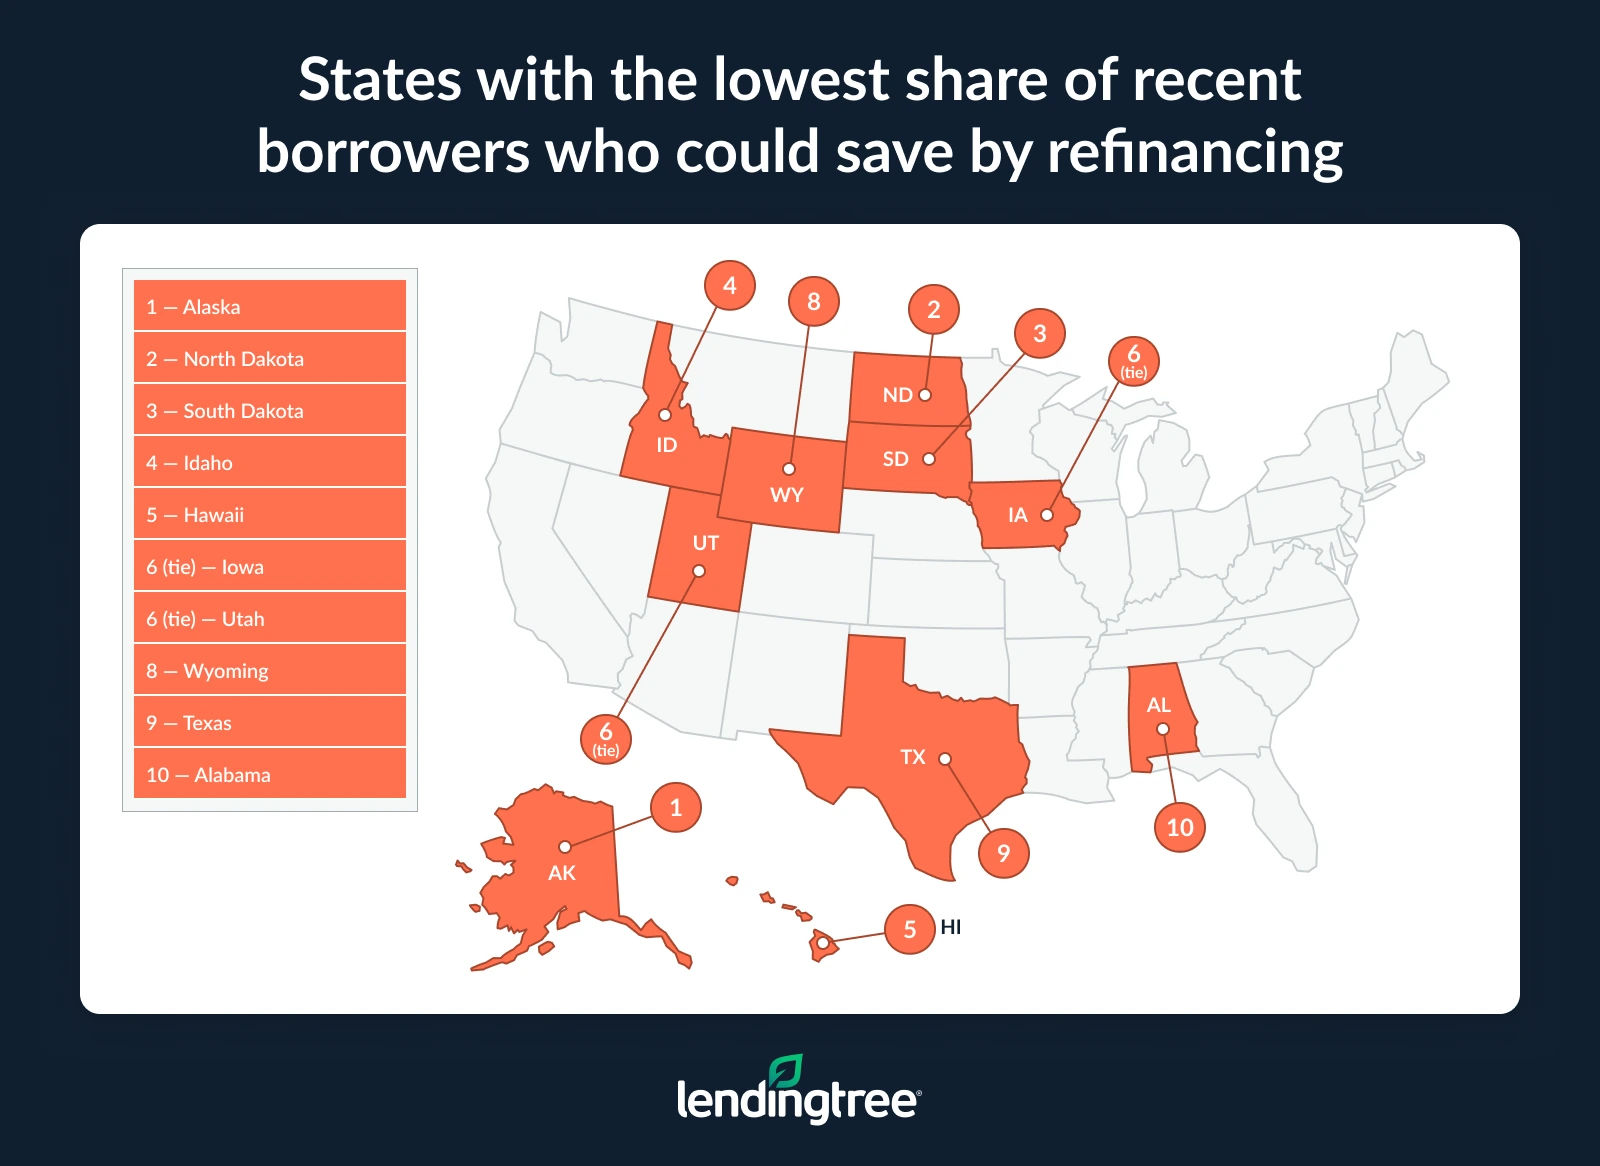
- In some Northeastern and Midwestern states, more than 40.0% of recent borrowers could benefit from refinancing at 6.37%. New Hampshire leads at 42.5%, followed closely by Illinois and Indiana (both at 42.4%). The percentage who could benefit is lowest in Alaska (20.0%), North Dakota (21.7%) and South Dakota (22.8%).
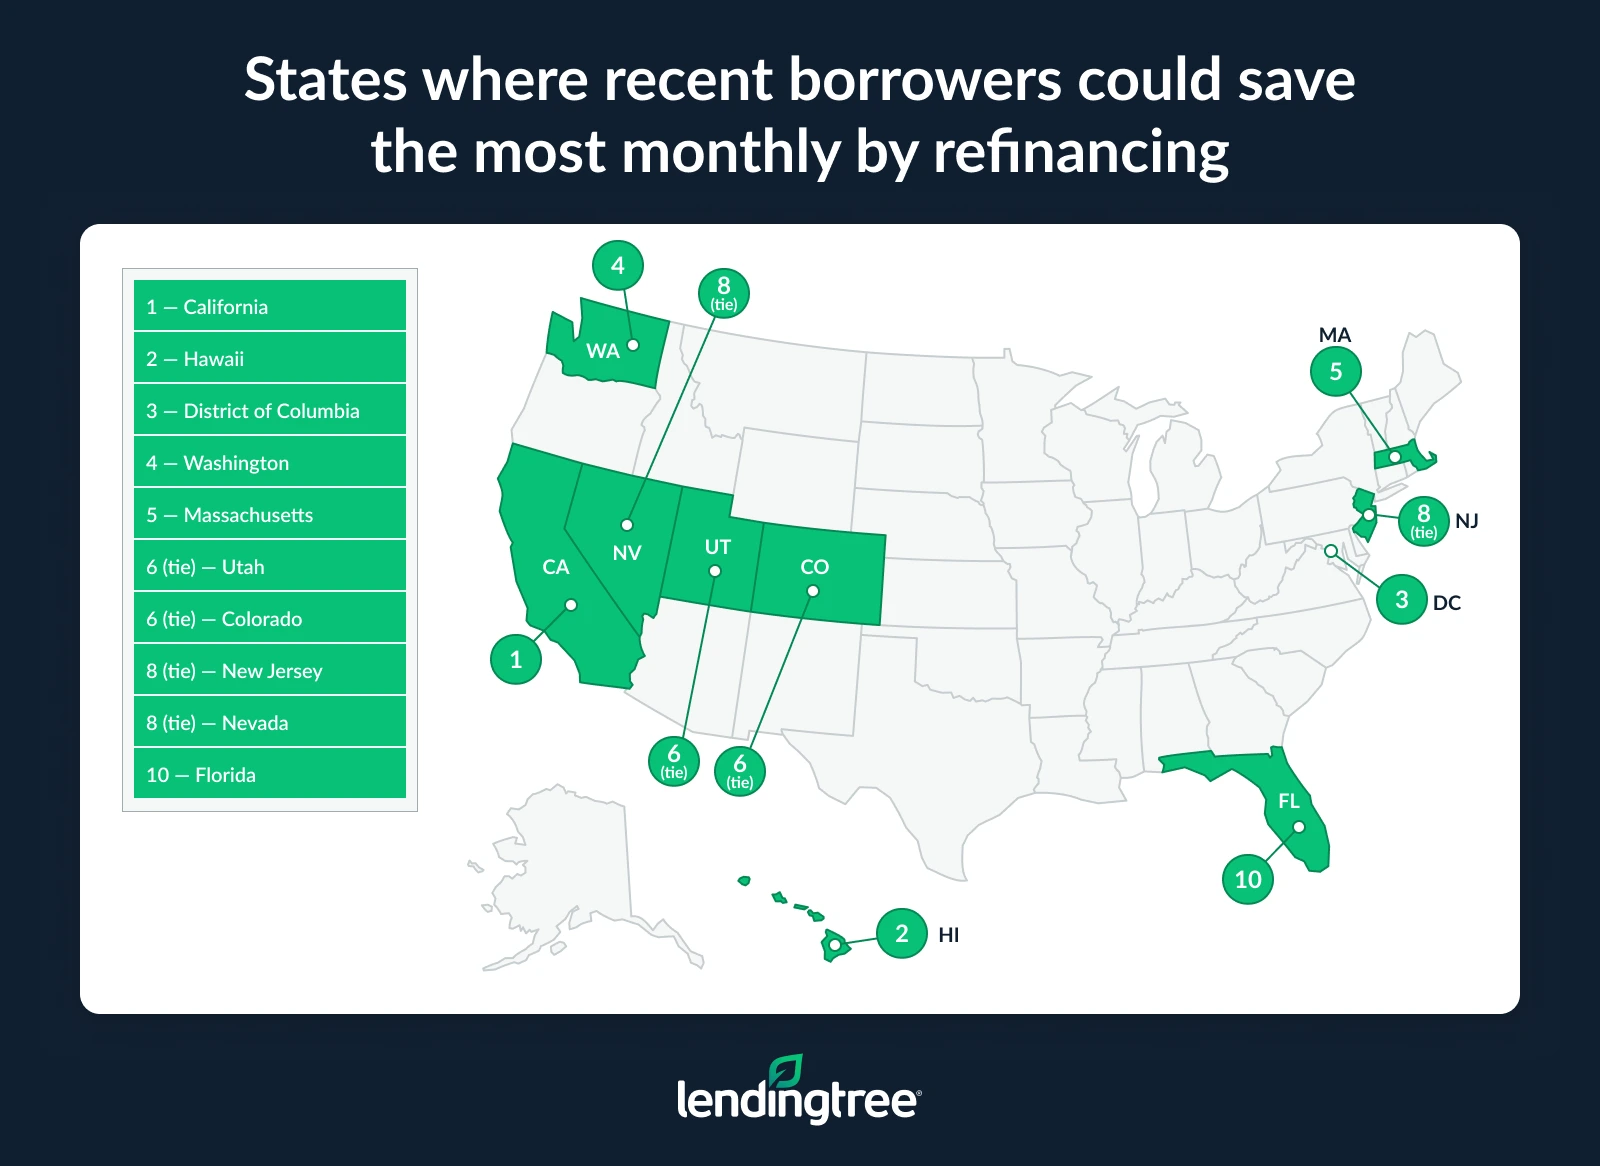
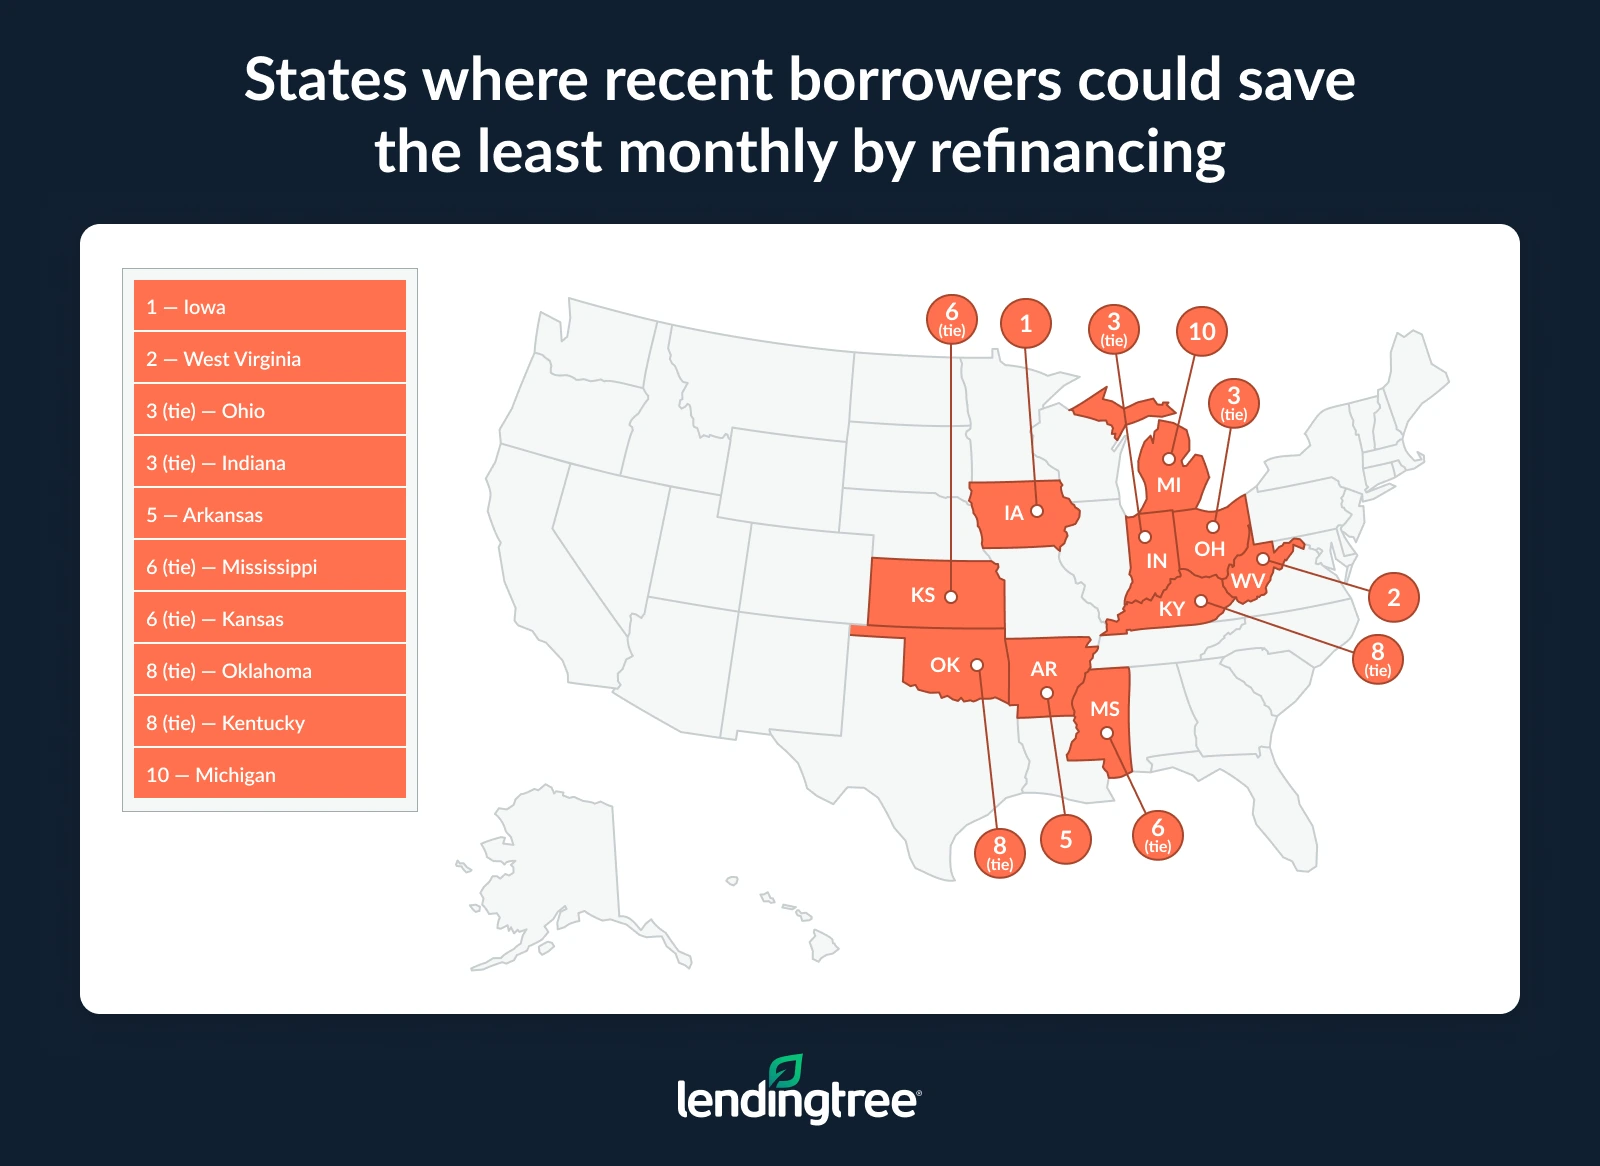
- Borrowers in higher-cost states could see the largest savings from refinancing at 6.37%, exceeding $300 a month in California and Hawaii. Californians could save $363 monthly on average, followed by those in Hawaii ($355) and the District of Columbia ($273). Even in lower-cost states, savings remain meaningful, with borrowers in Iowa, West Virginia, Ohio and Indiana saving at least $110 a month.
Why wait until rates drop by at least half a point before refinancing?
The average interest rate for a 30-year, fixed-rate mortgage in early April 2026, according to Freddie Mac, was 6.37%. In crafting our report, we considered borrowers whose rates are at least half a point higher than that rate to be candidates for refinancing.
Why half a point? Refinancing isn’t free — it typically costs 2% to 6% of the loan amount, or $8,000 to $24,000 on a $400,000 mortgage — and a half-point drop typically lowers your monthly payment enough to help you recoup those upfront costs in a reasonable amount of time.
That’s the whole ballgame. Refinancing can save you real money, but there’s no point if it takes so long to break even on the upfront costs that you never really see meaningful savings.
Nearly 1 in 3 recent homebuyers could lower their mortgage payment by refinancing at 6.37%
In October 2023, the average rate for a 30-year, fixed-rate mortgage in the U.S. was 7.79%, the highest since November 2000, according to Freddie Mac.
However, mortgage rates have fallen since then, which is better news for people in the market for a new home. In early April 2026, when LendingTree did this analysis, the average interest rate on a 30-year fixed mortgage stood at 6.37% — nearly a point-and-a-half lower than that 2023 high.
When rates fall that far, it creates an opportunity for those who bought at the higher rate because it makes refinancing a viable option. Knowing that, LendingTree analyzed mortgage data to see what percentage of borrowers from 2023 to 2025 are poised to take advantage.
We found that if they refinanced at that 6.37% rate, 32.5% of borrowers who took out a 30-year mortgage in that period could benefit. The potential savings totaled $193 a month or $2,320 annually.
The earlier you borrowed, the more likely you are to benefit from refinancing. Among those who purchased in 2023, 37.7% did so with rates that were a half-point or more higher than that 6.37% rate. Their potential savings: $223 a month. That’s a far better spot than 2024 borrowers (34.7% could benefit at an average of $191 a month) and 2025 borrowers (25.1% at $152) are in, though the savings are still significant for those groups, too.
Refinancing potential by origination year (based on 6.37% rate)
| Year of original mortgage | % with rates ≥0.50 pts above 6.37% | Avg. monthly savings | Avg. annual savings |
|---|---|---|---|
| 2025 | 25.1% | $152 | $1,822 |
| 2024 | 34.7% | $191 | $2,291 |
| 2023 | 37.7% | $223 | $2,680 |
| 2023-25 | 32.5% | $193 | $2,320 |
If rates fall to 6.00% or lower, even more recent buyers could benefit from refinancing
Mortgage rates falling from 7.79% to 6.37% is a really big deal, but rates were even better for a brief time. On Feb. 26, 2026, the average rate on a 30-year, fixed mortgage fell to 5.98%, the first time below 6.00% since September 2022. It made headlines and likely spurred at least some folks to jump back into the housing market after sitting on the sidelines for several years.
Unfortunately, it didn’t stay under 6.00% for long — just one week. The war in Iran began shortly thereafter, pushing rates significantly higher for several consecutive weeks. They topped out at 6.46% in the first week of April before dipping to the 6.37% rate we included in this analysis.
Still, we know that rates can be volatile, even weekly. As part of our analysis, we looked at how many borrowers from that 2023-25 window could benefit from refinancing if rates fell to the 6.00% level. We found that 56.6% of recent homebuyers could benefit in that case — 24.1 percentage points higher than at 6.37%. That figure grows to 59.9% among those who borrowed in 2024.
Refinancing potential by origination year (based on assumed 6.00% rate)
| Year of original mortgage | % with rates ≥0.50 pts above 6.37% | % with rates ≥0.50 pts above 6.00% | Additional share (% points) |
|---|---|---|---|
| 2025 | 25.1% | 51.7% | 26.6 |
| 2024 | 34.7% | 59.9% | 25.2 |
| 2023 | 37.7% | 58.1% | 20.4 |
| 2023-25 | 32.5% | 56.6% | 24.1 |
In some states, more than 40.0% of recent borrowers could benefit from refinancing at 6.37%
When zooming in to analyze the data at a state level, we saw wide variations in the percentages of recent borrowers who could benefit from refinancing at 6.37%. In some cases, the share in one state was roughly double that of another.
New Hampshire leads the nation, with 42.5% of borrowers during that period who could benefit from refinancing at 6.37%. Illinois and Indiana (both at 42.4%) aren’t far behind, as Midwestern states dominate the top 10.
At the other end, just 20.0% of recent borrowers in Alaska could benefit from refinancing at 6.37%, less than half of the percentage seen at the top of the list. North Dakota (21.7%) and South Dakota (22.8%) don’t fare much better.
As with the top 10, many of the bottom 10 states are clustered together, with several of the Dakotas’ neighbors joining them.
Drop rates down to 6.00%, and the list looks a bit different. More than 7 in 10 (70.5%) recent borrowers in Michigan could benefit from refinancing in that case — the highest in the nation — followed by New Hampshire and Illinois (both 68.8%). Just 41.8% of recent borrowers in North Dakota could benefit from 6.00% rates, the lowest in the nation.
Here’s how the percentages break down by state at 6.37%.
Percentage of recent borrowers who could benefit from refinancing at 6.37% (by state)
| Rank | State | % of 2023 borrowers who could benefit | % of 2024 borrowers who could benefit | % of 2025 borrowers who could benefit | % of 2023-25 borrowers who could benefit |
|---|---|---|---|---|---|
| 1 | New Hampshire | 48.4% | 47.2% | 32.8% | 42.5% |
| 2 | Illinois | 44.3% | 46.9% | 35.5% | 42.4% |
| 2 | Indiana | 49.9% | 44.1% | 33.4% | 42.4% |
| 4 | Michigan | 49.9% | 44.0% | 31.4% | 41.8% |
| 5 | Ohio | 47.0% | 44.9% | 32.6% | 41.4% |
| 6 | Maine | 46.8% | 42.6% | 31.1% | 39.9% |
| 7 | Missouri | 47.1% | 42.0% | 29.6% | 39.5% |
| 8 | Wisconsin | 45.7% | 39.8% | 29.0% | 37.9% |
| 9 | Minnesota | 42.1% | 41.6% | 28.8% | 37.4% |
| 10 | New Jersey | 40.4% | 40.1% | 30.7% | 37.2% |
| 11 | Rhode Island | 43.8% | 36.6% | 28.3% | 36.0% |
| 12 | Connecticut | 41.0% | 37.6% | 28.8% | 35.8% |
| 13 | Oklahoma | 43.8% | 37.7% | 24.5% | 35.1% |
| 14 | Kansas | 42.1% | 37.1% | 26.4% | 35.0% |
| 15 | Washington | 39.0% | 37.5% | 28.0% | 34.8% |
| 16 | Kentucky | 39.3% | 38.5% | 26.7% | 34.7% |
| 17 | Pennsylvania | 39.5% | 36.8% | 27.5% | 34.5% |
| 18 | Massachusetts | 38.3% | 36.9% | 25.4% | 33.5% |
| 19 | Vermont | 41.2% | 36.1% | 23.3% | 33.1% |
| 20 | Oregon | 39.2% | 34.5% | 25.4% | 32.9% |
| 21 | Delaware | 39.8% | 33.4% | 25.2% | 32.7% |
| 21 | California | 35.3% | 35.0% | 27.5% | 32.7% |
| 23 | New Mexico | 36.7% | 34.2% | 26.5% | 32.5% |
| 23 | Nebraska | 41.9% | 33.8% | 22.4% | 32.5% |
| 25 | Maryland | 37.3% | 34.8% | 24.5% | 32.3% |
| 26 | New York | 36.5% | 35.5% | 23.5% | 31.8% |
| 27 | Arkansas | 39.6% | 32.2% | 22.0% | 31.1% |
| 28 | Florida | 35.6% | 32.0% | 24.3% | 30.8% |
| 29 | West Virginia | 36.5% | 31.9% | 23.7% | 30.7% |
| 30 | Tennessee | 35.5% | 32.7% | 22.1% | 30.0% |
| 30 | Virginia | 35.3% | 32.7% | 22.2% | 30.0% |
| 32 | Georgia | 35.3% | 31.4% | 22.1% | 29.7% |
| 32 | Louisiana | 36.9% | 30.7% | 21.8% | 29.7% |
| 34 | District of Columbia | 31.9% | 33.8% | 22.0% | 29.4% |
| 34 | Nevada | 32.9% | 30.8% | 24.1% | 29.4% |
| 36 | North Carolina | 34.4% | 31.7% | 21.4% | 29.1% |
| 37 | Montana | 36.5% | 29.1% | 21.8% | 29.0% |
| 38 | Colorado | 32.8% | 32.4% | 20.9% | 28.7% |
| 39 | Arizona | 32.6% | 30.2% | 22.3% | 28.4% |
| 39 | South Carolina | 34.0% | 30.3% | 21.3% | 28.4% |
| 41 | Mississippi | 35.8% | 27.8% | 21.4% | 28.2% |
| 42 | Alabama | 34.8% | 28.2% | 19.2% | 27.3% |
| 43 | Texas | 32.5% | 28.4% | 20.4% | 27.2% |
| 44 | Wyoming | 33.6% | 28.3% | 19.0% | 26.7% |
| 45 | Utah | 32.4% | 26.9% | 19.6% | 26.1% |
| 45 | Iowa | 32.7% | 26.9% | 18.8% | 26.1% |
| 47 | Hawaii | 28.4% | 28.7% | 21.1% | 26.0% |
| 48 | Idaho | 29.5% | 26.8% | 16.7% | 24.0% |
| 49 | South Dakota | 30.4% | 23.4% | 15.1% | 22.8% |
| 50 | North Dakota | 28.5% | 22.1% | 14.8% | 21.7% |
| 51 | Alaska | 27.8% | 19.3% | 13.2% | 20.0% |
Borrowers in higher-cost states see the largest savings from refinancing at 6.37%
When continuing to dive into the data at the state level, we found even wider variation when it came to potential savings from refinancing than we did in the percentage of borrowers who could benefit. Some states’ borrowers stood to save more than three times what other states’ borrowers could.
Perhaps unsurprisingly, some of the nation’s most expensive states to live in had the highest potential savings. We found that Californians could save $363 monthly on average, followed by Hawaii ($355), the District of Columbia ($273), Washington state ($259) and Massachusetts ($246). In all, 17 states saw potential savings of at least $200.
At the bottom of the list, borrowers in Iowa could save $110 a month. That’s less than a third of what borrowers in California and Hawaii could save, but perspective is important. For most families throughout our country, an extra $110 each month would make a big difference. It would significantly grow their financial margin for error each month, allowing them to perhaps put more toward paying down debt, building an emergency fund, growing their retirement savings or pursuing other financial goals.
Joining Iowa at the bottom of the list are West Virginia ($112), Ohio and Indiana (both at $123), and Arkansas ($125). Again, nowhere near the savings possible in some other states, but meaningful amounts nonetheless.
Estimated monthly savings for recent borrowers if they refinanced at 6.37% (by state)
| Rank | State | Avg. monthly savings, 2023 borrowers | Avg. monthly savings, 2024 borrowers | Avg. monthly savings, 2025 borrowers | Avg. monthly savings, 2023-25 borrowers |
|---|---|---|---|---|---|
| 1 | California | $413 | $365 | $294 | $363 |
| 2 | Hawaii | $418 | $354 | $281 | $355 |
| 3 | District of Columbia | $316 | $273 | $202 | $273 |
| 4 | Washington | $313 | $257 | $190 | $259 |
| 5 | Massachusetts | $292 | $241 | $187 | $246 |
| 6 | Utah | $276 | $238 | $188 | $240 |
| 6 | Colorado | $284 | $232 | $180 | $240 |
| 8 | New Jersey | $270 | $232 | $192 | $235 |
| 8 | Nevada | $266 | $235 | $190 | $235 |
| 10 | Florida | $255 | $224 | $181 | $226 |
| 11 | Oregon | $266 | $218 | $166 | $223 |
| 12 | Arizona | $255 | $219 | $173 | $221 |
| 13 | Maryland | $250 | $207 | $159 | $212 |
| 14 | New York | $241 | $205 | $175 | $211 |
| 15 | Connecticut | $230 | $202 | $164 | $202 |
| 16 | New Hampshire | $242 | $197 | $155 | $201 |
| 16 | Idaho | $239 | $186 | $166 | $201 |
| 18 | Montana | $236 | $191 | $151 | $199 |
| 19 | Virginia | $231 | $196 | $151 | $198 |
| 19 | Rhode Island | $228 | $199 | $156 | $198 |
| 21 | Georgia | $223 | $192 | $155 | $196 |
| 22 | Texas | $224 | $191 | $154 | $195 |
| 23 | Alaska | $204 | $181 | $147 | $184 |
| 23 | Delaware | $218 | $180 | $136 | $184 |
| 25 | Tennessee | $209 | $177 | $142 | $181 |
| 26 | North Carolina | $204 | $169 | $141 | $175 |
| 27 | Wyoming | $201 | $171 | $127 | $172 |
| 28 | Maine | $204 | $168 | $128 | $170 |
| 28 | South Carolina | $195 | $168 | $134 | $170 |
| 30 | New Mexico | $198 | $166 | $124 | $167 |
| 31 | Vermont | $190 | $160 | $116 | $160 |
| 32 | Illinois | $181 | $150 | $116 | $152 |
| 33 | Minnesota | $182 | $146 | $110 | $149 |
| 33 | South Dakota | $171 | $148 | $110 | $149 |
| 33 | North Dakota | $169 | $143 | $120 | $149 |
| 36 | Pennsylvania | $168 | $142 | $109 | $143 |
| 37 | Wisconsin | $167 | $136 | $104 | $139 |
| 38 | Alabama | $159 | $133 | $107 | $137 |
| 39 | Louisiana | $155 | $131 | $108 | $135 |
| 40 | Missouri | $158 | $130 | $99 | $133 |
| 41 | Nebraska | $159 | $126 | $95 | $132 |
| 42 | Michigan | $152 | $128 | $103 | $131 |
| 43 | Kentucky | $152 | $126 | $100 | $128 |
| 43 | Oklahoma | $151 | $122 | $100 | $128 |
| 45 | Kansas | $153 | $123 | $94 | $127 |
| 45 | Mississippi | $147 | $123 | $99 | $127 |
| 47 | Arkansas | $145 | $120 | $99 | $125 |
| 48 | Indiana | $147 | $121 | $90 | $123 |
| 48 | Ohio | $144 | $120 | $97 | $123 |
| 50 | West Virginia | $133 | $109 | $85 | $112 |
| 51 | Iowa | $130 | $107 | $82 | $110 |
Next steps if you’re considering refinancing
While mortgage rates remain elevated compared to pandemic-era lows, millions of homeowners who bought in the past few years may now have an opportunity to meaningfully reduce their monthly costs. Even small rate decreases can bring real savings, particularly for those who purchased when rates were near their peak.
Still, refinancing isn’t a one-size-fits-all solution. Borrowers need to weigh upfront costs, how long they plan to stay in their home and how much they stand to save before making a move. For many, however, the potential savings highlighted in this analysis show that keeping an eye on rates could pay off in a big way.
If you think refinancing could make sense for you, here are a few important steps to take before getting started:
- Calculate your break-even point: Refinancing typically costs 2% to 6% of your loan amount. Divide those upfront costs by your expected monthly savings to see how long it’ll take to break even and make sure you plan to stay in the home long enough to benefit.
- Check your credit and understand your overall financial profile: Your credit score, income and debt levels all play a major role in the rate you’ll qualify for. Improving your credit or paying down debt before refinancing could mean a noticeably lower rate. Even a modest improvement in those two areas can pay dividends when it’s time to apply.
- Shop around: Rates and fees can vary widely by lender. Taking the time to compare offers from multiple lenders through sites like LendingTree can help ensure you’re getting the best possible deal.
Methodology
LendingTree researchers analyzed 2023-25 Home Mortgage Disclosure Act (HMDA) Modified Loan Application Register (LAR) data, focusing on originated first-lien home purchase loans for primary residences with 30-year terms. Loans with nonstandard features, including interest-only, balloon, negative amortization and introductory-rate structures, were excluded.
We identified borrowers as being able to benefit from refinancing if their original mortgage rate was at least 50 basis points higher than the Freddie Mac Primary Mortgage Market Survey average 30-year fixed rate of 6.37% as of April 9, 2026.
Monthly savings were calculated as the difference between the borrower’s original monthly payment and the estimated payment under a new 30-year refinance at 6.37%, including estimated refinancing costs. For each borrower, the remaining loan balance was estimated assuming a midyear origination date — equating to 32 months of payments for 2023 loans, 20 months for 2024 loans and eight months for 2025 loans as of April 2026. Refinancing costs were estimated at 3% of the remaining balance and rolled into the new loan amount.
View mortgage loan offers from up to 5 lenders in minutes