Poor Credit Raises Auto Insurance Premiums by 68% on Average, Costing Drivers $1,553 More Per Year


Poor credit can cost you in more ways than higher borrowing costs. It can also make your car insurance significantly more expensive. A LendingTree analysis found that drivers with poor credit pay an average of 68.2% more for full coverage auto insurance than drivers with good credit. That difference adds up to an extra $1,553.49 per year, or $4,660.46 over three years.
Where you live also matters when it comes to the cost of auto insurance. Several states prohibit or limit the use of credit information when insurers set auto insurance rates, creating wide differences in how much drivers pay across the country.
Lenders generally consider FICO Scores from 670 to 739 to be good credit, while scores from 300 to 579 fall into the poor range. Those ranges provide a helpful point of reference, but they don’t line up exactly with the credit categories used in this study.
This analysis relies on credit categories from Quadrant Information Services. Because Quadrant doesn’t disclose the credit score ranges behind those categories, there’s no way to know what it considers “good” or “poor” credit. Auto insurers also use credit-based insurance scores, which differ from the traditional credit scores lenders use.
- Annual auto insurance premiums increase by an average of 68.2% nationwide for drivers with poor credit compared with those with good credit. Average full coverage premiums rise from $2,277.15 with good credit to $3,830.63 with poor credit — a $1,553.49 annual increase, or $4,660.46 over three years.
- Poor-credit drivers in the District of Columbia, Virginia and New York see the largest percentage increases. Premiums more than double in each jurisdiction, rising 118.9% in D.C., 113.7% in Virginia and 110.1% in New York.
- Drivers in the District of Columbia, New York and Rhode Island face the biggest dollar increases. D.C. drivers with poor credit pay $3,431.60 more per year, followed by New York at $2,873.50 and Rhode Island at $2,681.67.
- California, Massachusetts, Hawaii and Michigan show no premium difference between good and poor credit in this analysis. Each has a 0.0% increase, reflecting state restrictions on the use of credit scores in setting auto insurance premiums.
- By age, 80-year-old drivers see the largest percentage increase between good and poor credit. Their average premiums rise 87.0%, from $2,625 to $4,910. Meanwhile, 20-year-old drivers see the largest dollar increase of $3,514 per year.
Poor-credit drivers pay an average of $1,553 more per year for full coverage
Poor credit doesn’t just make borrowing more expensive. It can also add hundreds of dollars to your car insurance bill every month. On average, drivers with poor credit pay 68.2% more for full coverage auto insurance than drivers with good credit, increasing annual premiums from $2,277.15 to $3,830.63. That works out to about $129 more per month, $1,553.49 more per year and an additional $4,660.46 over three years.
Annual auto insurance premiums for drivers with good and poor credit
| Avg. premium, good credit | $2,277.15 |
| Avg. premium, poor credit | $3,830.63 |
| Percentage increase | 68.2% |
| Annual dollar increase | $1,553.49 |
| 3-year dollar increase | $4,660.46 |
Credit can have a big impact on how much you pay for car insurance. In states where insurers use credit information, poor credit ranks among the biggest nondriving factors affecting premiums. In fact, the 68.2% increase in premiums for drivers with poor credit is comparable to the premium hike that many drivers see after a DUI, according to a separate LendingTree analysis.
Improving your credit can help you lower your insurance costs over time, but the financial benefits don’t stop there. “It’s generally good to prioritize improving your credit for several reasons,” says Rob Bhatt, insurance analyst for LendingTree and licensed insurance agent. “Good credit helps you get better interest rates on loans and credit cards, and lower insurance rates, too.”
At the same time, Bhatt recommends shopping around for insurance rates regularly because some insurers place less emphasis on credit than others.
Poor credit more than doubles premiums in 6 jurisdictions
Where you live can make a big difference in how much poor credit affects your car insurance rates. In five states and the District of Columbia, drivers with poor credit pay more than twice as much for full coverage auto insurance as drivers with good credit.
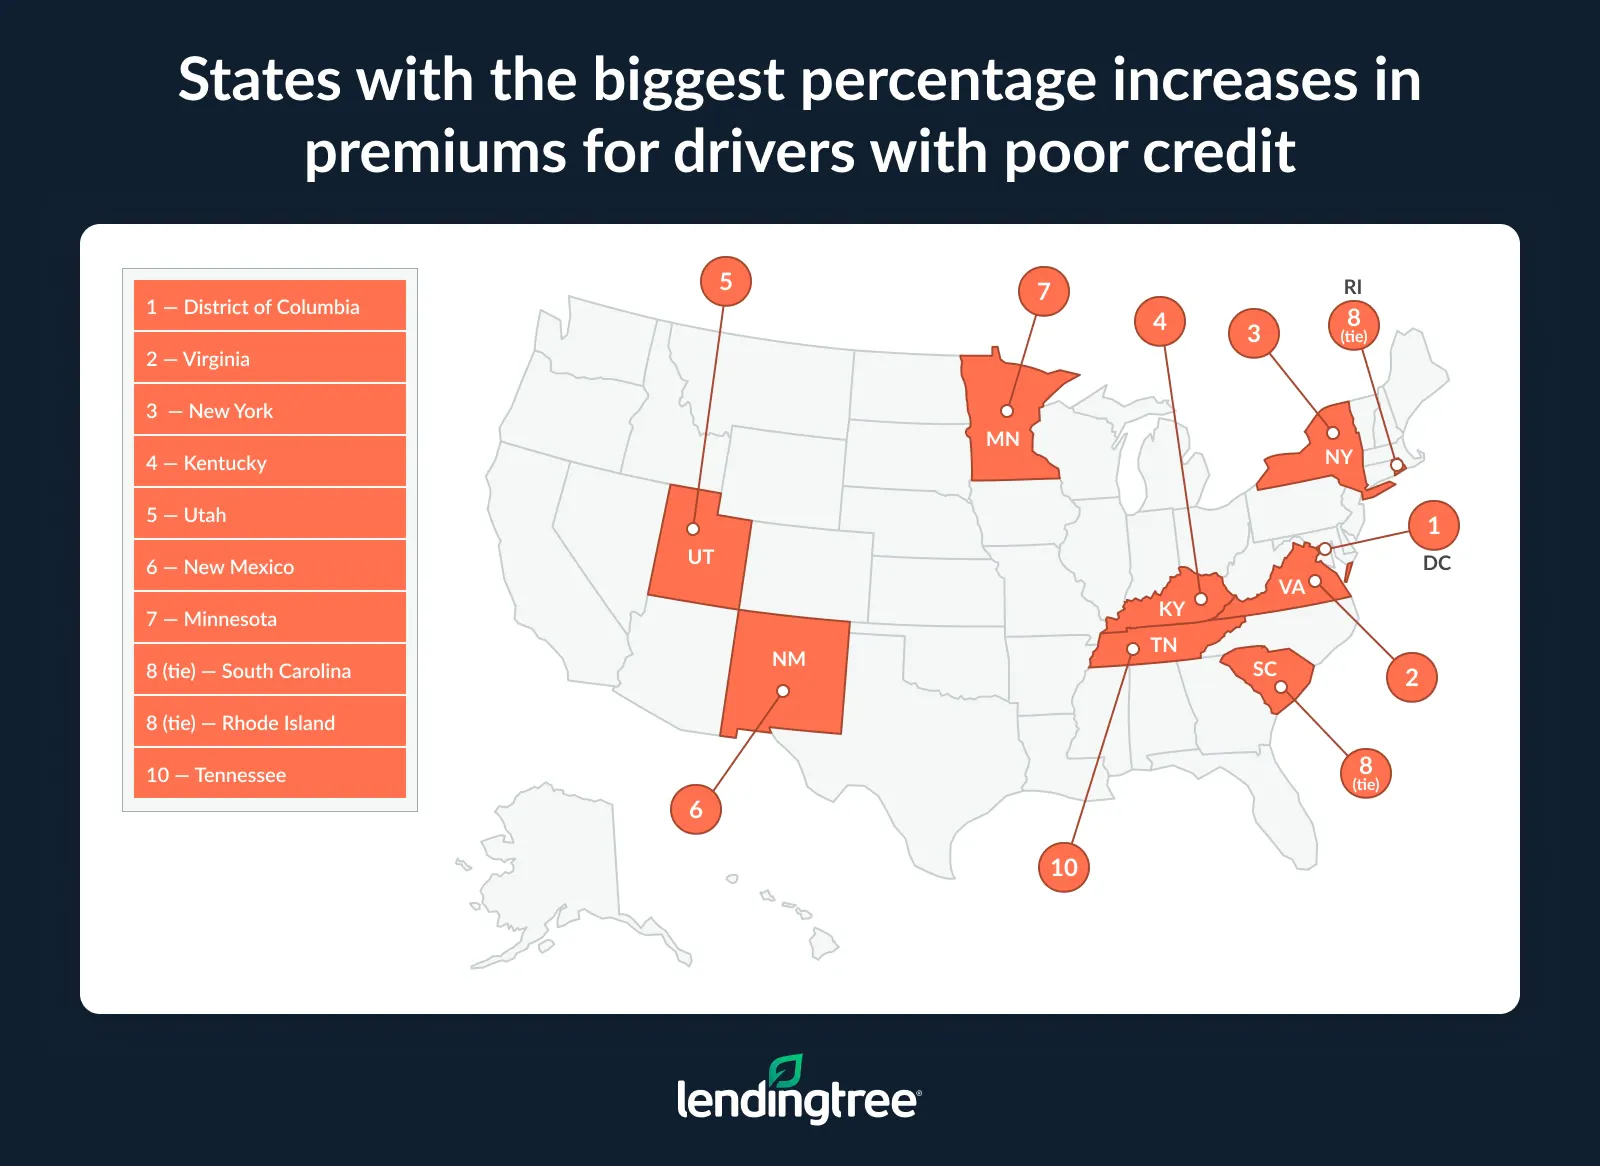
The District of Columbia sees the biggest increase, with premiums jumping 118.9% for drivers with poor credit. Virginia (113.7%) and New York (110.1%) aren’t far behind. Kentucky, Utah and New Mexico also see premiums more than double.
States with the biggest percentage increases in annual auto insurance premiums for drivers with poor credit
| Rank | State | Avg. premium, good credit | Avg. premium, poor credit | % increase |
|---|---|---|---|---|
| 1 | District of Columbia | $2,886.40 | $6,318.00 | 118.9% |
| 2 | Virginia | $1,718.50 | $3,673.00 | 113.7% |
| 3 | New York | $2,609.50 | $5,483.00 | 110.1% |
| 4 | Kentucky | $2,237.73 | $4,664.00 | 108.4% |
| 5 | Utah | $2,219.70 | $4,587.00 | 106.6% |
| 6 | New Mexico | $2,363.29 | $4,733.00 | 100.3% |
| 7 | Minnesota | $2,256.33 | $4,490.00 | 99.0% |
| 8 | South Carolina | $1,947.11 | $3,749.00 | 92.5% |
| 8 | Rhode Island | $2,898.33 | $5,580.00 | 92.5% |
| 10 | Tennessee | $1,943.27 | $3,619.00 | 86.2% |
| 11 | Wisconsin | $1,867.25 | $3,436.50 | 84.0% |
| 12 | Indiana | $1,703.82 | $3,126.00 | 83.5% |
| 13 | Mississippi | $2,106.91 | $3,851.00 | 82.8% |
| 14 | New Jersey | $3,188.46 | $5,741.00 | 80.1% |
| 15 | North Dakota | $1,944.36 | $3,484.00 | 79.2% |
| 16 | Maine | $1,245.60 | $2,225.50 | 78.7% |
| 17 | West Virginia | $1,705.78 | $3,035.00 | 77.9% |
| 18 | Colorado | $3,289.00 | $5,820.00 | 77.0% |
| 19 | Illinois | $2,114.67 | $3,703.00 | 75.1% |
| 20 | Nebraska | $2,250.58 | $3,901.00 | 73.3% |
| 21 | Georgia | $2,696.14 | $4,669.00 | 73.2% |
| 22 | Connecticut | $2,711.90 | $4,689.50 | 72.9% |
| 23 | South Dakota | $1,997.50 | $3,444.00 | 72.4% |
| 23 | Missouri | $2,559.00 | $4,411.00 | 72.4% |
| 23 | Montana | $2,365.86 | $4,078.00 | 72.4% |
| 26 | Kansas | $2,391.08 | $4,119.00 | 72.3% |
| 27 | Vermont | $1,345.40 | $2,307.00 | 71.5% |
| 27 | Ohio | $1,677.82 | $2,877.00 | 71.5% |
| 29 | Arkansas | $2,771.85 | $4,629.00 | 67.0% |
| 30 | Louisiana | $4,005.50 | $6,672.00 | 66.6% |
| 31 | Delaware | $2,945.56 | $4,809.00 | 63.3% |
| 32 | Arizona | $3,819.67 | $6,217.50 | 62.8% |
| 33 | Texas | $2,635.50 | $4,282.00 | 62.5% |
| 34 | Pennsylvania | $2,129.60 | $3,456.00 | 62.3% |
| 35 | Wyoming | $1,323.00 | $2,113.50 | 59.8% |
| 36 | Alaska | $1,862.33 | $2,969.00 | 59.4% |
| 37 | Alabama | $2,117.00 | $3,366.00 | 59.0% |
| 38 | Oklahoma | $2,284.80 | $3,623.00 | 58.6% |
| 39 | Washington | $2,616.18 | $4,100.00 | 56.7% |
| 40 | Iowa | $2,015.62 | $3,145.00 | 56.0% |
| 41 | Maryland | $2,536.33 | $3,867.00 | 52.5% |
| 42 | Florida | $3,411.14 | $5,172.00 | 51.6% |
| 43 | Oregon | $2,146.46 | $3,249.00 | 51.4% |
| 44 | Idaho | $1,630.18 | $2,302.00 | 41.2% |
| 45 | New Hampshire | $1,531.30 | $2,123.00 | 38.6% |
| 46 | Nevada | $2,782.85 | $3,737.00 | 34.3% |
| 47 | North Carolina | $1,212.11 | $1,600.50 | 32.0% |
| 48 | California | $2,382.91 | $2,382.91 | 0.0% |
| 48 | Massachusetts | $1,710.15 | $1,710.15 | 0.0% |
| 48 | Hawaii | $1,562.71 | $1,562.71 | 0.0% |
| 48 | Michigan | $2,460.60 | $2,460.60 | 0.0% |
State insurance rules help explain why poor credit has a much bigger impact in some places than others. Each state decides whether insurers can use credit information when setting rates and, if they can, how much weight they can give it. That’s one reason why car insurance for bad credit can result in identical drivers paying dramatically different premiums depending on where they live.
“Insurance is offered and regulated at the state level,” Bhatt says. “All the factors that insurance companies look at to set rates, including credit, vary by state. These differences suggest that bad credit drivers have more costly claims in some states than they do in others.”
Drivers in one jurisdiction pay nearly $3,500 more annually because of poor credit
Poor credit costs some drivers far more than others. In the District of Columbia, having poor credit increases the average cost of full coverage auto insurance by $3,431.60 per year compared with drivers who have good credit. That’s nearly $286 more every month — enough to cover more than a third of the average new-car payment.
The second largest dollar increase is in New York, where poor credit costs drivers an average of $2,873.50 more per year. Rhode Island follows close behind at $2,681.67.
Over time, those higher premiums can add up to thousands of dollars that many households could put toward other financial goals instead.
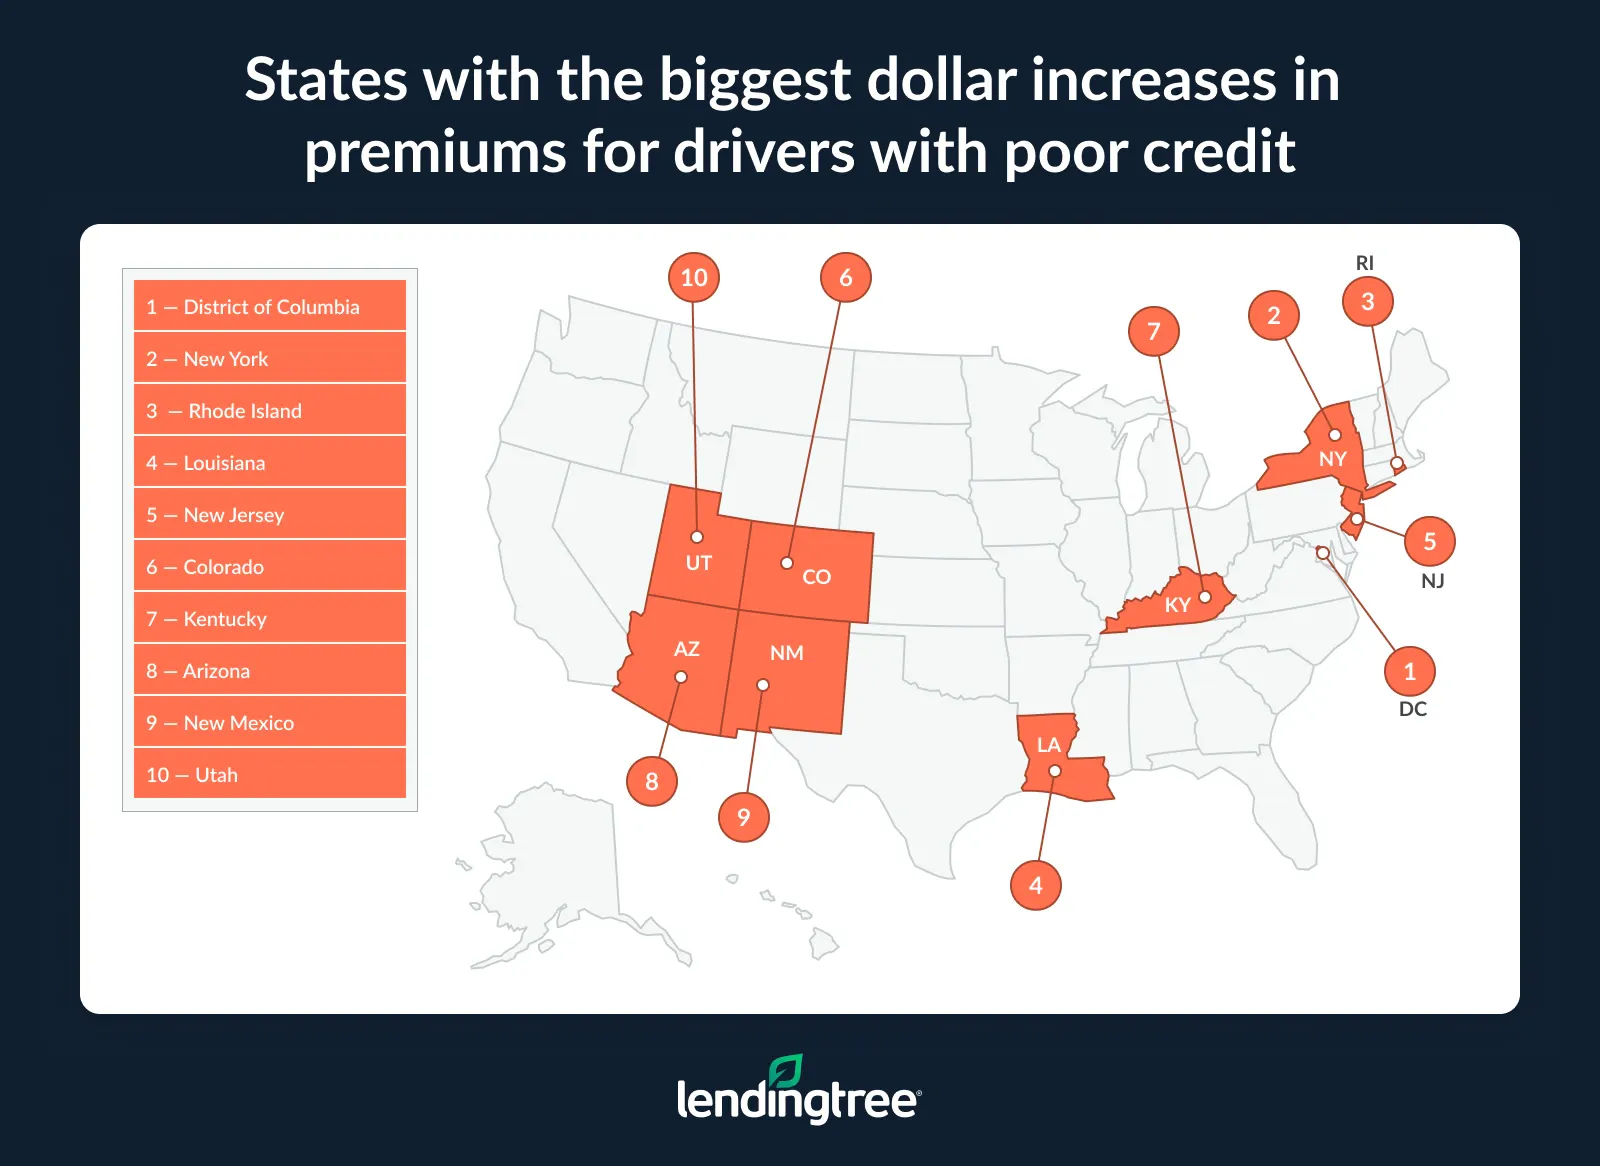
States with the biggest dollar increases in annual auto insurance premiums for drivers with poor credit
| Rank | State | Monthly increase, poor credit | Annual increase, poor credit | 3-year increase, poor credit |
|---|---|---|---|---|
| 1 | District of Columbia | $285.97 | $3,431.60 | $10,295 |
| 2 | New York | $239.46 | $2,873.50 | $8,621 |
| 3 | Rhode Island | $223.47 | $2,681.67 | $8,045 |
| 4 | Louisiana | $222.21 | $2,666.50 | $8,000 |
| 5 | New Jersey | $212.71 | $2,552.55 | $7,658 |
| 6 | Colorado | $210.92 | $2,531.00 | $7,593 |
| 7 | Kentucky | $202.19 | $2,426.27 | $7,279 |
| 8 | Arizona | $199.82 | $2,397.83 | $7,193 |
| 9 | New Mexico | $197.48 | $2,369.71 | $7,109 |
| 10 | Utah | $197.28 | $2,367.30 | $7,102 |
| 11 | Minnesota | $186.14 | $2,233.67 | $6,701 |
| 12 | Connecticut | $164.80 | $1,977.60 | $5,933 |
| 13 | Georgia | $164.41 | $1,972.86 | $5,919 |
| 14 | Virginia | $162.88 | $1,954.50 | $5,864 |
| 15 | Delaware | $155.29 | $1,863.44 | $5,590 |
| 16 | Arkansas | $154.76 | $1,857.15 | $5,571 |
| 17 | Missouri | $154.33 | $1,852.00 | $5,556 |
| 18 | South Carolina | $150.16 | $1,801.89 | $5,406 |
| 19 | Florida | $146.74 | $1,760.86 | $5,283 |
| 20 | Mississippi | $145.34 | $1,744.09 | $5,232 |
| 21 | Kansas | $143.99 | $1,727.92 | $5,184 |
| 22 | Montana | $142.68 | $1,712.14 | $5,136 |
| 23 | Tennessee | $139.64 | $1,675.73 | $5,027 |
| 24 | Nebraska | $137.54 | $1,650.42 | $4,951 |
| 25 | Texas | $137.21 | $1,646.50 | $4,940 |
| 26 | Illinois | $132.36 | $1,588.33 | $4,765 |
| 27 | Wisconsin | $130.77 | $1,569.25 | $4,708 |
| 28 | North Dakota | $128.30 | $1,539.64 | $4,619 |
| 29 | Washington | $123.65 | $1,483.82 | $4,451 |
| 30 | South Dakota | $120.54 | $1,446.50 | $4,340 |
| 31 | Indiana | $118.52 | $1,422.18 | $4,267 |
| 32 | Oklahoma | $111.52 | $1,338.20 | $4,015 |
| 33 | Maryland | $110.89 | $1,330.67 | $3,992 |
| 34 | West Virginia | $110.77 | $1,329.22 | $3,988 |
| 35 | Pennsylvania | $110.53 | $1,326.40 | $3,979 |
| 36 | Alabama | $104.08 | $1,249.00 | $3,747 |
| 37 | Ohio | $99.93 | $1,199.18 | $3,598 |
| 38 | Iowa | $94.12 | $1,129.39 | $3,388 |
| 39 | Alaska | $92.22 | $1,106.67 | $3,320 |
| 40 | Oregon | $91.88 | $1,102.55 | $3,308 |
| 41 | Maine | $81.66 | $979.90 | $2,940 |
| 42 | Vermont | $80.13 | $961.60 | $2,885 |
| 43 | Nevada | $79.51 | $954.15 | $2,862 |
| 44 | Wyoming | $65.88 | $790.50 | $2,372 |
| 45 | Idaho | $55.99 | $671.82 | $2,015 |
| 46 | New Hampshire | $49.31 | $591.70 | $1,775 |
| 47 | North Carolina | $32.37 | $388.39 | $1,165 |
| 48 | California | $0.00 | $0.00 | $0 |
| 48 | Massachusetts | $0.00 | $0.00 | $0 |
| 48 | Michigan | $0.00 | $0.00 | $0 |
| 48 | Hawaii | $0.00 | $0.00 | $0 |
California, Massachusetts, Hawaii and Michigan show no premium difference
Poor credit doesn’t increase auto insurance premiums in California, Massachusetts, Hawaii or Michigan in this analysis. That’s because each of these states restricts or prohibits insurers from using credit information when setting rates. Most other states allow insurers to use credit-based insurance scores in some way, and lawmakers continue to debate whether those rules should change.
Even in states where insurers can’t use credit information, drivers can still pay very different premiums. Other rating factors simply play a bigger role in determining what drivers pay.
The impact of poor credit varies significantly by age
Depending on where you live, poor credit can affect drivers of every age differently. In Illinois, 80-year-old drivers see the largest percentage increase, with average full coverage premiums climbing 87.0%, from $2,625 to $4,910. Twenty-year-olds, however, see the biggest dollar increase, paying an average of $3,514 more per year with poor credit.
The results make sense when you consider how insurers price policies. Younger drivers already pay some of the highest premiums because they have less driving experience, so poor credit can make an already expensive policy even harder to afford. Older drivers typically start with lower premiums, making the effect of poor credit appear larger on a percentage basis.
Change in annual auto insurance premiums by age for drivers with poor credit
| Age | Avg. premium, good credit | Avg. premium, poor credit | % increase | $ difference |
|---|---|---|---|---|
| 20 | $4,112 | $7,626 | 85.5% | $3,514 |
| 30 | $2,115 | $3,703 | 75.1% | $1,588 |
| 40 | $1,976 | $3,544 | 79.4% | $1,568 |
| 50 | $1,864 | $3,302 | 77.1% | $1,438 |
| 60 | $1,791 | $3,304 | 84.5% | $1,513 |
| 70 | $2,024 | $3,598 | 77.8% | $1,574 |
| 80 | $2,625 | $4,910 | 87.0% | $2,285 |
Note that this age analysis focuses on Illinois because it has a large, competitive auto insurance market where insurers can use credit-based insurance scores. That makes it easier to compare how poor credit affects drivers at different ages, although individual results can vary by state. Insurers also weigh age and credit differently, so the impact can differ from one company to the next.
What’s true across the board, though, is that strong credit can help you at every stage of life.
Whether you’re just starting to build credit history or looking for ways to lower insurance costs later in life, maintaining good credit can pay off.
“Unfortunately, insurance rates are already high for 20-year-olds, but establishing good credit while you’re young can help you get and keep low rates as you age, assuming you also avoid tickets and accidents,” Bhatt says. “Older drivers can absolutely benefit from the knowledge that cheaper car insurance is one more reason to maintain good credit.”
5 ways drivers with poor credit can lower auto insurance costs
Poor credit doesn’t mean you have to be stuck paying higher car insurance premiums forever. Here are five ways to lower your costs over time.
1. Ask about discounts that don’t depend on your credit
Many insurers offer discounts for bundling policies, insuring multiple vehicles, paying your premium in full, enrolling in automatic payments or going paperless. Qualifying for additional discounts may help offset some of the higher costs that come with poor credit.
2. Raise your deductible if it makes financial sense
Choosing a higher deductible can lower your premium. But before you do, make sure you can comfortably afford the out-of-pocket cost after an accident.
“It’s just as important to keep money in an emergency account to cover your deductible in the event of an accident,” Bhatt says. “If you’re in an accident, taking on credit card debt to cover your deductible may harm your credit score.”
3. Consider usage-based insurance if you’re a safe driver
Many insurers offer telematics programs that reward safe driving habits with lower premiums. These programs aren’t right for everyone, so make sure you understand how they work before enrolling.
“Usage-based insurance is a good way to save money on car insurance if you’re a safe driver,” Bhatt says. “Just be sure to read the fine print. Some companies raise your rate if their system detects unsafe driving, unless you drop out of the program in time.”
4. Improve your credit over time
Building better credit can help lower your insurance premiums while also making it easier to qualify for better rates on loans and credit cards. Paying your bills on time and reducing credit card balances are often two of the most effective ways to strengthen your credit.
5. Shop rates with multiple insurers every year
Comparing quotes on a regular basis is one of the best ways to save on car insurance, especially after you improve your credit. Because every insurer uses its own pricing model, rates can vary significantly from one company to the next.
Methodology
LendingTree analyzed Quadrant Information Services’ auto insurance rate data to compare average quoted full coverage premiums for drivers with good and poor credit. The quotes were pulled on June 24, 2026. Quadrant doesn’t disclose the credit score ranges it uses for its good and poor credit categories. It also tracks the following credit categories: excellent, very good, average, fair to below fair, below fair, below fair to poor and worst.
The state analysis is based on a 30-year-old male driver with a clean driving record and a 2018 Honda CR-V EX. Percentage increases reflect the difference in premiums between drivers with good and poor credit. Dollar increases are shown monthly, annually and over three years.
The age analysis compares average annual full coverage premiums by age for drivers with good and poor credit in Illinois. It uses the same clean-record driver profile and vehicle.