Used-Car Markups by State, Age, Model and More


Shoppers financing a used car are largely paying more than the vehicle is worth on the wholesale market, according to this LendingTree analysis of used-car purchase inquiries.
Nationally, buyers are seeking auto loans for vehicles priced at a median of $1,350 (6.8%) above wholesale value. And for certain states, vehicle ages, makes and models, that premium climbs even higher.
- Used-car shoppers are seeking loans for vehicles priced a median of $1,350 (6.8%) above wholesale value nationwide. More than one-third (36.8%) of inquiries are for vehicles with estimated prices at least 20% above wholesale, while nearly 1 in 5 (19.7%) are at least 50% above wholesale.
- Rhode Island has the biggest dollar gap between estimated purchase prices and wholesale values. The state’s median estimated vehicle price is $2,712 above wholesale — the highest in the nation — and 43.0% of inquiries are for vehicles priced at least 20% above wholesale.
- Older used vehicles tend to have the biggest premiums over wholesale. Vehicles 11 years and older are priced a median of $3,484 above wholesale, compared with $1,667 for vehicles 3 to 5 years old. By contrast, 1-to-2-year-old vehicles are priced a median of $3,266 below wholesale.
- Luxury and performance vehicles stand out for the largest markups over wholesale. Among the 25 most common makes, Porsche has the biggest median gap at $9,078 above wholesale and the highest share of inquiries priced at least 20% above wholesale (58.0%). Among the 50 most common make-model combinations, the Chevrolet Corvette has the largest median gap ($9,375 above wholesale), while the Chevrolet Impala has the highest share of inquiries priced at least 20% above wholesale (57.8%).
Used-car buyers nationwide are paying a premium over wholesale
Across the country, the median used-car loan inquiry reflects a price that’s $1,350 (6.8%) above the vehicle’s current wholesale value. More than a third of inquiries — 36.8% — are for vehicles priced at least 20% above wholesale. And 1 in 5 (19.7%) are at least a whopping 50% above it.
Matt Schulz, LendingTree chief consumer finance analyst and author of “Ask Questions, Save Money, Make More: How to Take Control of Your Financial Life,” says those types of markups suggest a real seller’s market for used vehicles.
“There’s almost always going to be some markup because sellers may have additional costs of their own to cover, but buyers should pay attention when that gap gets especially wide,” he says. “Paying too much can leave you with less equity and less financial breathing room if you need to sell or trade the car sooner than expected.”
Rhode Island buyers face the steepest markups
By state, Northeast shoppers tend to face the biggest premiums. In particular, Rhode Island has the largest gap between what shoppers are financing and what used vehicles are worth. Here, the typical estimated purchase price sits $2,712 above wholesale value. Additionally, 43.0% of inquiries are for vehicles priced at least 20% above wholesale.
Alaska follows, with shoppers there seeking loans for cars $2,522 above wholesale value. Meanwhile, 41.0% of inquiries are for vehicles priced 20% or more above wholesale. Connecticut rounds out the top three at $2,517. Here, 40.1% of inquiries are for cars priced 20% or more above wholesale.
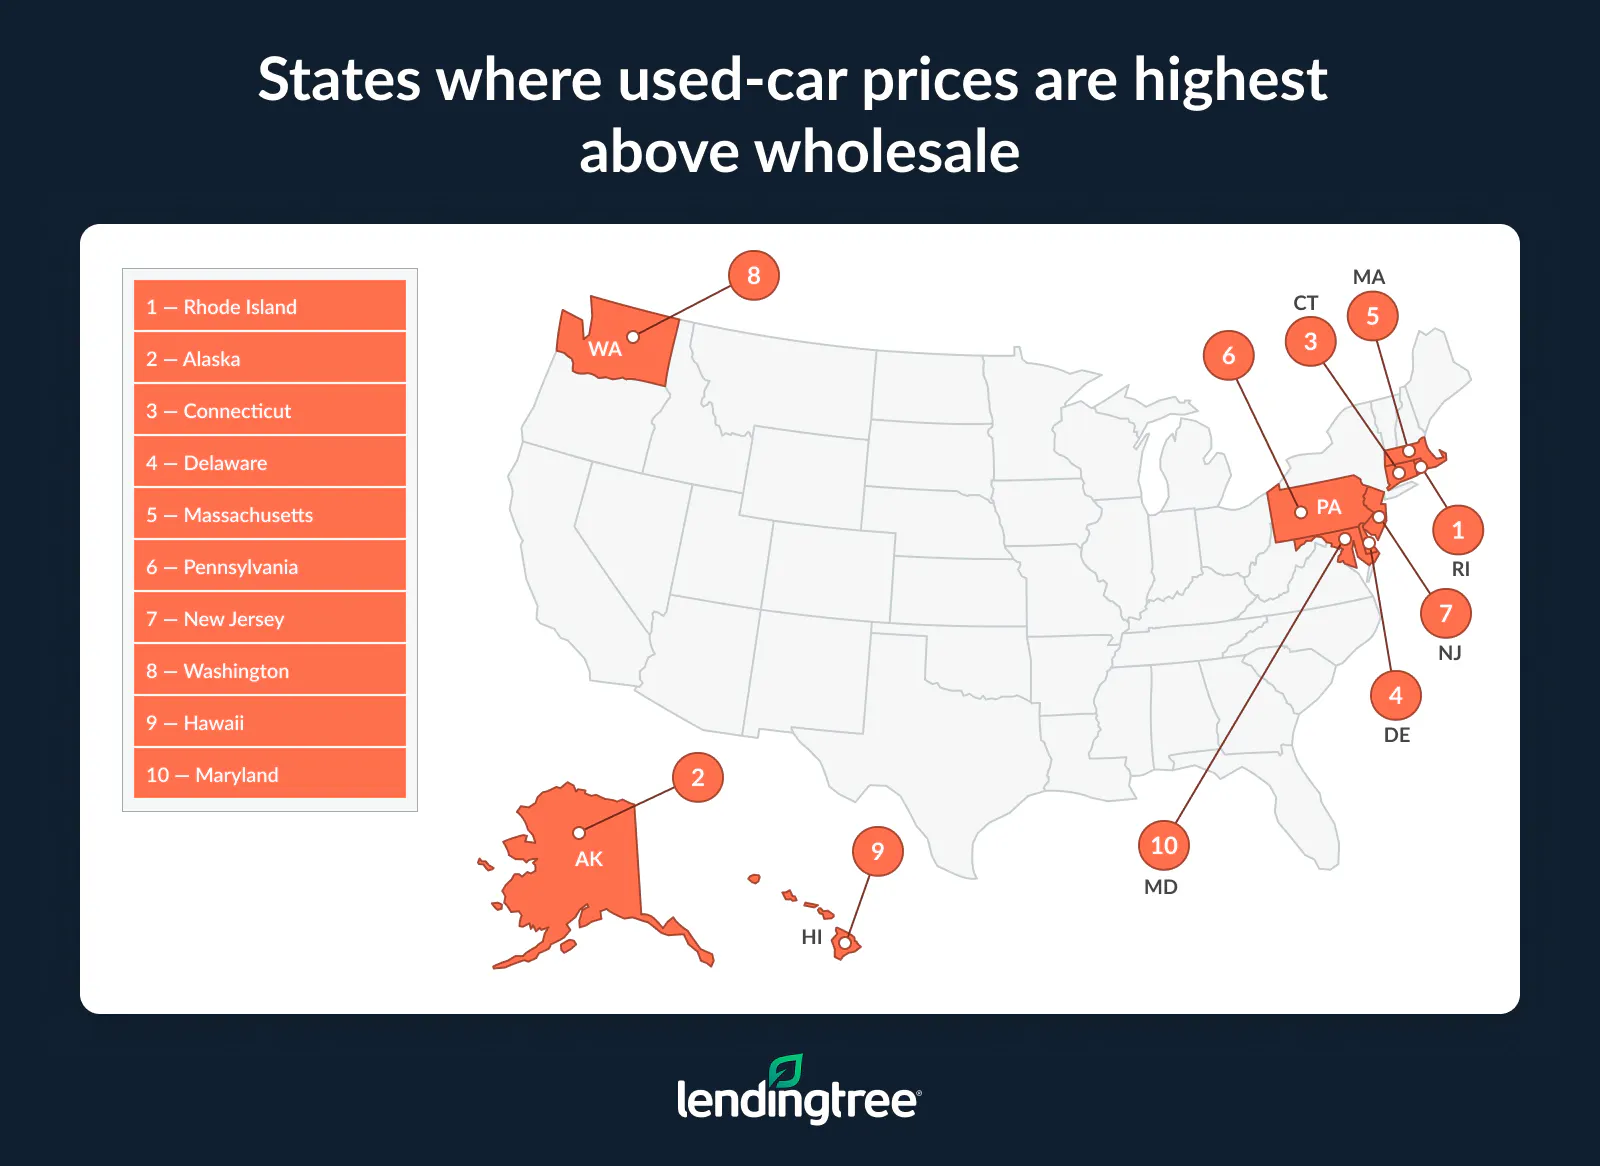
In total, five of the top 10 states are in the Northeast.
On the other end of the spectrum, seven of the 10 states with the smallest premium are in the South, leading with Louisiana ($143) and Mississippi ($283). Oklahoma ($342) joins the bottom three. Looking at the percentage of vehicles priced 20% or more above wholesale, Louisiana again ranks lowest at 33.6%.
Full rankings: States where used-car shoppers faced the steepest dollar premiums
| Rank | State | % 20%+ above wholesale | % 50%+ above wholesale | Median price above wholesale ($) | Median price above wholesale (%) |
|---|---|---|---|---|---|
| 1 | Rhode Island | 43.0% | 22.7% | $2,712 | 13.0% |
| 2 | Alaska | 41.0% | 23.8% | $2,522 | 11.6% |
| 3 | Connecticut | 40.1% | 18.1% | $2,517 | 12.0% |
| 4 | Delaware | 36.3% | 19.7% | $2,364 | 9.5% |
| 5 | Massachusetts | 38.4% | 18.4% | $2,198 | 10.3% |
| 6 | Pennsylvania | 40.6% | 22.1% | $2,130 | 10.8% |
| 7 | New Jersey | 36.0% | 16.3% | $2,099 | 8.5% |
| 8 | Washington | 41.8% | 22.6% | $2,016 | 11.0% |
| 9 | Hawaii | 36.8% | 19.6% | $2,007 | 9.0% |
| 10 | Maryland | 37.1% | 18.4% | $1,943 | 8.8% |
| 11 | Illinois | 39.4% | 21.0% | $1,930 | 9.7% |
| 12 | California | 38.7% | 20.1% | $1,910 | 9.2% |
| 13 | New York | 36.6% | 17.9% | $1,850 | 8.8% |
| 14 | Nevada | 39.9% | 21.1% | $1,849 | 9.5% |
| 15 | District of Columbia | 36.7% | 20.6% | $1,780 | 7.7% |
| 16 | Montana | 40.9% | 24.6% | $1,750 | 8.8% |
| 17 | Indiana | 39.2% | 21.8% | $1,558 | 8.7% |
| 18 | New Hampshire | 36.3% | 17.9% | $1,543 | 7.6% |
| 19 | Colorado | 37.2% | 21.3% | $1,533 | 7.2% |
| 20 | Virginia | 38.5% | 21.3% | $1,519 | 8.5% |
| 21 | Arizona | 36.7% | 20.0% | $1,440 | 7.0% |
| 22 | Ohio | 37.3% | 19.5% | $1,420 | 7.4% |
| 23 | Utah | 38.8% | 21.6% | $1,403 | 8.4% |
| 24 | Wisconsin | 37.5% | 20.1% | $1,383 | 7.2% |
| 25 | Oregon | 38.5% | 22.6% | $1,368 | 7.2% |
| 26 | Maine | 39.1% | 20.3% | $1,358 | 8.2% |
| 27 | Idaho | 38.3% | 21.9% | $1,354 | 7.3% |
| 28 | Minnesota | 38.1% | 20.8% | $1,282 | 6.5% |
| 29 | Georgia | 36.1% | 19.3% | $1,279 | 6.0% |
| 30 | West Virginia | 38.4% | 21.8% | $1,254 | 6.5% |
| 31 | Kansas | 37.7% | 22.3% | $1,230 | 7.3% |
| 32 | Michigan | 36.8% | 20.0% | $1,217 | 6.5% |
| 32 | Florida | 34.3% | 17.5% | $1,217 | 5.7% |
| 34 | New Mexico | 38.2% | 21.6% | $1,190 | 5.8% |
| 35 | North Carolina | 36.1% | 19.4% | $1,142 | 5.8% |
| 36 | Iowa | 38.2% | 21.5% | $1,090 | 6.7% |
| 37 | South Dakota | 38.5% | 22.4% | $1,075 | 5.8% |
| 38 | Texas | 34.2% | 17.7% | $1,031 | 4.7% |
| 39 | Missouri | 37.8% | 21.4% | $930 | 5.1% |
| 40 | Wyoming | 38.3% | 22.5% | $912 | 4.8% |
| 41 | Tennessee | 36.0% | 20.3% | $866 | 4.6% |
| 42 | Nebraska | 36.3% | 21.2% | $785 | 4.9% |
| 43 | Kentucky | 36.0% | 21.2% | $660 | 3.9% |
| 44 | North Dakota | 36.3% | 19.3% | $600 | 2.5% |
| 45 | South Carolina | 34.2% | 19.0% | $540 | 2.6% |
| 46 | Arkansas | 34.8% | 19.8% | $502 | 2.7% |
| 47 | Vermont | 35.6% | 17.7% | $467 | 2.5% |
| 48 | Alabama | 34.1% | 19.0% | $392 | 1.9% |
| 49 | Oklahoma | 34.5% | 20.1% | $342 | 1.9% |
| 50 | Mississippi | 35.0% | 19.1% | $283 | 1.6% |
| 51 | Louisiana | 33.6% | 18.3% | $143 | 0.7% |
The older the car, the bigger the markup
Vehicle age plays a major role in how much buyers pay above wholesale. Cars 11 years and older carry a median premium of $3,484 above wholesale — more than double the $1,667 seen on vehicles that are 3 to 5 years old. The pattern flips entirely for newer vehicles, with those that are 1 to 2 years old priced a median of $3,266 below wholesale.
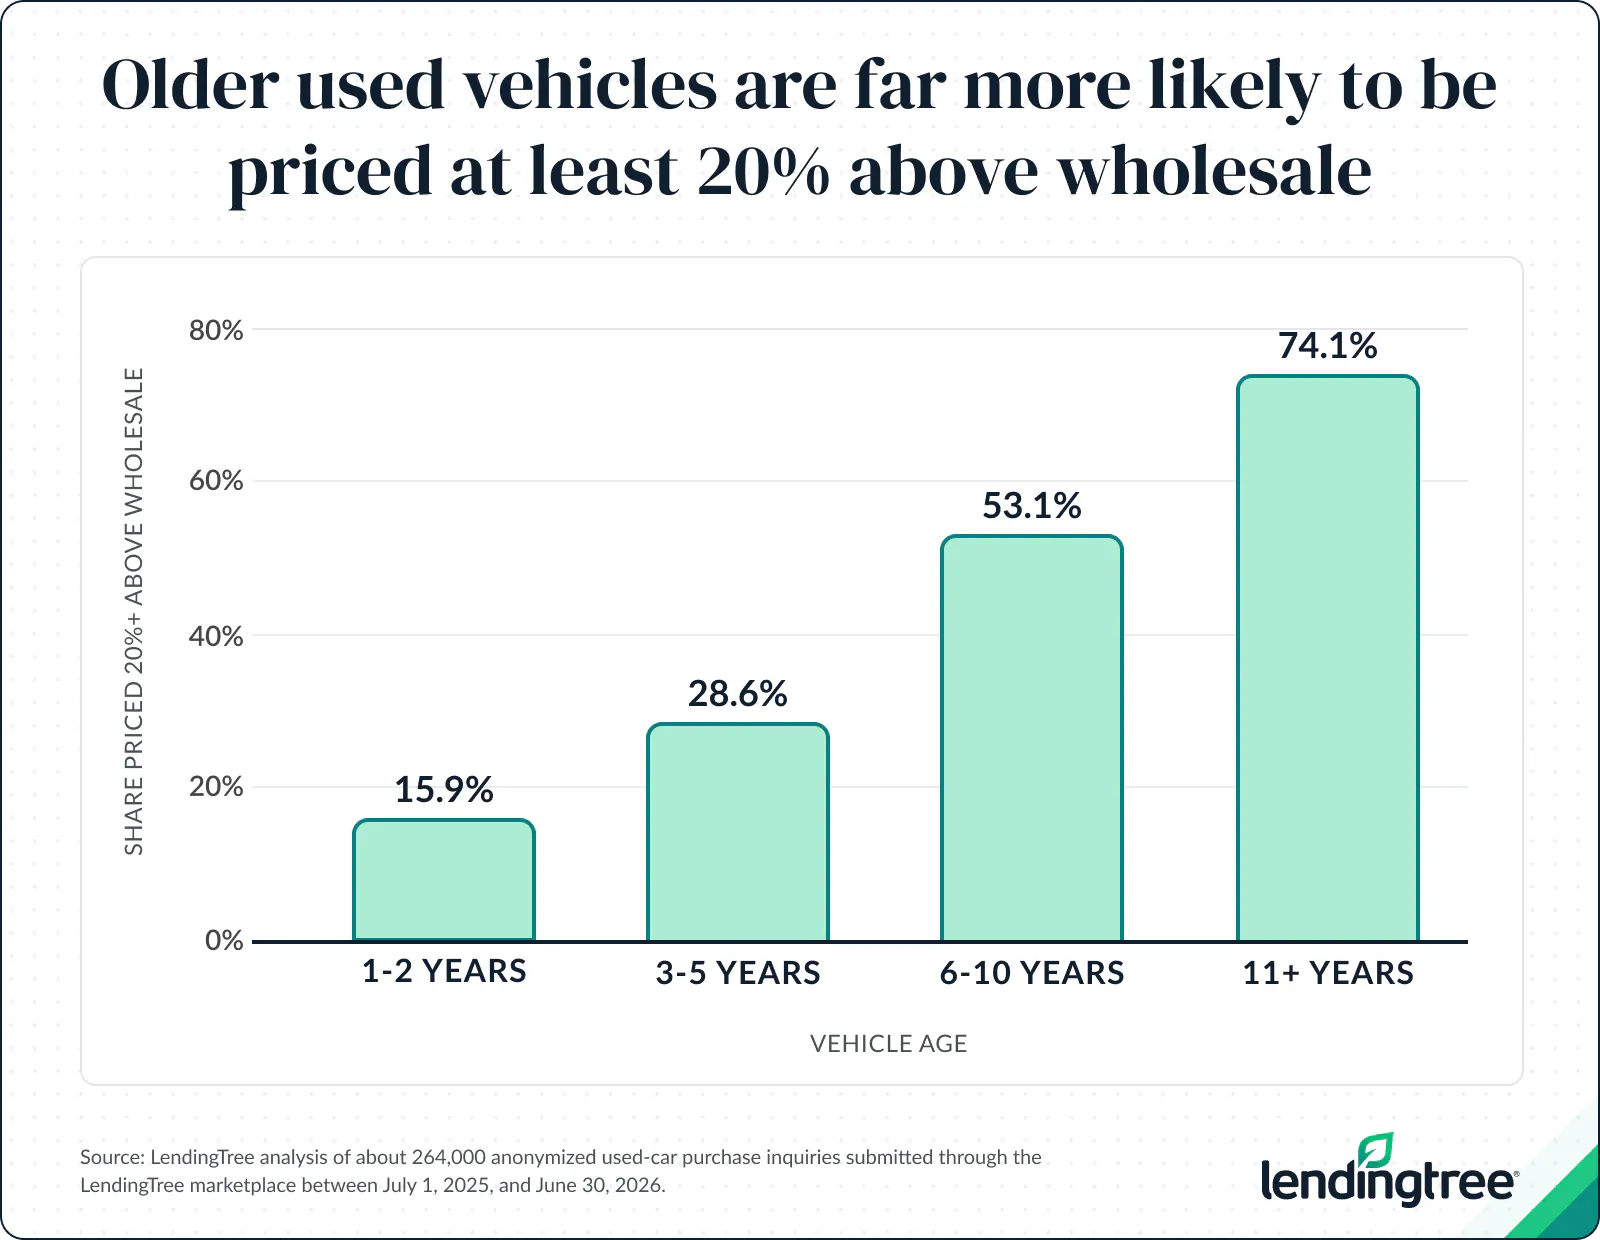
Schulz believes there are a few reasons for this. “Part of it is likely that it can cost more to get an older vehicle in suitable shape to be sold,” he says. “Because those vehicles tend to have lower wholesale values, the cost of getting that vehicle into sellable shape may represent a much larger percentage of the car’s value. That doesn’t mean that an older car is necessarily a bad deal, though. Just make sure you understand what has been done to that vehicle before you make an offer.”
Used-car price premiums by vehicle age
| Vehicle age | % 20%+ above wholesale | % 50%+ above wholesale | Median price above wholesale ($) | Median price above wholesale (%) |
|---|---|---|---|---|
| 1-2 years | 15.9% | 4.2% | -$3,266 | -10.4% |
| 3-5 years | 28.6% | 7.7% | $1,667 | 6.3% |
| 6-10 years | 53.1% | 30.0% | $3,290 | 23.6% |
| 11+ years | 74.1% | 57.8% | $3,484 | 64.5% |
Higher-mileage vehicles also have larger dollar differences compared to wholesale. Vehicles with at least 100,000 miles are a median of $3,550 above wholesale, compared with $2,696 for vehicles with 60,000 to 99,999 miles and $1,649 for vehicles with 30,000 to 59,999 miles. Vehicles with 1,000 to 29,999 miles are $3,262 below wholesale.
Used-car price premiums by vehicle mileage
| Mileage | % 20%+ above wholesale | % 50%+ above wholesale | Median price above wholesale ($) | Median price above wholesale (%) |
|---|---|---|---|---|
| 1,000 to 29,999 miles | 15.9% | 4.2% | -$3,262 | -10.4% |
| 30,000 to 59,999 miles | 26.1% | 5.6% | $1,649 | 5.9% |
| 60,000 to 99,999 miles | 44.8% | 21.1% | $2,696 | 15.1% |
| 100,000+ miles | 69.1% | 50.8% | $3,550 | 51.3% |
Luxury and performance cars command the highest premiums
High-end and performance used vehicles see the steepest markups of any category. Among the 25 most popular brands, Porsche buyers pay the largest premium, financing used vehicles that are a median of $9,078 above wholesale. Porsche also has the highest share of inquiries priced at least 20% above wholesale (58.0%) and the second-oldest median vehicle age (six years).
Mercedes-Benz follows at $3,746, and Audi is third at $3,361.
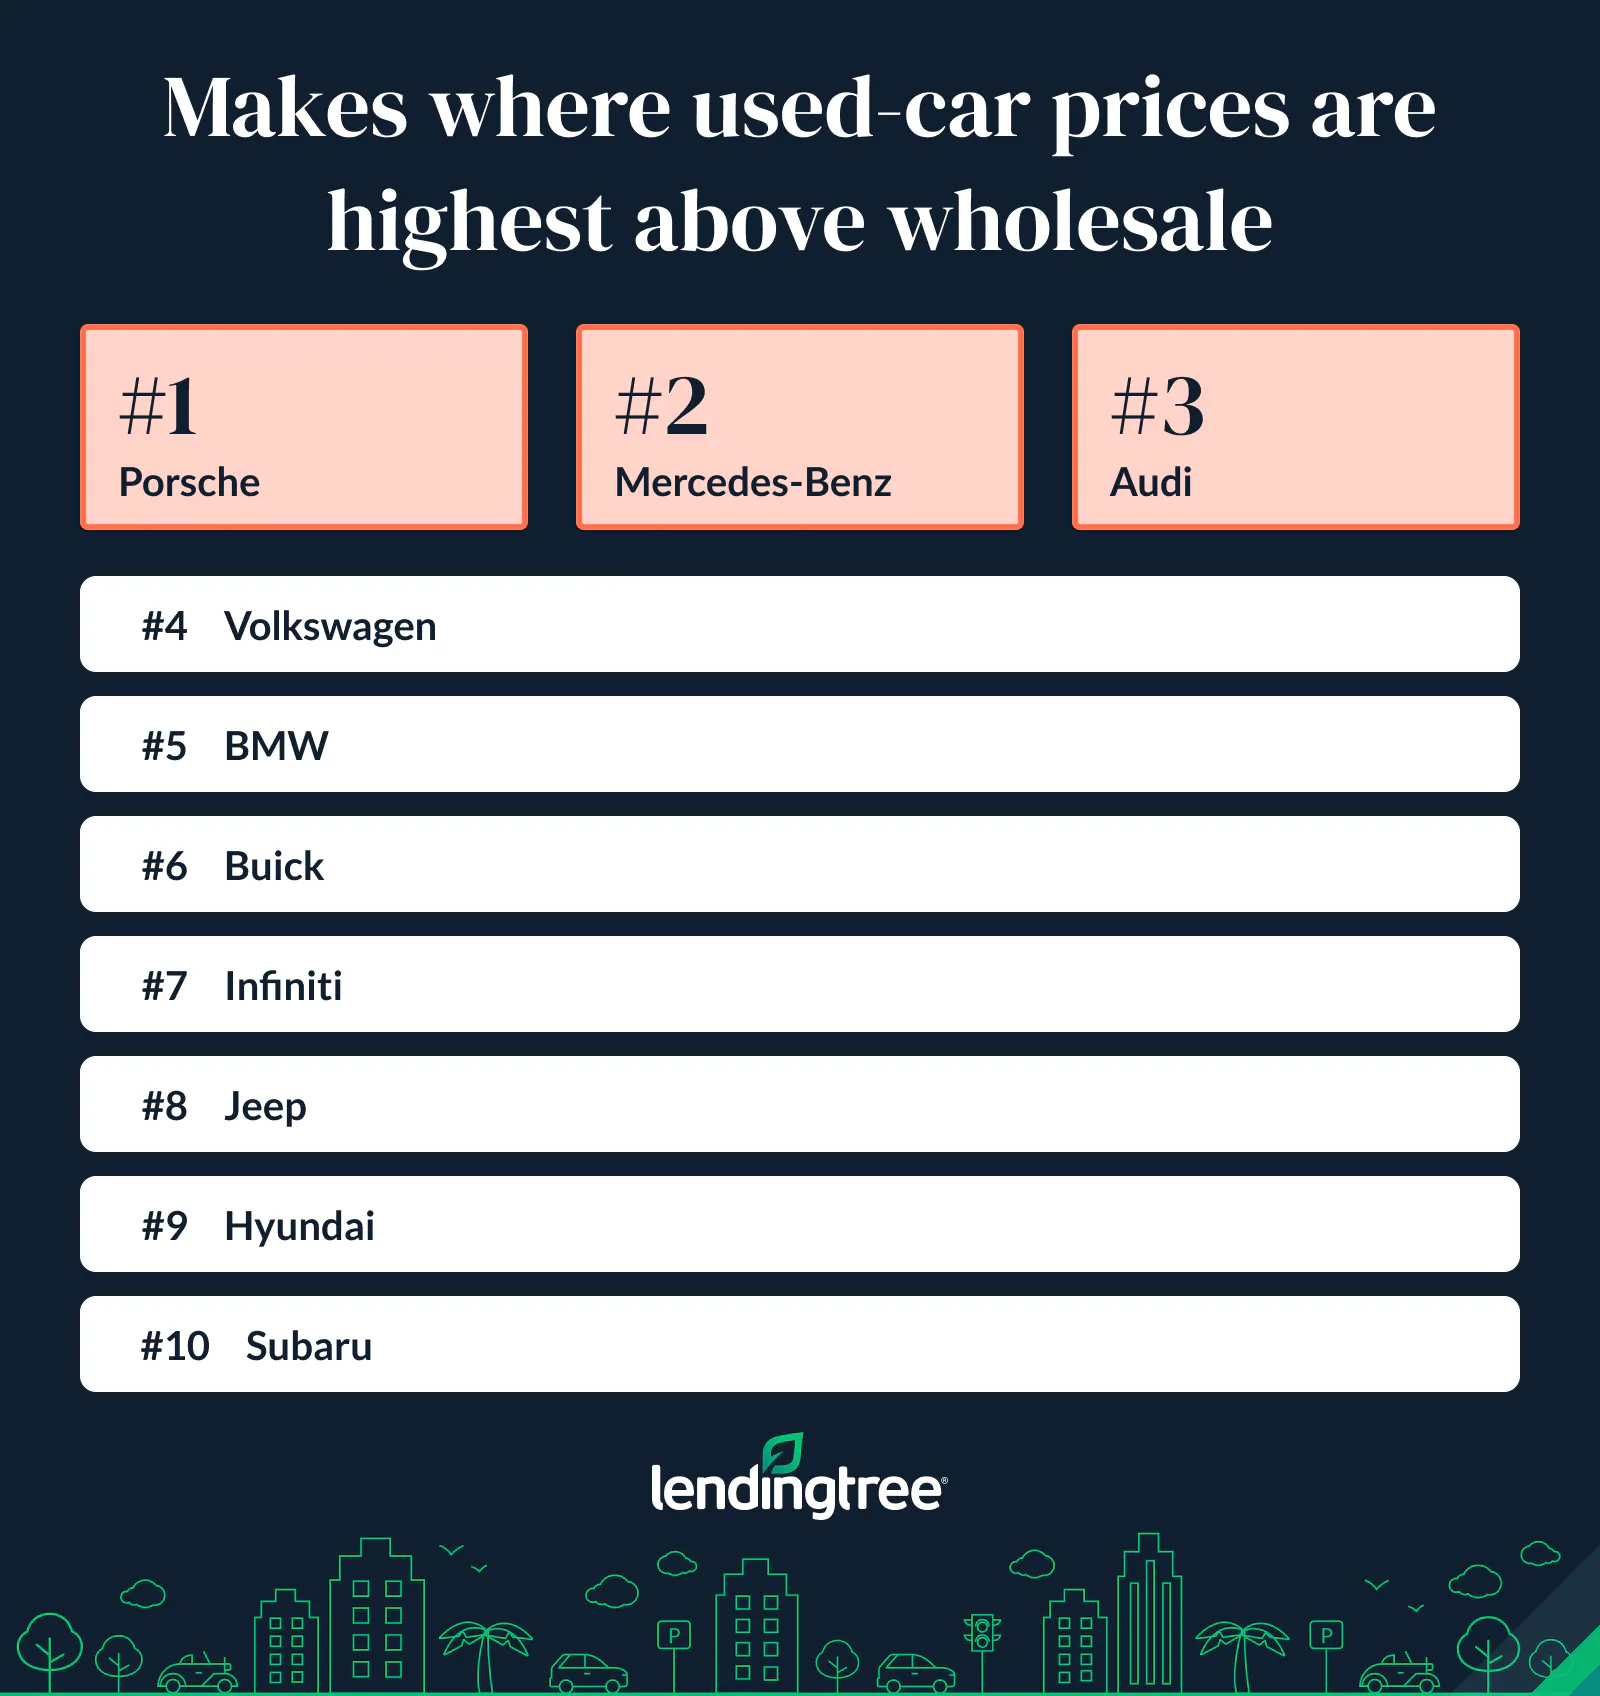
On the other hand, GMC and Ram are the only used brands financed below wholesale prices, at a median of $550 and $244 below wholesale, respectively. Honda comes in a close third, at a median of just $45 above wholesale.
That pattern among high-end and performance vehicles holds at the model level, too. Among the 50 most common make-model pairings, used Chevrolet Corvettes carry the biggest dollar premium, at $9,375 above wholesale. The Chevrolet Camaro ($3,647) and the Dodge Challenger ($3,010) follow.
Meanwhile, the Chevrolet Impala has the highest share of inquiries priced at least 20% above wholesale, at 57.8%, and the highest median vehicle age, at 9 years old.
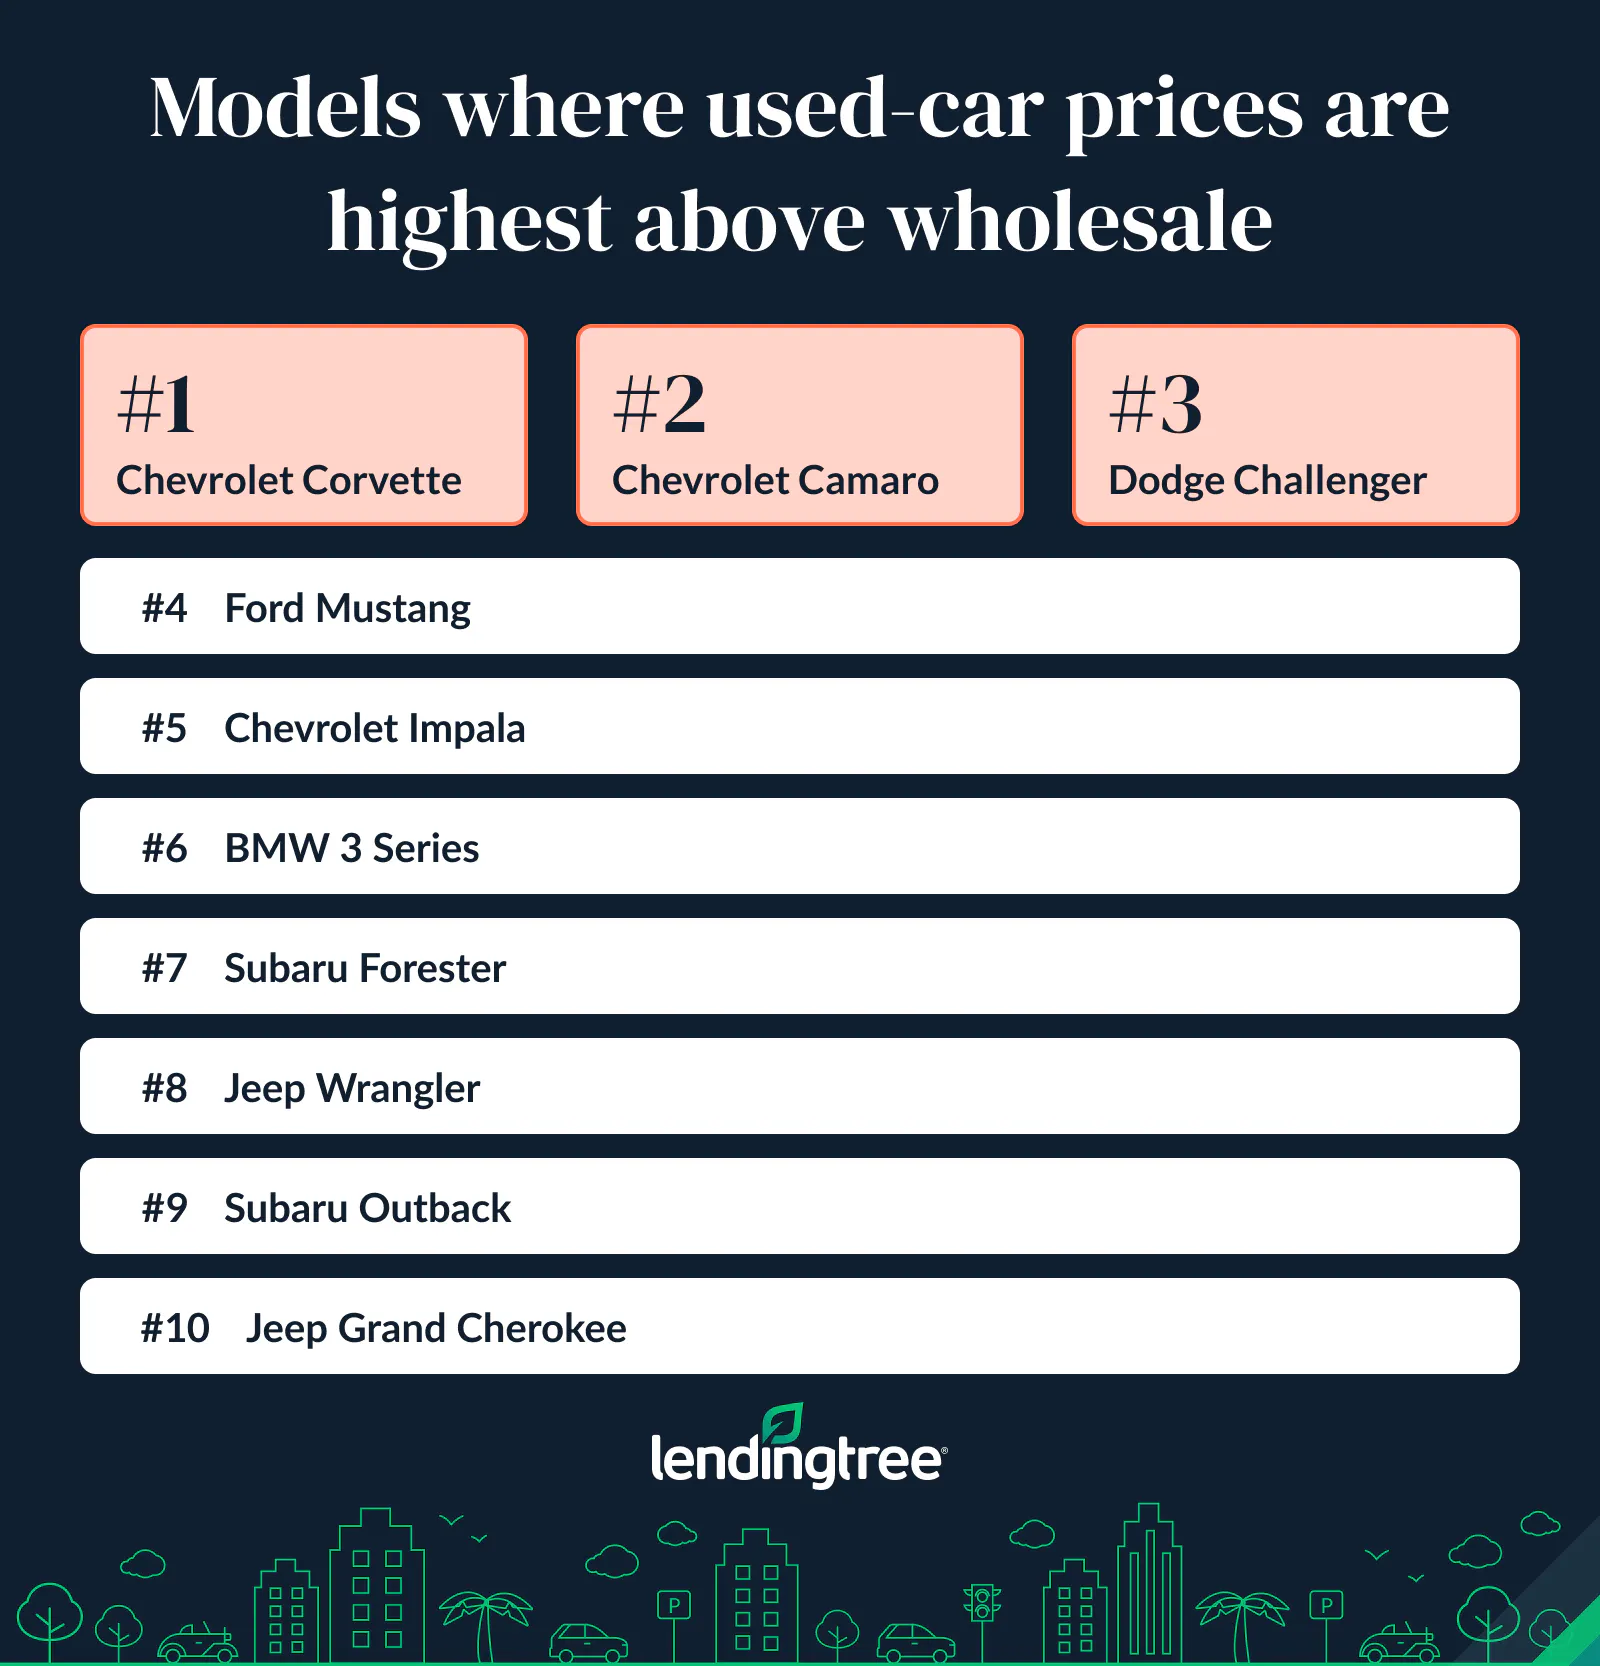
In total, 24 used make-model combinations are financed below wholesale value, led by the Chevrolet Silverado 2500HD ($6,300), the Ford Super Duty F-250 SRW ($6,030) and the GMC Sierra 2500HD ($5,800).
Schulz believes these gaps are because wholesale values don’t always capture everything that drives demand for luxury and performance cars.
“A desirable trim, limited supply, rare options, low mileage or a spotless history can make one vehicle far more attractive than another very similar vehicle,” he says. “People who are super passionate about specific cars may also be willing to pay extra for the model they want. That can be especially true with vehicles such as Porsches and Corvettes. People love those types of cars and are sometimes willing to go overboard with their spending to get one.”
Full rankings: Used-car price premiums by vehicle make
| Rank | Make | % 20%+ above wholesale | % 50%+ above wholesale | Median price above wholesale ($) | Median vehicle age |
|---|---|---|---|---|---|
| 1 | Porsche | 58.0% | 36.1% | $9,078 | 6 years |
| 2 | Mercedes-Benz | 46.4% | 24.9% | $3,746 | 5 years |
| 3 | Audi | 45.2% | 23.5% | $3,361 | 4 years |
| 4 | Volkswagen | 47.5% | 24.6% | $2,750 | 4 years |
| 5 | BMW | 38.9% | 20.7% | $2,697 | 3 years |
| 6 | Buick | 48.0% | 29.8% | $2,560 | 5 years |
| 7 | Infiniti | 45.4% | 27.1% | $2,464 | 6 years |
| 8 | Jeep | 42.5% | 21.2% | $2,450 | 4 years |
| 9 | Hyundai | 42.5% | 20.0% | $2,320 | 2 years |
| 10 | Subaru | 42.0% | 20.5% | $2,302 | 5 years |
| 11 | Chrysler | 48.7% | 27.8% | $2,292 | 7 years |
| 12 | Mazda | 37.8% | 16.3% | $2,110 | 3 years |
| 13 | Cadillac | 39.0% | 22.5% | $1,959 | 5 years |
| 14 | Dodge | 43.5% | 25.7% | $1,850 | 6 years |
| 15 | Tesla | 25.6% | 6.5% | $1,710 | 3 years |
| 16 | Lexus | 34.1% | 15.9% | $1,698 | 5 years |
| 17 | Kia | 35.7% | 18.1% | $1,668 | 2 years |
| 18 | Nissan | 40.0% | 23.9% | $1,310 | 3 years |
| 19 | Acura | 29.2% | 13.7% | $880 | 3 years |
| 20 | Ford | 35.8% | 20.6% | $755 | 5 years |
| 21 | Chevrolet | 37.0% | 22.2% | $567 | 5 years |
| 22 | Toyota | 28.4% | 13.3% | $93 | 4 years |
| 23 | Honda | 30.3% | 14.8% | $45 | 4 years |
| 24 | Ram | 24.3% | 9.2% | -$244 | 5 years |
| 25 | GMC | 25.8% | 12.7% | -$550 | 4 years |
Full rankings: Used-car price premiums by vehicle make-model
| Rank | Model | % 20%+ above wholesale | % 50%+ above wholesale | Median price above wholesale ($) | Median vehicle age |
|---|---|---|---|---|---|
| 1 | Chevrolet Corvette | 57.2% | 37.4% | $9,375 | 7 years |
| 2 | Chevrolet Camaro | 51.8% | 30.6% | $3,647 | 7 years |
| 3 | Dodge Challenger | 46.5% | 24.8% | $3,010 | 6 years |
| 4 | Ford Mustang | 46.9% | 27.0% | $2,827 | 6 years |
| 5 | Chevrolet Impala | 57.8% | 40.4% | $2,349 | 9 years |
| 6 | BMW 3 Series | 42.9% | 29.1% | $2,311 | 4 years |
| 7 | Subaru Forester | 41.4% | 20.6% | $2,285 | 5 years |
| 8 | Jeep Wrangler | 42.1% | 22.6% | $2,200 | 4 years |
| 9 | Subaru Outback | 39.0% | 18.4% | $2,080 | 4 years |
| 10 | Jeep Grand Cherokee | 41.8% | 21.7% | $2,016 | 6 years |
| 11 | Mazda CX-5 | 33.0% | 11.1% | $1,905 | 3 years |
| 12 | Chevrolet Equinox | 45.4% | 28.4% | $1,786 | 2 years |
| 13 | Ford Escape | 45.8% | 30.8% | $1,541 | 3 years |
| 14 | Tesla Model 3 | 25.7% | 5.1% | $1,494 | 3 years |
| 15 | Tesla Model Y | 17.4% | 2.1% | $1,318 | 3 years |
| 16 | Chevrolet Malibu | 42.5% | 28.5% | $1,200 | 2 years |
| 17 | Nissan Altima | 40.4% | 26.0% | $1,168 | 3 years |
| 18 | Chevrolet Traverse | 39.5% | 24.3% | $1,110 | 5 years |
| 19 | Nissan Rogue | 37.1% | 20.5% | $1,071 | 2 years |
| 20 | Dodge Charger | 37.2% | 20.4% | $1,062 | 6 years |
| 21 | Ford Edge | 41.1% | 25.5% | $1,053 | 4 years |
| 22 | Toyota Corolla | 38.0% | 20.5% | $1,026 | 4 years |
| 23 | Ram 1500 | 27.2% | 10.4% | $757 | 5 years |
| 24 | Toyota Camry | 30.4% | 13.3% | $161 | 4 years |
| 25 | Chevrolet Silverado 1500 | 31.9% | 16.7% | $67 | 5 years |
| 26 | Honda Pilot | 28.6% | 15.4% | $0 | 5 years |
| 27 | Ford Explorer | 30.1% | 15.0% | -$69 | 3 years |
| 28 | Toyota Tacoma 4WD | 21.5% | 6.1% | -$230 | 2 years |
| 29 | Dodge Durango | 32.9% | 16.3% | -$267 | 3 years |
| 30 | Ford F-150 | 30.5% | 16.0% | -$300 | 5 years |
| 31 | Toyota RAV4 | 23.7% | 8.8% | -$309 | 3 years |
| 32 | Honda Odyssey | 27.4% | 15.5% | -$370 | 4 years |
| 33 | GMC Sierra 1500 | 25.8% | 12.1% | -$379 | 4 years |
| 34 | Honda CR-V | 28.6% | 11.8% | -$445 | 4 years |
| 35 | Honda Civic sedan | 26.0% | 11.5% | -$665 | 3 years |
| 36 | Honda Accord sedan | 27.7% | 10.2% | -$821 | 3 years |
| 37 | Toyota Highlander | 20.5% | 8.2% | -$871 | 4 years |
| 38 | Honda Accord Hybrid | 25.1% | 6.6% | -$905 | 2 years |
| 39 | Toyota Tundra 4WD | 13.2% | 3.6% | -$911 | 2 years |
| 40 | Chevrolet Colorado | 28.5% | 12.9% | -$983 | 2 years |
| 41 | Chevrolet Blazer | 23.2% | 7.5% | -$1,273 | 2 years |
| 42 | Toyota 4Runner | 15.5% | 6.1% | -$2,314 | 4 years |
| 43 | Chevrolet Suburban | 22.6% | 13.1% | -$2,553 | 5 years |
| 44 | Ford Expedition | 22.5% | 10.7% | -$2,825 | 2 years |
| 45 | GMC Yukon | 18.6% | 7.7% | -$3,196 | 4 years |
| 46 | Ram 2500 | 16.3% | 5.7% | -$3,280 | 5 years |
| 47 | Chevrolet Tahoe | 21.7% | 11.9% | -$5,198 | 4 years |
| 48 | GMC Sierra 2500HD | 12.3% | 5.7% | -$5,800 | 3 years |
| 49 | Ford Super Duty F-250 SRW | 18.4% | 8.3% | -$6,030 | 5 years |
| 50 | Chevrolet Silverado 2500HD | 18.0% | 9.9% | -$6,300 | 4 years |
Expert tips on shopping smarter for the best deal
Buying a used car means working hard to get the best deal. By comparing financing, keeping an open mind about your options and being willing to walk away from a bad deal, you’ll put yourself in a stronger position to negotiate and save money. We offer the following tips:
- Shop around for both the car and the financing. “Get loan offers from multiple lenders before visiting the dealership,” Schulz says. “Unless you’re getting a special 0% APR or other special rate from the dealership, you’re likely to get a better rate elsewhere. And don’t be afraid to shop multiple sellers. The good news is it’s never been easier to shop in many places for loans and vehicles, so take advantage of it.”
- Be flexible in what you’re looking for. “Searching for a specific vehicle type can be like looking for a needle in a haystack, and it can limit your ability to negotiate,” he says. “More flexibility means more options. More options often means the ability to negotiate a better deal, so be sure to look at several model years, trims and competing vehicles.”
- Don’t be afraid to walk away. “Vehicle sellers expect you to negotiate, and their final offer often isn’t their final offer, especially if you’re willing to walk away,” he says. “You’d be surprised how often they suddenly find wiggle room as you’re walking out the door.”
Methodology
LendingTree researchers analyzed about 264,000 anonymized used-car purchase inquiries submitted through the LendingTree marketplace between July 1, 2025, and June 30, 2026. The analysis was limited to used passenger vehicles.
The estimated vehicle price was calculated as the requested loan amount plus the down payment. Researchers compared that price with each vehicle’s wholesale value to calculate the dollar difference from wholesale and the price-to-wholesale ratio. Inquiries were classified as 20% or more above wholesale when the estimated price was at least 1.20 times the wholesale value and 50% or more above wholesale when it was at least 1.50 times the wholesale value.
State results include the 50 states and the District of Columbia. Make results are limited to the 25 makes with the most inquiries, while model results are limited to the 50 make-model combinations with the most inquiries. Luxury brands were identified using Kelley Blue Book’s luxury-brand classifications.
Vehicle wholesale values represent the estimated wholesale value of each vehicle at the time of the inquiry, based on the submitted vehicle information. These values were used as the benchmark for all comparisons in this analysis.
Get auto loan offers from up to 5 lenders in minutes