Median Home Improvement Project Costs Have Risen 76% Since 2015


Homeownership has never been cheap, but keeping a house in good shape is getting noticeably pricier.
This LendingTree research finds that the typical home improvement project costs about three-quarters more than it did a decade ago, even after accounting for inflation. Add in rising routine maintenance costs — especially for older homes — and it’s clear that budgeting for home upkeep is just as important as budgeting for the mortgage itself.
Here’s what the data shows.
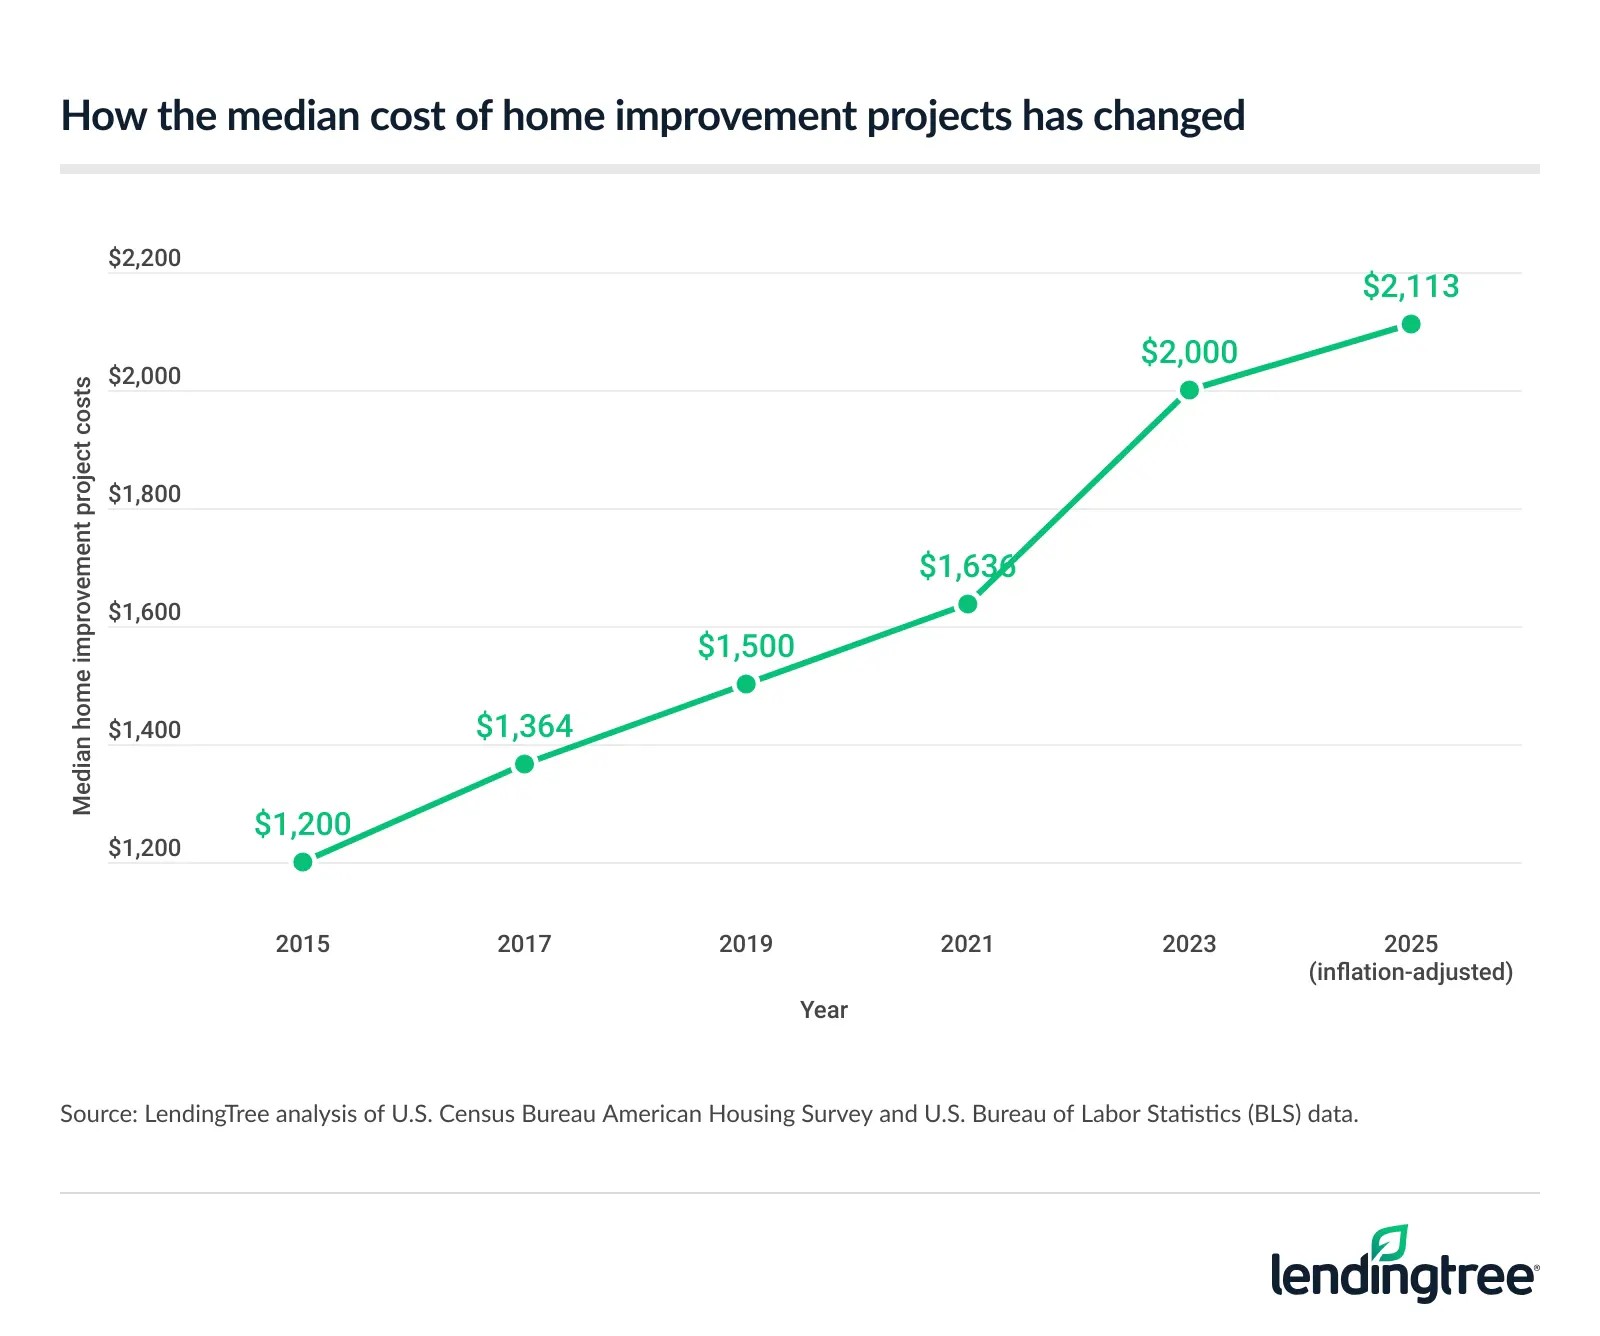
- Home improvement projects are becoming significantly more expensive. Between 2015 and 2025, the median cost of a home improvement project rose 76.1%, from $1,200 to an inflation-adjusted $2,113.
- Older homes cost more to maintain. Owner-occupied homes cost an estimated $1,433 annually in routine maintenance and upkeep. For homes built before 1940, that estimate rises to $1,706 a year.
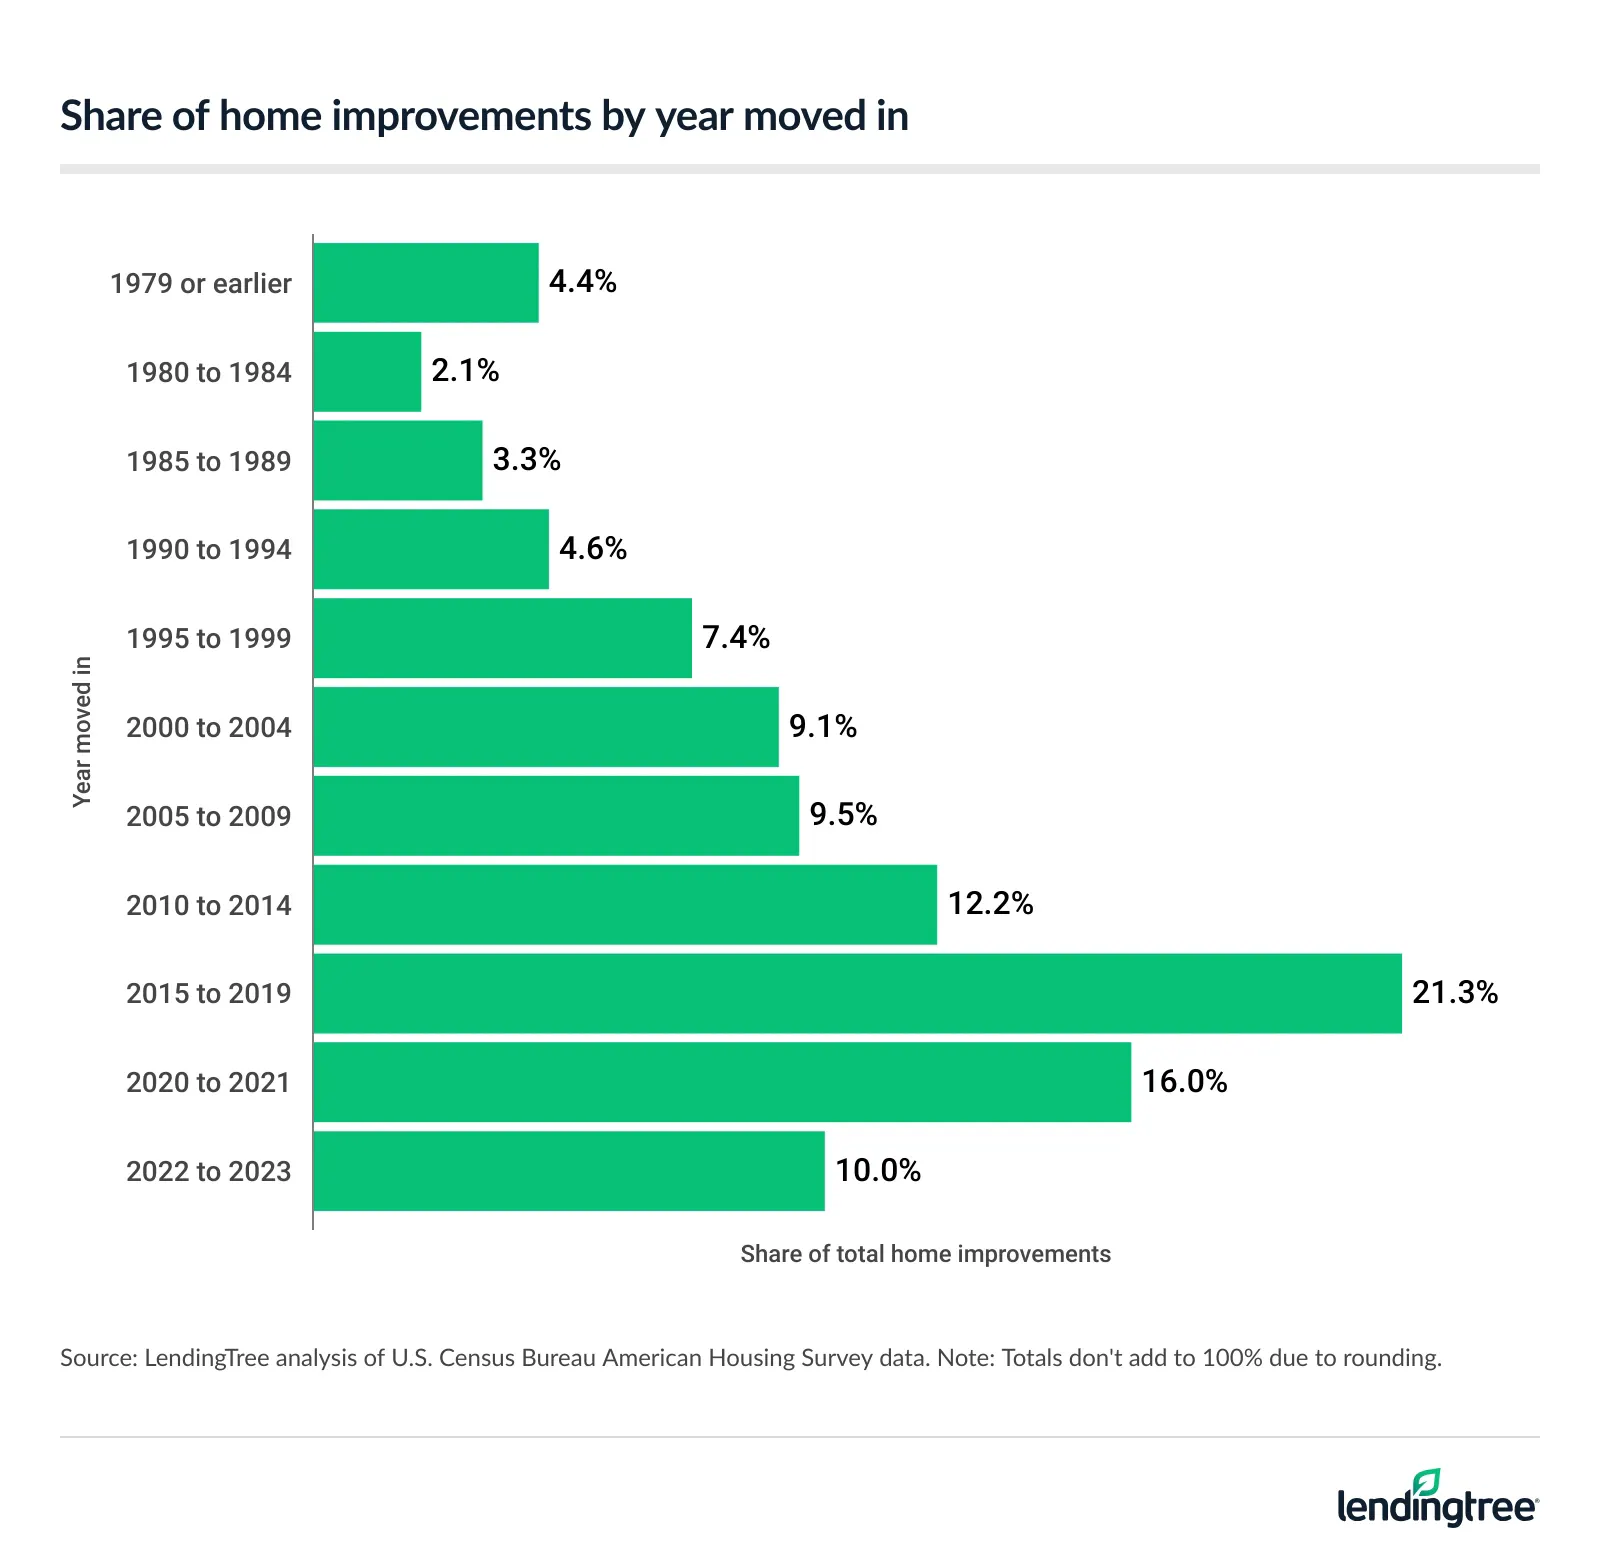
- Home improvements are widespread and largely recent. Nearly 6 in 10 owner-occupied homes — 51.6 million of 86.9 million — underwent improvements during the survey’s two-year lookback period. These homes accounted for about 139.9 million projects, or an average of 2.7 projects per improved home. Nearly half (47.3%) of the projects were completed by homeowners who moved in after 2014.
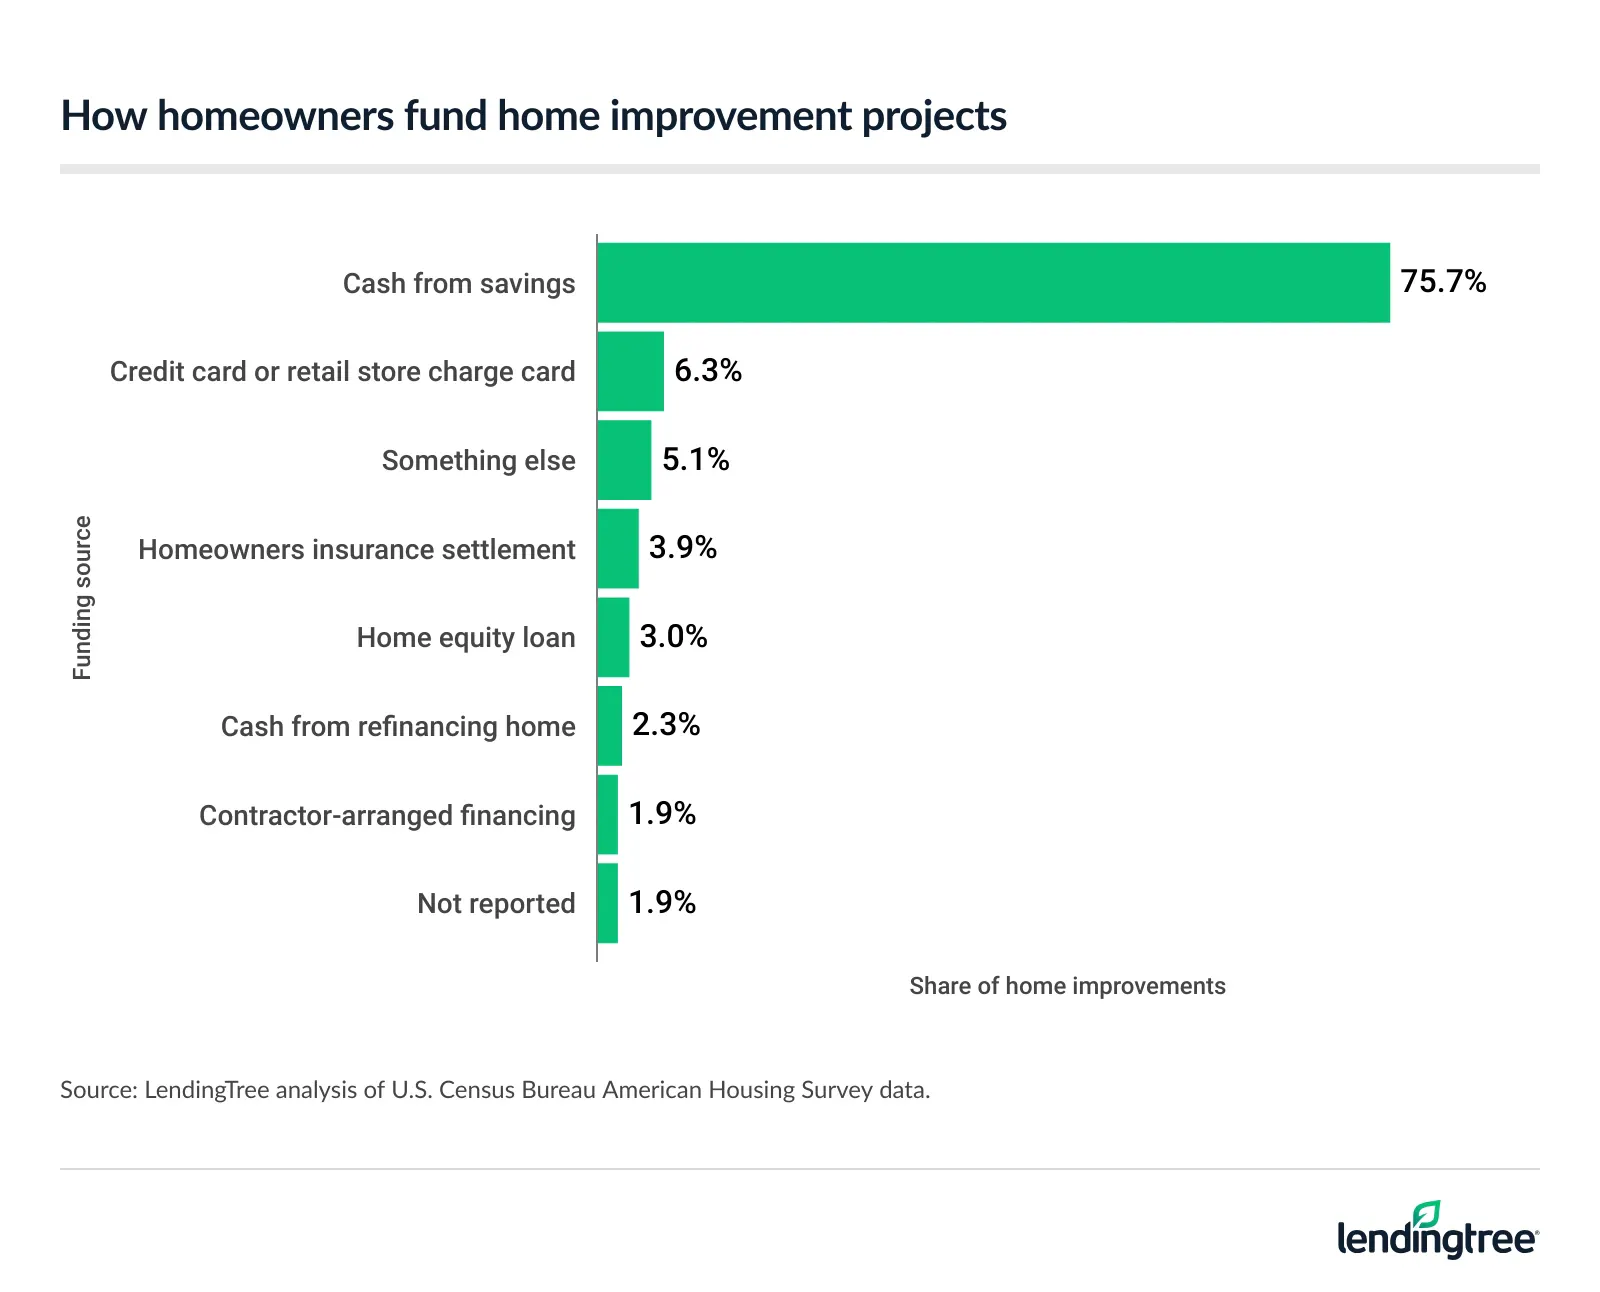
- Most homeowners use savings to fund improvements. Cash savings funded 75.7% of projects, compared with 6.3% funded by credit cards and 3.9% through homeowners insurance settlements. Cash was more commonly used for smaller projects: The median cash-funded project cost an estimated $1,902, compared with $7,924 for projects funded with home equity loans and $9,963 for projects funded through insurance settlements.
Home improvement costs have spiked in the past decade
Between 2015 and 2025, the median cost of a home improvement project climbed 76.1%, going from $1,200 to an inflation-adjusted $2,113. The biggest jump occurred between 2021 and 2023, when costs rose 22.2%.
Matt Schulz, LendingTree chief consumer finance analyst and author of “Ask Questions, Save Money, Make More: How to Take Control of Your Financial Life,” says that’s quite a jump.
“Rising costs of labor and building supplies are playing a role,” he says. “However, it could also be that homeowners are taking on larger and more complicated projects. Many Americans are unwilling to move because of today’s high mortgage rates, so they’re instead choosing to spend on sprucing up their current home.”
One way homeowners are managing costs is by doing the work themselves. The median professional-led project cost homeowners an estimated $4,103, compared with $845 for DIY. Still, most people opt to hire out the work, with 64.1% of projects in the analysis completed by a professional. And to be fair, cost isn’t always the main factor when deciding whether to tackle some home projects alone. The priciest jobs, like roof replacements, tend to require professional expertise, which skews the median cost of pro-led work.
Cost of projects: Professional vs. DIY
| Project type | Project share | Estimated median ($) |
|---|---|---|
| Total | – | $2,113 |
| Professional | 64.1% | $4,103 |
| Do-it-yourself (DIY) | 35.9% | $845 |
Older homes demand a bigger maintenance budget
Age matters when it comes to upkeep costs. Routine maintenance on owner-occupied homes runs an estimated $1,433 a year on average, but that figure rises to $1,706 annually for homes built before 1940.
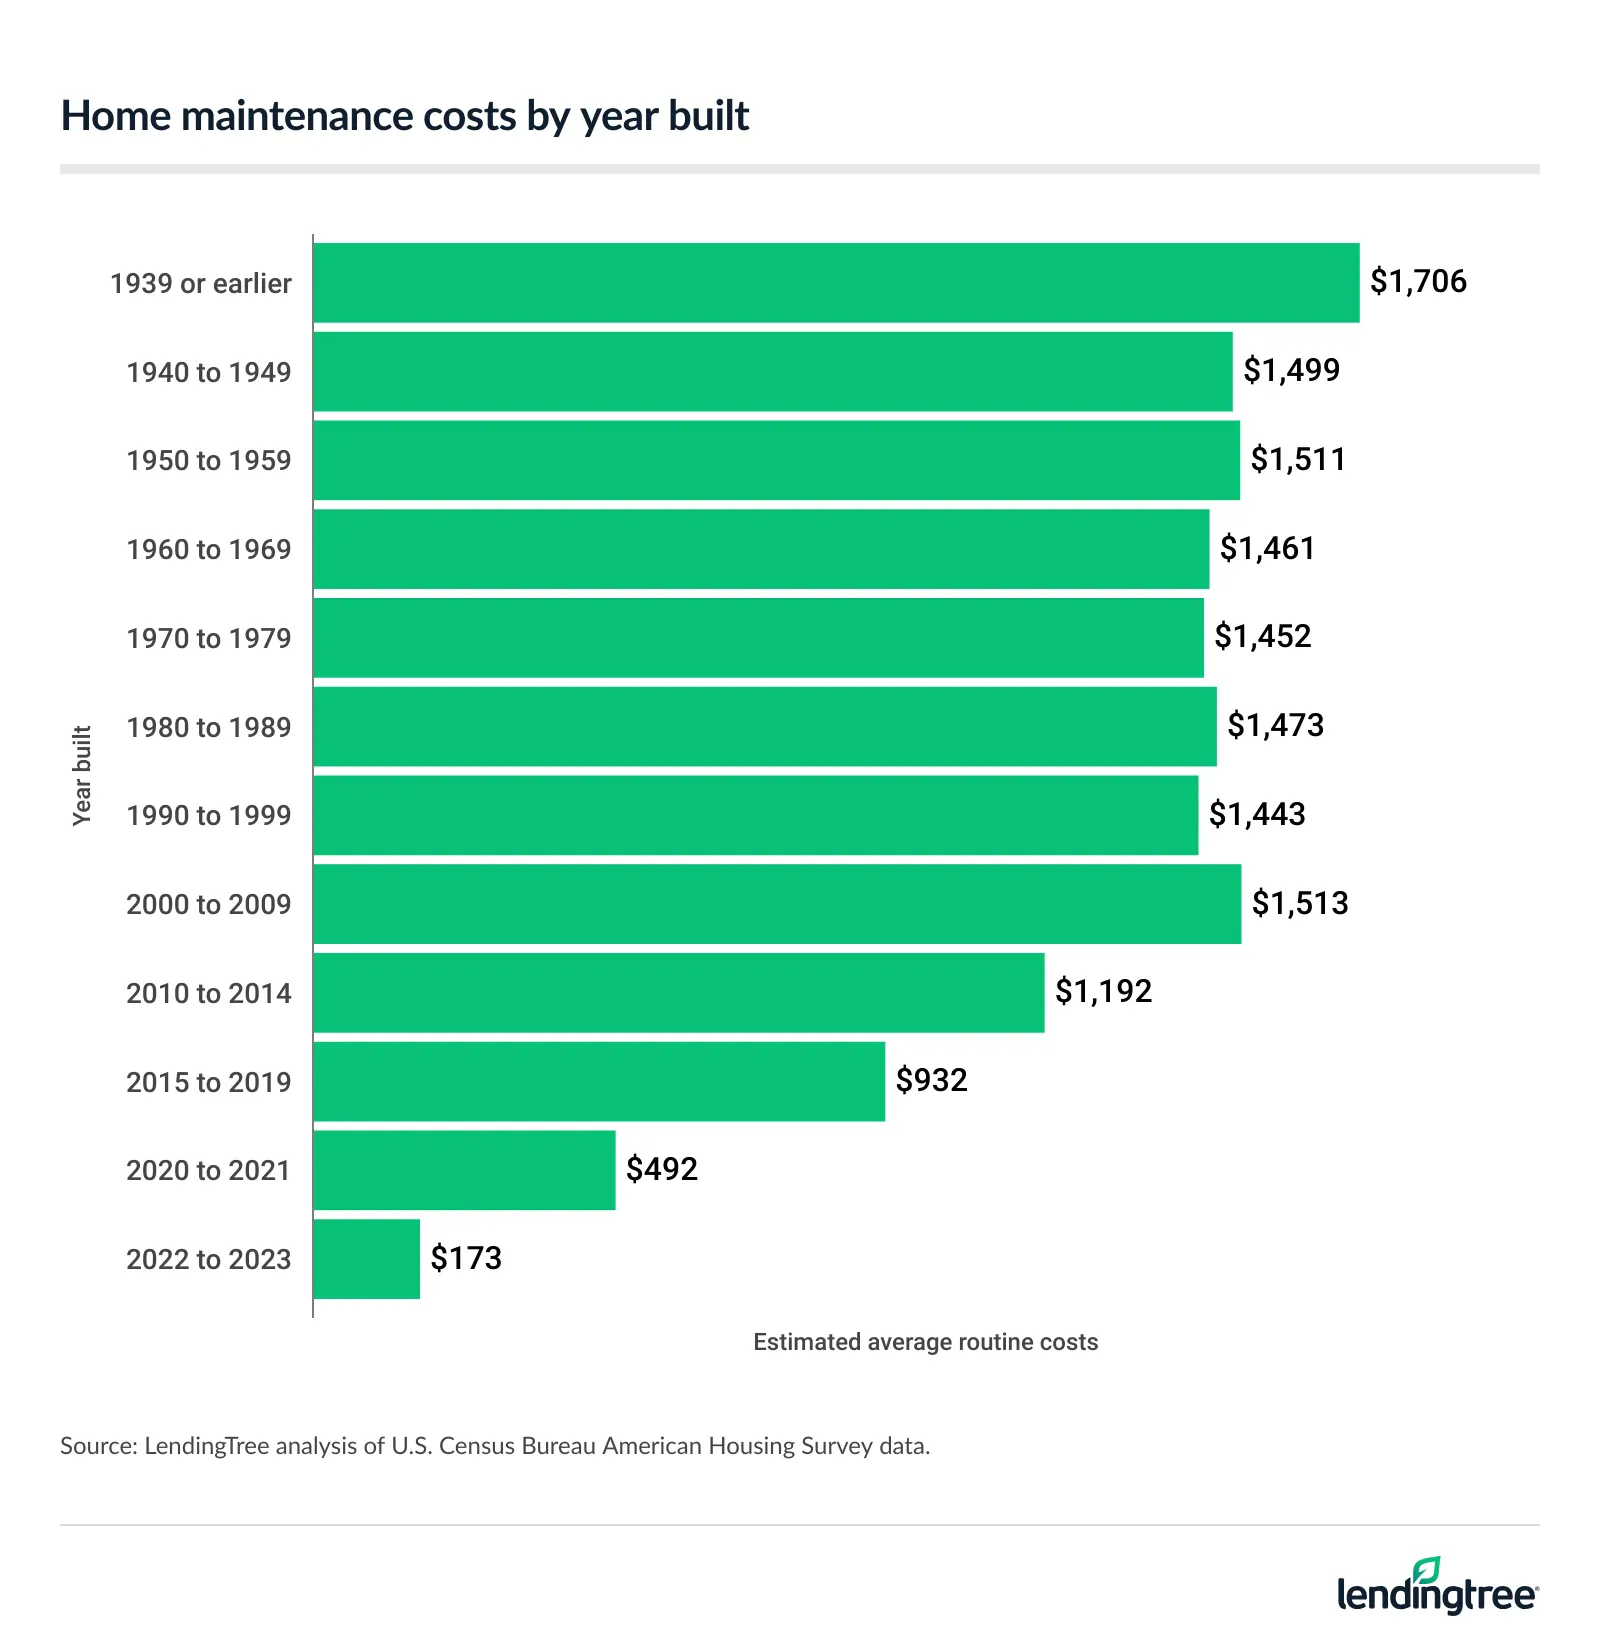
New properties are the cheapest to maintain, with costs falling to three figures for homes built in 2015 and later. Those built from 2022 to 2023 cost just $173 on average to maintain.
For anyone shopping for an older property, Schulz says that gap in upkeep costs is a reminder to keep savings top of mind.
“This is one of a million reasons why savings is so important,” he said. “Owning a home, especially an older one, can be a never-ending parade of significant unexpected costs. Older homes may need more frequent repairs, and one major problem can wreak havoc on a budget. Before you buy, pay close attention to the roof, foundation, drainage, plumbing, electrical system, HVAC, possible signs of water damage and other possible trouble spots. Also be sure to review the seller’s disclosures carefully and don’t be afraid to ask any further questions. What you don’t know can cost you in a big way.”
Most owner-occupied homes have been improved in the last 2 years
Renovation activity is the norm. Nearly 6 in 10 owner-occupied homes, or 51.6 million of the nation’s 86.9 million owner-occupied properties, underwent some kind of improvement during the research’s two-year lookback window. Altogether, those homes accounted for 139.9 million individual projects — an average of 2.7 projects per improved home.
Nearly half (47.3%) of all projects were completed by homeowners who had moved in after 2014, suggesting that newer buyers are quick to put their stamp on a property. The largest share of projects were completed by homeowners who moved in between 2015 and 2019, accounting for a significant 21.3% of all projects.
The most common single project category was a combined group covering water heaters, dishwashers and garbage disposals, with additions or replacements of these appliances making up 11.7% of all projects tracked. It’s also one of the more budget-friendly categories, with a median cost of $845. Plumbing fixtures ($573) and security systems ($453) are the only cheaper categories.
Most common home improvement projects
| Project | % of projects |
|---|---|
| Water heater, dishwasher or garbage disposal addition or replacement | 11.7% |
| HVAC installation or replacement | 9.1% |
| Flooring, carpeting, paneling or ceiling tiles addition or replacement | 7.8% |
| Plumbing fixtures addition or replacement | 7.1% |
| Roofing repair or replacement | 5.9% |
| Windows or doors addition or replacement | 5.6% |
| Bathroom remodeling | 5.3% |
| Landscaping or sprinkler system addition or replacement | 5.0% |
| Security system installation | 5.0% |
| Electrical wiring, fuse boxes or breaker switches addition or replacement | 4.7% |
Schulz says the sheer volume of ongoing projects is a signal that homeownership costs rarely let up.
“The costs of homeownership never seem to stop,” he said. “Repairs and other projects can pile up in a hurry. Some fixes are optional, but others, such as replacing a damaged roof or a broken HVAC system, simply can’t be postponed for long. Buyers should leave room in their monthly budget for home maintenance and start building a home repair fund as soon as possible. Otherwise, you may end up with no choice but to put repairs on a high-interest credit card, which isn’t what anyone needs.”
Cash remains the go-to way to pay for projects
When it’s time to pay for a project, most homeowners aren’t reaching for a loan. Cash savings covered 75.7% of home improvement projects, far outpacing credit cards (6.3%) and homeowners insurance settlements (3.9%). Cash tends to fund the smaller jobs — the median cash-funded project cost an estimated $1,902 — while pricier undertakings lean on other sources. The median cost of projects paid for with home equity loans was $7,924, and it was $9,963 for those funded through insurance settlements.
So when does it make sense to tap savings versus borrow? Schulz says it depends on the size of the project and the health of a household’s finances.
“This can vary by household,” he said. “However, savings generally makes the most sense when you can pay for a project without completely draining your emergency fund or forgoing other important goals. It avoids interest and keeps the house from being tied to additional debt.”
In some cases, though, taking a loan may make sense, as long as homeowners are clear-eyed about the risks and costs. “Borrowing against home equity may be reasonable for a large, necessary project with a long useful life, especially when you have strong equity, stable income and a clear repayment plan,” says Schulz. “However, there’s a risk there. Putting your house up as collateral isn’t something that should be done lightly.”
Home renovations by funding source and estimated costs
| Funding source | Project share | Estimated median ($) |
|---|---|---|
| Cash from savings | 75.7% | $1,902 |
| Credit card or retail store charge card | 6.3% | $2,113 |
| Something else | 5.1% | $4,226 |
| Homeowners insurance settlement | 3.9% | $9,963 |
| Home equity loan | 3.0% | $7,924 |
| Cash from refinancing home | 2.3% | $5,389 |
| Contractor-arranged financing | 1.9% | $7,924 |
| Not reported | 1.9% | $3,019 |
Budgeting before you renovate: Top expert tips
A home improvement project can get expensive quickly, so a solid financial plan is just as important as the project plan itself. We offer the following advice:
- Get multiple detailed estimates. “Define your project as specifically as possible and aim for at least three itemized estimates,” Schulz says. “Prices can vary significantly, and competing estimates can give you leverage when negotiating with your preferred contractor.”
- Leave room for surprise. “Build a cushion into your budget for unexpected costs, especially if you have an older home,” he says. “That extra breathing room can keep one hidden problem from forcing you to put expenses on a credit card.”
- Compare ways to pay. “Whether you’re considering a home equity loan, credit card, personal loan or another option, shop around and compare offers,” he says. “The best financing choice is one that lets you complete the project without creating a bigger financial problem afterward.”
Methodology
Researchers analyzed national estimates from the U.S. Census Bureau’s 2023 American Housing Survey. The primary analysis covers owner-occupied housing units and home improvement activity reported during the 2023 survey’s two-year reference period. Historical median project expenditures use estimates from the 2015, 2017, 2019, 2021 and 2023 surveys.
Dollar estimates presented in 2025 dollars were calculated by multiplying the corresponding 2023 American Housing Survey estimates by an inflation adjustment factor derived from the average of the available 2025 monthly observations in the U.S. Bureau of Labor Statistics (BLS) Consumer Price Index for All Urban Consumers (CPI-U).
View mortgage loan offers from up to 5 lenders in minutes