Average New Mortgage Payment Is $1,942 a Month — and Nearly 1 in 4 Spend at Least 30% of Income
Housing costs consume a large portion of most household budgets. When added to essentials like groceries, transportation, utilities and other monthly bills, many Americans are left financially stretched.
Data offers some modest relief: The average monthly payment on a new mortgage fell 2.4% to $1,942 in 2025, down from $1,990 the previous year. Still, affordability pressures remain significant. Nearly 1 in 4 new borrowers devote at least 30% of their income to mortgage payments — a common benchmark for housing cost burden.
Our analysis highlights where mortgage payments are increasing or decreasing nationwide, as well as which metros place the greatest financial strain on new homebuyers.
- Average new mortgage payments dipped slightly in 2025. The average new monthly payment fell 2.4% from $1,990 in 2024 to $1,942 in 2025. As a result, borrowers spent an average of 20.3% of their monthly income on new mortgage payments. Even still, 24.3% spent at least 30% of their income, a common affordability stress benchmark.
- Gen Zers face the highest new mortgage payment burden. Gen Z borrowers spend an average of 24.5% of their monthly income on mortgage payments, compared with 20.3% for millennials and 18.2% for Gen Xers. Additionally, 32.0% of Gen Zers spend 30% or more of their income, versus 21.7% of millennials and 20.1% of Gen Xers.
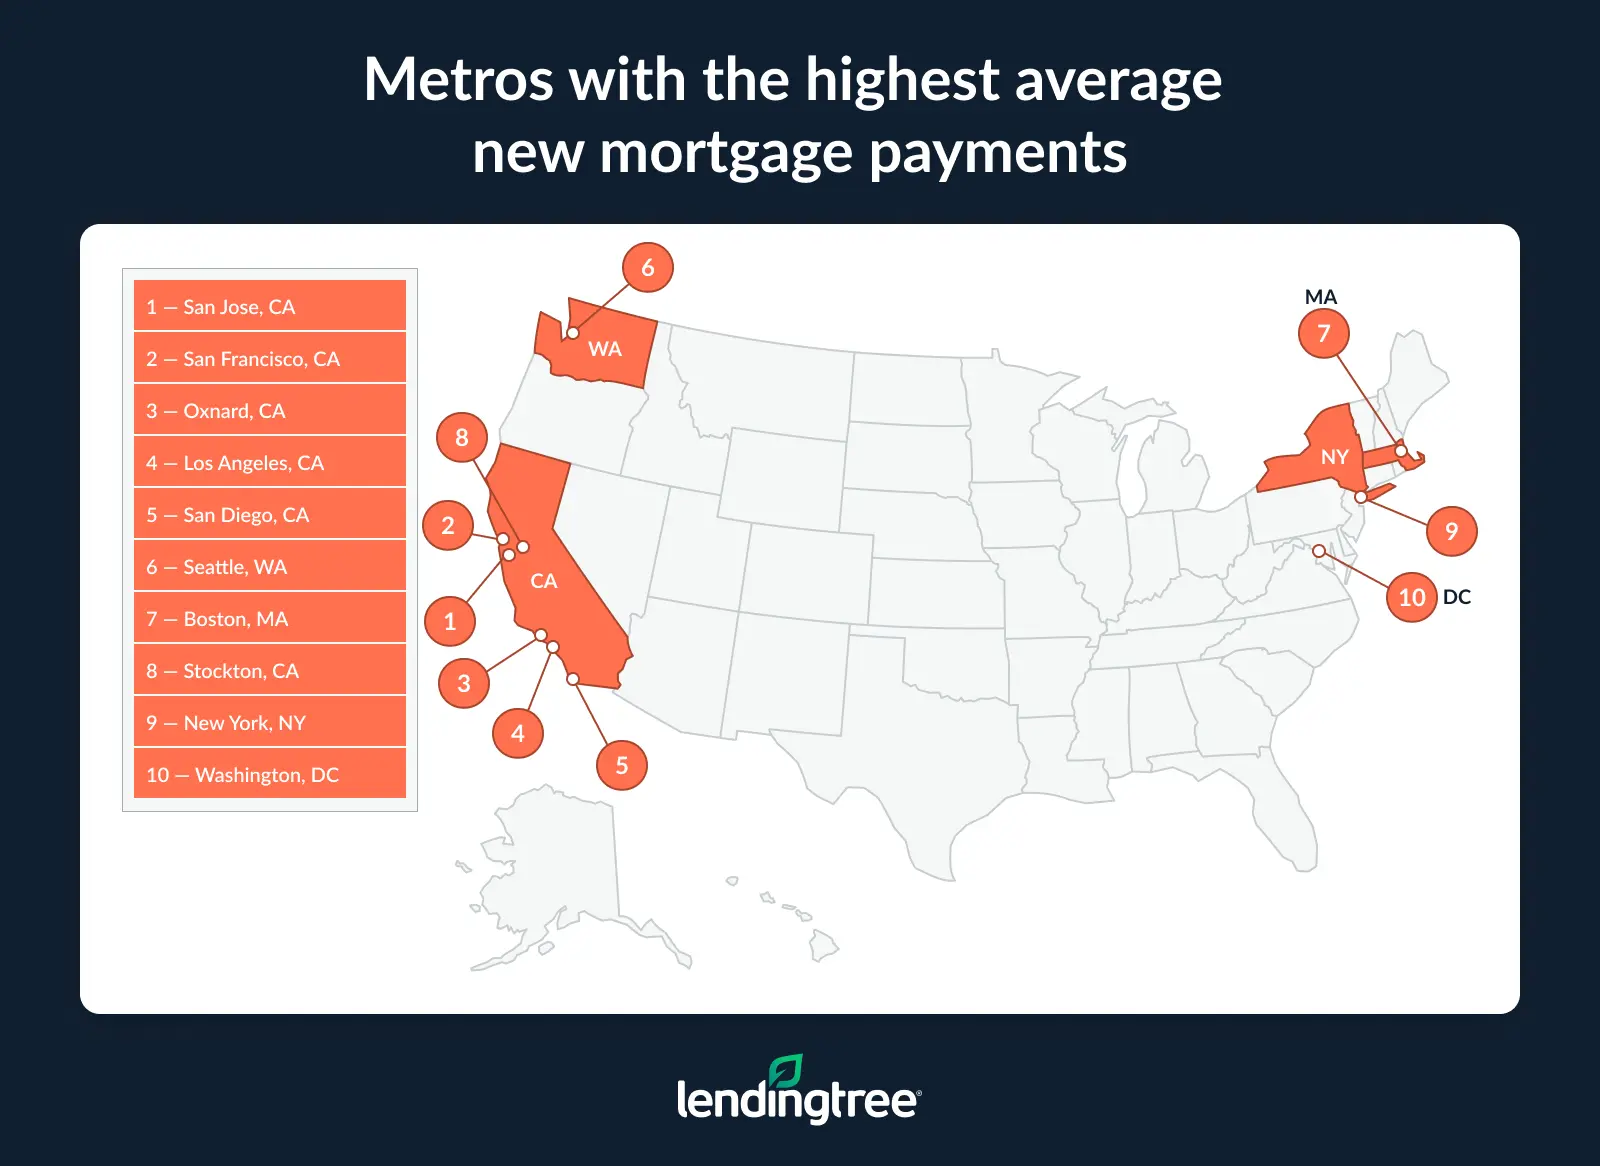
- California metros dominate among the highest new mortgage payments. The five highest-paying metros are all in the state: San Jose ($4,016), San Francisco ($3,850), Oxnard ($3,401), Los Angeles ($3,366) and San Diego ($3,225).
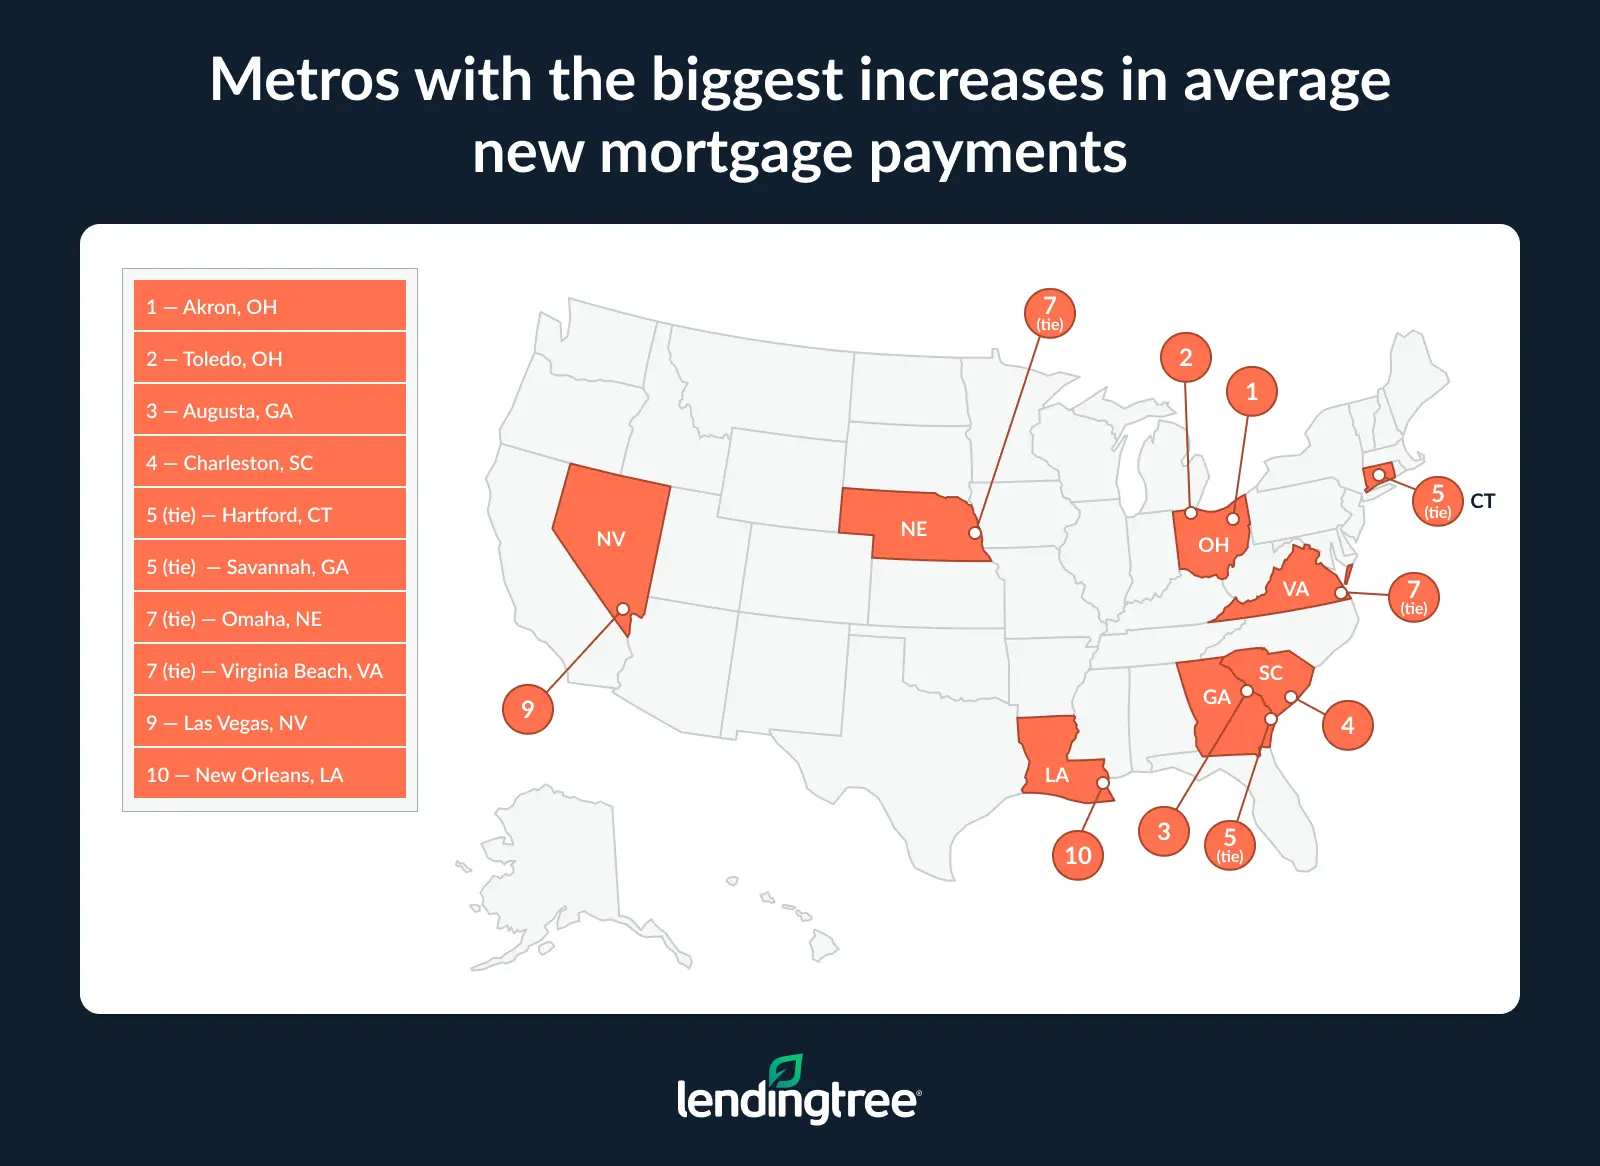
- Despite the national decline, Midwest and Southern metros led among areas where new mortgage payments rose. Out of the 100 biggest metros, 26 saw new payments rise, led by Akron, Ohio (10.7%), Toledo, Ohio (9.7%), and Augusta, Ga. (8.9%).
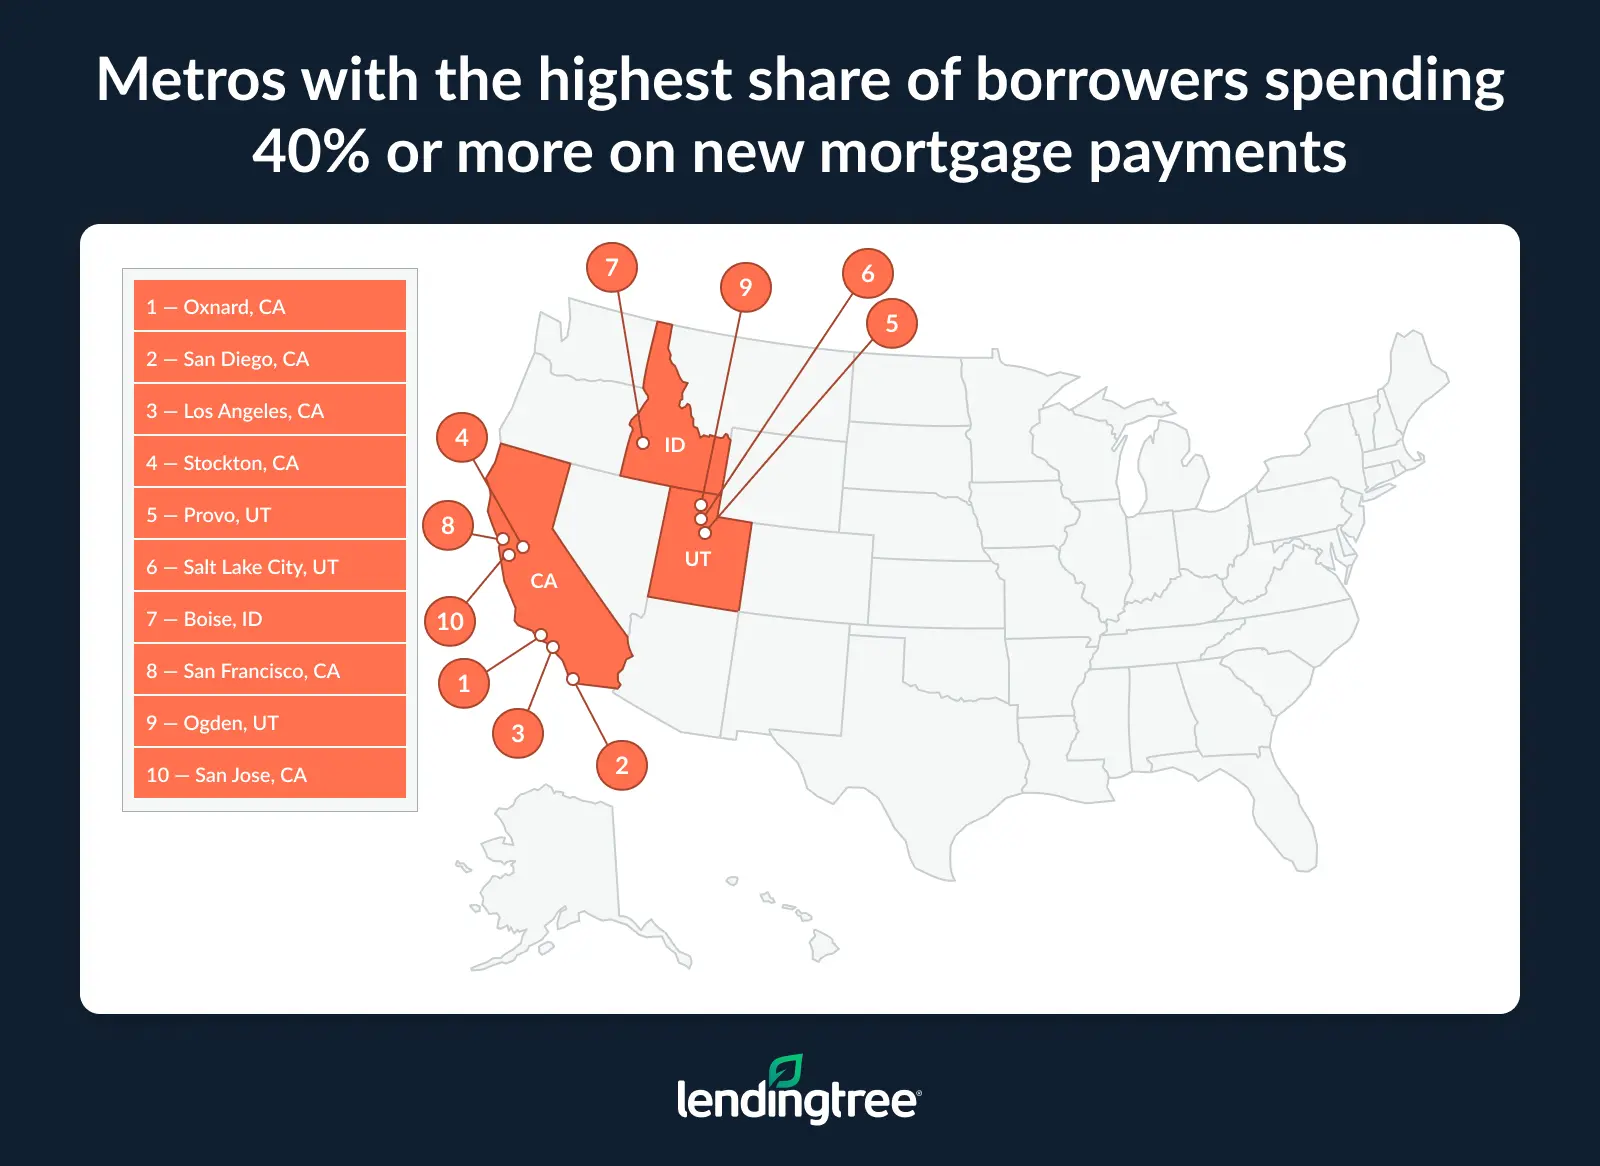
- 1 in 10 borrowers are significantly cost-burdened. Nationwide, 10.2% of borrowers spend 40% or more of their income on new mortgage payments. That share climbs to 26.9% in Oxnard, 25.6% in San Diego and 25.2% in Los Angeles, with Utah metros Provo (21.4%) and Salt Lake City (21.3%) also ranking among the highest.
Average new mortgage payments fell 2.4% year over year
New homebuyers are seeing slightly lower mortgage payments compared to a year ago. The average monthly payment on a new mortgage fell from $1,990 in 2024 to $1,942 in 2025, a 2.4% decline. As a result, the typical new borrower spent 20.3% of their monthly income on their mortgage payment in 2025.
Despite the decline, affordability issues remain. Nearly a quarter of new borrowers (24.3%) allocated at least 30% of their monthly income to their mortgage — a threshold commonly used as a benchmark for housing cost stress.
Average new mortgage payments at a glance (nationwide)
| Avg. new monthly payment, 2024 | $1,990 |
| Avg. new monthly payment, 2025 | $1,942 |
| $ change | -$48 |
| % change | -2.4% |
| Avg. monthly income, 2025 | $9,590 |
| Avg. % of monthly income | 20.3% |
| % spending at least 30% of income | 24.3% |
“Tying up that much of your income in housing payments can make things really challenging,” says Matt Schulz, LendingTree chief consumer finance analyst and author of “Ask Questions, Save Money, Make More: How to Take Control of Your Financial Life.”
“That’s money that can’t go toward other needs, like child care, or toward longer-term financial goals, like building an emergency fund, investing for retirement or saving for college.”
Notably, these figures reflect principal and interest payments only. When property taxes and homeowners insurance are factored in, many buyers are spending an even larger share of their income on housing costs. “The unfortunate truth is that the only way many people can buy a home in many parts of this country is to devote an outsized portion of their income to it,” Schulz says.
Youngest homebuyers face the highest new mortgage payment burden
Younger borrowers are facing the greatest financial strain when it comes to buying a home. Data shows that Gen Z borrowers (ages 18 to 28) spend an average of 24.5% of their monthly income on mortgage payments. By comparison, millennials (ages 29 to 44) spend 20.3% on average, while Gen Xers (ages 45 to 60) allocate 18.2% and baby boomers (61 to 79) pay 19.5%.
Notably, nearly one-third (32.0%) of new Gen Z borrowers spend 30% or more of their income on principal and interest payments — significantly higher than the share of millennials (21.7%) and Gen Xers (20.1%) who do the same. Among baby boomers, 27.8% are spending at least 30% of their income on mortgage payments.
Average new mortgage payments by generation, 2025
| Generation | Avg. new monthly payment | Avg. monthly income | Avg. % of monthly income | % spending at least 30% of income |
|---|---|---|---|---|
| Gen Zers | $1,722 | $7,029 | 24.5% | 32.0% |
| Millennials | $2,126 | $10,485 | 20.3% | 21.7% |
| Gen Xers | $1,915 | $10,547 | 18.2% | 20.1% |
| Baby boomers | $1,655 | $8,511 | 19.5% | 27.8% |
Schulz says that younger borrowers entering the housing market should expect to dedicate a larger share of their income to mortgage payments than the generations before them.
“They typically earn less and have lower credit scores than older Americans, and that’s a difficult mix when you’re trying to buy a home,” Schulz says. “It also means that if you do qualify to get a home, you’re likely to put down a smaller down payment and face higher interest rates. Add it all up, and it can mean having a bigger monthly payment than you’d like.”
California metros have the highest new mortgage payments
New borrowers in California face the highest mortgage payments in the country. In fact, the five metros with the highest average monthly payments are all in the Golden State. San Jose ranks first, with an average monthly payment of $4,016, followed by San Francisco ($3,850), Oxnard ($3,401), Los Angeles ($3,366) and San Diego ($3,225).
Several factors likely contribute to California’s affordability challenges. Home prices in the state are significantly higher than in much of the country and rose sharply between 2020 and 2022. While prices have stabilized somewhat, household incomes haven’t kept up with rising housing costs. In 2025, only about 45% of California households were likely to qualify for a mortgage on a bottom-tier home, down from 60% in 2019. For midtier homes, the share falls to just 23%, compared with 35% in 2019, according to the California Legislative Analyst’s Office.
Additionally, monthly mortgage payments in California have increased faster than rents, putting homeownership further out of reach for many prospective buyers. Elevated mortgage interest rates have also discouraged existing homeowners from selling, keeping inventory tight for those who can afford to buy.
“California can certainly be a challenging place to buy a home,” Schulz says. “Sure, people in the state’s biggest cities typically earn more than people in other parts of the country, but housing costs can be outrageously high in those areas.
“That can easily leave someone house-poor or force them to make compromises they’d rather not make, such as settling for a smaller home or a longer commute — or even not being able to purchase a home at all.”
While California and East Coast metros dominate the rankings for the highest average new mortgage payments, the South and Midwest are well-represented among the lowest-ranked markets. Toledo, Ohio, has the lowest average monthly payment among the 100 metros in our study at $1,297, followed by Wichita, Kan. ($1,343), Akron, Ohio ($1,393), Columbia, S.C. ($1,439), and Little Rock, Ark. ($1,440).
Full rankings: Metros with the highest average new mortgage payments, 2025
| Rank | Metro | Avg. new monthly payment | Avg. monthly income | Avg. % of monthly income | % spending at least 30% of income |
|---|---|---|---|---|---|
| 1 | San Jose, CA | $4,016 | $16,280 | 24.7% | 36.6% |
| 2 | San Francisco, CA | $3,850 | $15,713 | 24.5% | 37.7% |
| 3 | Oxnard, CA | $3,401 | $11,874 | 28.6% | 50.6% |
| 4 | Los Angeles, CA | $3,366 | $12,455 | 27.0% | 45.1% |
| 5 | San Diego, CA | $3,225 | $12,145 | 26.6% | 46.3% |
| 6 | Seattle, WA | $2,976 | $12,792 | 23.3% | 35.8% |
| 7 | Boston, MA | $2,784 | $12,285 | 22.7% | 31.4% |
| 8 | Stockton, CA | $2,654 | $10,541 | 25.2% | 41.5% |
| 9 | New York, NY | $2,615 | $12,511 | 20.9% | 26.9% |
| 10 | Washington, DC | $2,574 | $11,804 | 21.8% | 27.9% |
| 11 | Bridgeport, CT | $2,478 | $13,493 | 18.4% | 20.3% |
| 12 | Denver, CO | $2,468 | $10,958 | 22.5% | 30.3% |
| 13 | Salt Lake City, UT | $2,446 | $10,215 | 23.9% | 41.3% |
| 14 | Sacramento, CA | $2,426 | $10,542 | 23.0% | 36.4% |
| 15 | Provo, UT | $2,406 | $9,215 | 26.1% | 46.1% |
| 16 | Riverside, CA | $2,366 | $9,513 | 24.9% | 41.3% |
| 17 | Miami, FL | $2,308 | $10,946 | 21.1% | 29.0% |
| 18 | Las Vegas, NV | $2,236 | $10,299 | 21.7% | 36.0% |
| 19 | Portland, OR | $2,218 | $10,133 | 21.9% | 33.1% |
| 20 | Ogden, UT | $2,187 | $8,470 | 25.8% | 42.6% |
| 21 | Austin, TX | $2,183 | $11,845 | 18.4% | 18.4% |
| 22 | Worcester, MA | $2,155 | $9,809 | 22.0% | 27.0% |
| 23 | Charleston, SC | $2,142 | $10,330 | 20.7% | 28.8% |
| 24 | Colorado Springs, CO | $2,117 | $9,251 | 22.9% | 35.6% |
| 25 | Phoenix, AZ | $2,106 | $9,582 | 22.0% | 30.9% |
| 26 | Providence, RI | $2,104 | $9,128 | 23.1% | 34.9% |
| 27 | Portland, ME | $2,097 | $9,123 | 23.0% | 38.6% |
| 28 | Boise, ID | $2,079 | $8,993 | 23.1% | 39.8% |
| 29 | Nashville, TN | $2,068 | $9,535 | 21.7% | 28.8% |
| 30 | Dallas, TX | $2,059 | $10,606 | 19.4% | 19.4% |
| 31 | Charlotte, NC | $2,036 | $10,456 | 19.5% | 21.4% |
| 32 | Raleigh, NC | $2,030 | $10,186 | 19.9% | 24.4% |
| 33 | Atlanta, GA | $2,001 | $10,023 | 20.0% | 23.9% |
| 34 | Fresno, CA | $1,992 | $8,510 | 23.4% | 35.5% |
| 35 | Baltimore, MD | $1,985 | $10,108 | 19.6% | 20.8% |
| 36 | Orlando, FL | $1,978 | $9,621 | 20.6% | 27.5% |
| 37 | Bakersfield, CA | $1,969 | $8,261 | 23.8% | 34.1% |
| 38 | Durham, NC | $1,947 | $10,288 | 18.9% | 19.6% |
| 39 | Philadelphia, PA | $1,924 | $9,759 | 19.7% | 22.0% |
| 40 | Madison, WI | $1,915 | $9,969 | 19.2% | 23.0% |
| 41 | Chicago, IL | $1,912 | $10,541 | 18.1% | 15.4% |
| 42 | New Haven, CT | $1,873 | $9,661 | 19.4% | 22.7% |
| 43 | Minneapolis, MN | $1,846 | $9,535 | 19.4% | 20.2% |
| 44 | Asheville, NC | $1,845 | $9,170 | 20.1% | 22.0% |
| 44 | North Port, FL | $1,845 | $9,508 | 19.4% | 24.5% |
| 46 | Albuquerque, NM | $1,836 | $8,769 | 20.9% | 26.4% |
| 47 | Tampa, FL | $1,829 | $9,465 | 19.3% | 21.8% |
| 48 | Virginia Beach, VA | $1,826 | $8,109 | 22.5% | 33.1% |
| 49 | Richmond, VA | $1,818 | $9,269 | 19.6% | 25.0% |
| 50 | Houston, TX | $1,814 | $10,153 | 17.9% | 16.8% |
| 51 | Cape Coral, FL | $1,809 | $9,712 | 18.6% | 25.0% |
| 52 | Hartford, CT | $1,806 | $9,774 | 18.5% | 18.2% |
| 53 | Knoxville, TN | $1,799 | $8,839 | 20.4% | 27.1% |
| 53 | New Orleans, LA | $1,799 | $10,622 | 16.9% | 15.6% |
| 55 | Savannah, GA | $1,789 | $9,311 | 19.2% | 22.5% |
| 56 | Wilmington, NC | $1,786 | $10,049 | 17.8% | 22.2% |
| 57 | Milwaukee, WI | $1,781 | $8,785 | 20.3% | 20.6% |
| 58 | Fayetteville, AR | $1,780 | $10,382 | 17.2% | 21.5% |
| 59 | Palm Bay, FL | $1,775 | $9,361 | 19.0% | 20.6% |
| 60 | Tucson, AZ | $1,762 | $8,781 | 20.1% | 25.0% |
| 61 | Lakeland, FL | $1,754 | $9,295 | 18.9% | 21.6% |
| 62 | San Antonio, TX | $1,711 | $8,945 | 19.1% | 21.3% |
| 63 | Allentown, PA | $1,701 | $8,404 | 20.2% | 23.9% |
| 64 | Jacksonville, FL | $1,698 | $8,967 | 18.9% | 22.7% |
| 65 | Lancaster, PA | $1,689 | $8,771 | 19.3% | 19.1% |
| 66 | Kansas City, MO | $1,687 | $9,041 | 18.7% | 19.4% |
| 67 | Deltona, FL | $1,685 | $8,592 | 19.6% | 27.9% |
| 68 | Columbus, OH | $1,680 | $8,817 | 19.1% | 18.6% |
| 69 | Indianapolis, IN | $1,675 | $9,062 | 18.5% | 18.1% |
| 70 | Harrisburg, PA | $1,668 | $8,300 | 20.1% | 22.7% |
| 71 | Pensacola, FL | $1,662 | $8,930 | 18.6% | 20.7% |
| 72 | Huntsville, AL | $1,651 | $8,871 | 18.6% | 16.8% |
| 73 | Birmingham, AL | $1,628 | $9,166 | 17.8% | 14.0% |
| 74 | Chattanooga, TN | $1,624 | $8,705 | 18.7% | 23.5% |
| 75 | St. Louis, MO | $1,622 | $8,834 | 18.4% | 17.2% |
| 75 | Omaha, NE | $1,622 | $8,965 | 18.1% | 13.5% |
| 77 | Memphis, TN | $1,619 | $8,361 | 19.4% | 22.8% |
| 78 | Greensboro, NC | $1,606 | $7,878 | 20.4% | 26.1% |
| 79 | Louisville, KY | $1,585 | $8,426 | 18.8% | 19.7% |
| 80 | Grand Rapids, MI | $1,579 | $8,449 | 18.7% | 17.7% |
| 81 | Killeen, TX | $1,573 | $7,570 | 20.8% | 24.8% |
| 82 | Myrtle Beach, SC | $1,569 | $8,781 | 17.9% | 20.2% |
| 83 | Des Moines, IA | $1,559 | $8,318 | 18.7% | 17.9% |
| 84 | Greenville, SC | $1,558 | $8,168 | 19.1% | 20.4% |
| 85 | Detroit, MI | $1,557 | $8,754 | 17.8% | 12.3% |
| 86 | Cincinnati, OH | $1,543 | $8,818 | 17.5% | 14.3% |
| 87 | Augusta, GA | $1,532 | $8,032 | 19.1% | 22.8% |
| 88 | Oklahoma City, OK | $1,525 | $8,857 | 17.2% | 16.6% |
| 89 | Tulsa, OK | $1,506 | $8,269 | 18.2% | 16.4% |
| 89 | Pittsburgh, PA | $1,506 | $8,881 | 17.0% | 13.7% |
| 91 | Winston-Salem, NC | $1,473 | $7,182 | 20.5% | 29.8% |
| 92 | York, PA | $1,465 | $7,060 | 20.8% | 25.2% |
| 92 | Springfield, MO | $1,465 | $8,390 | 17.5% | 17.2% |
| 94 | El Paso, TX | $1,460 | $7,226 | 20.2% | 21.7% |
| 95 | Cleveland, OH | $1,457 | $8,472 | 17.2% | 14.3% |
| 96 | Little Rock, AR | $1,440 | $8,081 | 17.8% | 15.6% |
| 97 | Columbia, SC | $1,439 | $7,720 | 18.6% | 18.6% |
| 98 | Akron, OH | $1,393 | $8,140 | 17.1% | 17.7% |
| 99 | Wichita, KS | $1,343 | $7,508 | 17.9% | 16.4% |
| 100 | Toledo, OH | $1,297 | $8,946 | 14.5% | 12.4% |
New mortgage payments rose in 26 metros
While average mortgage payments dipped 2.4% nationally in the past year, about a quarter — 26 — of the 100 largest metros saw payments increase. Notably, several Midwestern and Southern metros experienced some of the biggest jumps, even though average payments in those regions remain lower than in many other parts of the country.
Akron, Ohio, saw the largest increase, with average payments rising 10.7%. It’s followed by Toledo, Ohio (9.7%), Augusta, Ga. (8.9%), and Charleston, S.C. (6.7%).
Although the Midwest has long been considered relatively affordable, a persistent shortage of available homes combined with strong buyer demand has pushed prices higher. With limited inventory and elevated mortgage rates, monthly payments have climbed even in markets that historically had lower housing costs.
In parts of the South, strong population growth and housing demand have driven up home prices across many metros. States in the Southeast, including Georgia and South Carolina, have seen some of the sharpest increases in housing costs, which in turn have pushed monthly mortgage payments higher for new borrowers.
Interestingly, four of the five metros with the largest decreases are in the South. Borrowers in Fresno, Calif., saw the biggest payment decrease of the 100 largest metros, with average monthly mortgage payments falling by 17.5%. That’s followed by North Port, Fla. (17.4%), Winston-Salem, N.C. (15.6%), San Antonio, Texas (15.1%), and Jacksonville, Fla. (14.9%).
Full rankings: Metros with the biggest increases in average new mortgage payments
| Rank | Metro | Avg. new monthly payment, 2024 | Avg. new monthly payment, 2025 | $ change | % change |
|---|---|---|---|---|---|
| 1 | Akron, OH | $1,259 | $1,393 | $134 | 10.7% |
| 2 | Toledo, OH | $1,183 | $1,297 | $114 | 9.7% |
| 3 | Augusta, GA | $1,406 | $1,532 | $126 | 8.9% |
| 4 | Charleston, SC | $2,007 | $2,142 | $135 | 6.7% |
| 5 | Hartford, CT | $1,700 | $1,806 | $106 | 6.2% |
| 5 | Savannah, GA | $1,685 | $1,789 | $104 | 6.2% |
| 7 | Omaha, NE | $1,543 | $1,622 | $79 | 5.1% |
| 7 | Virginia Beach, VA | $1,737 | $1,826 | $89 | 5.1% |
| 9 | Las Vegas, NV | $2,135 | $2,236 | $101 | 4.8% |
| 10 | New Orleans, LA | $1,720 | $1,799 | $79 | 4.6% |
| 11 | Madison, WI | $1,840 | $1,915 | $75 | 4.1% |
| 12 | Detroit, MI | $1,506 | $1,557 | $51 | 3.4% |
| 12 | New Haven, CT | $1,811 | $1,873 | $62 | 3.4% |
| 14 | Boise, ID | $2,013 | $2,079 | $66 | 3.3% |
| 14 | Cincinnati, OH | $1,493 | $1,543 | $50 | 3.3% |
| 14 | Cleveland, OH | $1,411 | $1,457 | $46 | 3.3% |
| 14 | New York, NY | $2,533 | $2,615 | $82 | 3.3% |
| 18 | Indianapolis, IN | $1,629 | $1,675 | $46 | 2.8% |
| 19 | Palm Bay, FL | $1,728 | $1,775 | $47 | 2.7% |
| 20 | Lancaster, PA | $1,652 | $1,689 | $37 | 2.2% |
| 21 | Colorado Springs, CO | $2,077 | $2,117 | $40 | 1.9% |
| 22 | Ogden, UT | $2,150 | $2,187 | $37 | 1.7% |
| 23 | Minneapolis, MN | $1,823 | $1,846 | $23 | 1.3% |
| 24 | Miami, FL | $2,293 | $2,308 | $15 | 0.7% |
| 25 | Salt Lake City, UT | $2,431 | $2,446 | $15 | 0.6% |
| 26 | Birmingham, AL | $1,625 | $1,628 | $3 | 0.2% |
| 27 | Atlanta, GA | $2,003 | $2,001 | -$2 | -0.1% |
| 27 | Bridgeport, CT | $2,480 | $2,478 | -$2 | -0.1% |
| 29 | Columbus, OH | $1,688 | $1,680 | -$8 | -0.5% |
| 30 | Washington, DC | $2,588 | $2,574 | -$14 | -0.6% |
| 31 | Provo, UT | $2,424 | $2,406 | -$18 | -0.7% |
| 32 | Memphis, TN | $1,635 | $1,619 | -$16 | -1.0% |
| 33 | Portland, ME | $2,120 | $2,097 | -$23 | -1.1% |
| 34 | Knoxville, TN | $1,824 | $1,799 | -$25 | -1.4% |
| 35 | Bakersfield, CA | $2,002 | $1,969 | -$33 | -1.7% |
| 35 | Deltona, FL | $1,714 | $1,685 | -$29 | -1.7% |
| 35 | Portland, OR | $2,257 | $2,218 | -$39 | -1.7% |
| 35 | York, PA | $1,491 | $1,465 | -$26 | -1.7% |
| 39 | Louisville, KY | $1,614 | $1,585 | -$29 | -1.8% |
| 40 | Durham, NC | $1,987 | $1,947 | -$40 | -2.0% |
| 41 | St. Louis, MO | $1,659 | $1,622 | -$37 | -2.2% |
| 42 | Grand Rapids, MI | $1,618 | $1,579 | -$39 | -2.4% |
| 42 | Little Rock, AR | $1,476 | $1,440 | -$36 | -2.4% |
| 42 | Oxnard, CA | $3,484 | $3,401 | -$83 | -2.4% |
| 45 | Albuquerque, NM | $1,890 | $1,836 | -$54 | -2.8% |
| 46 | Lakeland, FL | $1,806 | $1,754 | -$52 | -2.9% |
| 47 | Greensboro, NC | $1,655 | $1,606 | -$49 | -3.0% |
| 47 | Huntsville, AL | $1,702 | $1,651 | -$51 | -3.0% |
| 49 | Richmond, VA | $1,876 | $1,818 | -$58 | -3.1% |
| 50 | Providence, RI | $2,173 | $2,104 | -$69 | -3.2% |
| 50 | San Francisco, CA | $3,976 | $3,850 | -$126 | -3.2% |
| 52 | Chicago, IL | $1,986 | $1,912 | -$74 | -3.7% |
| 53 | Tucson, AZ | $1,831 | $1,762 | -$69 | -3.8% |
| 54 | Kansas City, MO | $1,755 | $1,687 | -$68 | -3.9% |
| 55 | Columbia, SC | $1,500 | $1,439 | -$61 | -4.1% |
| 56 | Orlando, FL | $2,068 | $1,978 | -$90 | -4.3% |
| 56 | Philadelphia, PA | $2,011 | $1,924 | -$87 | -4.3% |
| 58 | Riverside, CA | $2,478 | $2,366 | -$112 | -4.5% |
| 59 | Chattanooga, TN | $1,703 | $1,624 | -$79 | -4.6% |
| 60 | Baltimore, MD | $2,082 | $1,985 | -$97 | -4.7% |
| 61 | Denver, CO | $2,591 | $2,468 | -$123 | -4.8% |
| 61 | Myrtle Beach, SC | $1,648 | $1,569 | -$79 | -4.8% |
| 61 | Nashville, TN | $2,172 | $2,068 | -$104 | -4.8% |
| 64 | Asheville, NC | $1,941 | $1,845 | -$96 | -5.0% |
| 65 | Charlotte, NC | $2,149 | $2,036 | -$113 | -5.2% |
| 65 | Greenville, SC | $1,644 | $1,558 | -$86 | -5.2% |
| 67 | Tulsa, OK | $1,592 | $1,506 | -$86 | -5.4% |
| 68 | Oklahoma City, OK | $1,616 | $1,525 | -$91 | -5.6% |
| 69 | Cape Coral, FL | $1,923 | $1,809 | -$114 | -5.9% |
| 70 | Sacramento, CA | $2,580 | $2,426 | -$154 | -6.0% |
| 71 | Phoenix, AZ | $2,246 | $2,106 | -$140 | -6.3% |
| 72 | Seattle, WA | $3,189 | $2,976 | -$213 | -6.7% |
| 72 | Wichita, KS | $1,440 | $1,343 | -$97 | -6.7% |
| 74 | San Diego, CA | $3,472 | $3,225 | -$247 | -7.1% |
| 75 | Allentown, PA | $1,832 | $1,701 | -$131 | -7.2% |
| 75 | El Paso, TX | $1,574 | $1,460 | -$114 | -7.2% |
| 77 | Raleigh, NC | $2,193 | $2,030 | -$163 | -7.4% |
| 78 | Harrisburg, PA | $1,809 | $1,668 | -$141 | -7.8% |
| 79 | Des Moines, IA | $1,702 | $1,559 | -$143 | -8.4% |
| 80 | Boston, MA | $3,044 | $2,784 | -$260 | -8.5% |
| 81 | Pittsburgh, PA | $1,650 | $1,506 | -$144 | -8.7% |
| 82 | Fayetteville, AR | $1,960 | $1,780 | -$180 | -9.2% |
| 82 | Springfield, MO | $1,614 | $1,465 | -$149 | -9.2% |
| 84 | Wilmington, NC | $1,995 | $1,786 | -$209 | -10.5% |
| 84 | Worcester, MA | $2,407 | $2,155 | -$252 | -10.5% |
| 86 | Austin, TX | $2,445 | $2,183 | -$262 | -10.7% |
| 86 | Pensacola, FL | $1,861 | $1,662 | -$199 | -10.7% |
| 88 | Tampa, FL | $2,050 | $1,829 | -$221 | -10.8% |
| 89 | San Jose, CA | $4,530 | $4,016 | -$514 | -11.3% |
| 90 | Milwaukee, WI | $2,014 | $1,781 | -$233 | -11.6% |
| 91 | Killeen, TX | $1,789 | $1,573 | -$216 | -12.1% |
| 92 | Los Angeles, CA | $3,867 | $3,366 | -$501 | -13.0% |
| 93 | Stockton, CA | $3,057 | $2,654 | -$403 | -13.2% |
| 94 | Dallas, TX | $2,376 | $2,059 | -$317 | -13.3% |
| 95 | Houston, TX | $2,129 | $1,814 | -$315 | -14.8% |
| 96 | Jacksonville, FL | $1,995 | $1,698 | -$297 | -14.9% |
| 97 | San Antonio, TX | $2,015 | $1,711 | -$304 | -15.1% |
| 98 | Winston-Salem, NC | $1,744 | $1,473 | -$271 | -15.6% |
| 99 | North Port, FL | $2,234 | $1,845 | -$389 | -17.4% |
| 100 | Fresno, CA | $2,414 | $1,992 | -$422 | -17.5% |
10.2% of borrowers spend 40% or more of their income on new mortgage payments
About 10% of new U.S. borrowers dedicate 40% or more of their income to principal and interest payments. According to federal housing policies, households spending more than 50% of their incomes on housing costs are considered “severely cost burdened,” which considerably limits room in their budgets for other essentials or unexpected expenses.
In some metros, a sizable share of new homebuyers are spending 40% or more on their mortgages. Again, several California metros rank among the highest. In Oxnard, 26.9% of borrowers funnel at least 40% of their income to mortgage payments, followed by San Diego (25.6%), Los Angeles (25.2%) and Stockton (22.3%). Two Utah metros also rank among the highest: Provo (21.4%) and Salt Lake City (21.3%).
Meanwhile, metros in the South and Midwest tend to have much smaller shares of borrowers dedicating 40% or more of their income to mortgage payments. Huntsville, Ala., has the lowest share at 3.9%, followed by Oklahoma City (4.0%), Birmingham, Ala. (4.4%) and Cincinnati (4.6%).
Full rankings: Metros with the highest share of borrowers spending 40% or more on a new monthly mortgage payment
| Rank | Metro | % spending less than 20% of income | % spending 20% to 29.99% of income | % spending 30% to 39.99% of income | % spending at least 40% of income |
|---|---|---|---|---|---|
| 1 | Oxnard, CA | 17.3% | 32.1% | 23.7% | 26.9% |
| 2 | San Diego, CA | 24.4% | 29.3% | 20.7% | 25.6% |
| 3 | Los Angeles, CA | 26.7% | 28.2% | 20.0% | 25.2% |
| 4 | Stockton, CA | 28.7% | 29.8% | 19.2% | 22.3% |
| 5 | Provo, UT | 18.1% | 35.8% | 24.7% | 21.4% |
| 6 | Salt Lake City, UT | 25.2% | 33.5% | 19.9% | 21.3% |
| 7 | Boise, ID | 33.1% | 27.1% | 19.5% | 20.3% |
| 8 | San Francisco, CA | 30.1% | 32.3% | 17.7% | 20.0% |
| 9 | Ogden, UT | 21.0% | 36.4% | 23.3% | 19.3% |
| 10 | San Jose, CA | 29.2% | 34.2% | 17.5% | 19.1% |
| 11 | Riverside, CA | 24.7% | 34.0% | 23.3% | 18.1% |
| 11 | Sacramento, CA | 29.1% | 34.5% | 18.4% | 18.1% |
| 13 | Portland, ME | 31.7% | 29.7% | 21.8% | 16.8% |
| 14 | Las Vegas, NV | 31.9% | 32.1% | 19.9% | 16.1% |
| 15 | Colorado Springs, CO | 28.2% | 36.3% | 19.6% | 15.9% |
| 16 | Worcester, MA | 37.2% | 35.8% | 12.0% | 15.0% |
| 17 | Seattle, WA | 29.9% | 34.3% | 21.3% | 14.6% |
| 18 | Denver, CO | 30.4% | 39.3% | 15.8% | 14.5% |
| 19 | Fresno, CA | 28.7% | 35.9% | 21.1% | 14.3% |
| 20 | Providence, RI | 32.1% | 33.0% | 21.0% | 14.0% |
| 21 | Albuquerque, NM | 37.7% | 36.0% | 12.6% | 13.8% |
| 22 | Deltona, FL | 36.5% | 35.6% | 14.2% | 13.7% |
| 23 | Portland, OR | 36.6% | 30.3% | 19.5% | 13.6% |
| 24 | Virginia Beach, VA | 30.8% | 36.2% | 19.6% | 13.5% |
| 25 | Boston, MA | 30.9% | 37.7% | 18.4% | 13.1% |
| 26 | Miami, FL | 37.7% | 33.3% | 16.2% | 12.9% |
| 26 | Bakersfield, CA | 29.0% | 36.9% | 21.2% | 12.9% |
| 28 | Phoenix, AZ | 31.1% | 38.0% | 18.1% | 12.8% |
| 29 | New York, NY | 40.5% | 32.6% | 14.3% | 12.6% |
| 30 | Charleston, SC | 38.0% | 33.1% | 17.2% | 11.7% |
| 31 | Knoxville, TN | 32.3% | 40.6% | 15.8% | 11.3% |
| 32 | Nashville, TN | 34.6% | 36.6% | 17.6% | 11.2% |
| 33 | Washington, DC | 36.0% | 36.0% | 16.8% | 11.1% |
| 34 | Lakeland, FL | 39.7% | 38.8% | 10.6% | 11.0% |
| 34 | Cape Coral, FL | 44.1% | 30.9% | 14.0% | 11.0% |
| 36 | Orlando, FL | 40.1% | 32.4% | 16.6% | 10.8% |
| 36 | Harrisburg, PA | 40.5% | 36.8% | 11.9% | 10.8% |
| 38 | Savannah, GA | 41.4% | 36.1% | 11.8% | 10.7% |
| 38 | Palm Bay, FL | 43.2% | 36.2% | 9.9% | 10.7% |
| 40 | Wilmington, NC | 46.3% | 31.5% | 11.8% | 10.3% |
| 40 | Pensacola, FL | 44.6% | 34.8% | 10.3% | 10.3% |
| 42 | Asheville, NC | 42.0% | 36.1% | 11.7% | 10.2% |
| 43 | Allentown, PA | 36.9% | 39.2% | 14.0% | 10.0% |
| 44 | York, PA | 39.8% | 35.1% | 15.2% | 9.9% |
| 45 | El Paso, TX | 34.5% | 43.8% | 12.0% | 9.7% |
| 45 | Tampa, FL | 42.6% | 35.6% | 12.2% | 9.7% |
| 47 | Memphis, TN | 37.9% | 39.4% | 13.3% | 9.5% |
| 48 | Minneapolis, MN | 45.2% | 34.6% | 10.9% | 9.3% |
| 48 | Jacksonville, FL | 42.6% | 34.6% | 13.4% | 9.3% |
| 48 | Winston-Salem, NC | 42.9% | 27.3% | 20.5% | 9.3% |
| 51 | Tucson, AZ | 44.9% | 30.1% | 15.9% | 9.1% |
| 51 | San Antonio, TX | 45.7% | 33.0% | 12.2% | 9.1% |
| 53 | Greensboro, NC | 39.7% | 34.2% | 17.1% | 9.0% |
| 53 | North Port, FL | 41.8% | 33.8% | 15.5% | 9.0% |
| 55 | Madison, WI | 41.8% | 35.2% | 14.3% | 8.7% |
| 55 | Louisville, KY | 49.1% | 31.2% | 11.0% | 8.7% |
| 57 | Greenville, SC | 43.1% | 36.5% | 12.1% | 8.4% |
| 58 | Charlotte, NC | 44.8% | 33.8% | 13.1% | 8.3% |
| 59 | Atlanta, GA | 40.2% | 35.9% | 15.8% | 8.2% |
| 60 | Lancaster, PA | 49.7% | 31.2% | 11.0% | 8.1% |
| 60 | Philadelphia, PA | 43.3% | 34.6% | 13.9% | 8.1% |
| 60 | Austin, TX | 47.6% | 33.9% | 10.3% | 8.1% |
| 63 | Chattanooga, TN | 46.0% | 30.5% | 15.5% | 8.0% |
| 63 | Raleigh, NC | 40.7% | 34.9% | 16.4% | 8.0% |
| 65 | Richmond, VA | 39.8% | 35.3% | 17.2% | 7.7% |
| 65 | Baltimore, MD | 46.3% | 32.9% | 13.2% | 7.7% |
| 67 | Columbia, SC | 44.0% | 37.5% | 11.1% | 7.5% |
| 68 | Indianapolis, IN | 48.6% | 33.3% | 10.7% | 7.4% |
| 69 | New Haven, CT | 40.1% | 37.2% | 15.5% | 7.3% |
| 69 | Bridgeport, CT | 50.4% | 29.3% | 12.9% | 7.3% |
| 69 | Milwaukee, WI | 42.5% | 37.0% | 13.3% | 7.3% |
| 72 | Durham, NC | 40.7% | 39.7% | 12.4% | 7.2% |
| 72 | Dallas, TX | 43.9% | 36.7% | 12.2% | 7.2% |
| 74 | Columbus, OH | 44.4% | 37.0% | 11.6% | 7.0% |
| 74 | Myrtle Beach, SC | 43.7% | 36.2% | 13.2% | 7.0% |
| 74 | Killeen, TX | 33.8% | 41.4% | 17.8% | 7.0% |
| 77 | Tulsa, OK | 50.0% | 33.6% | 9.6% | 6.9% |
| 78 | Hartford, CT | 49.9% | 31.9% | 11.4% | 6.8% |
| 79 | Augusta, GA | 45.2% | 32.0% | 16.4% | 6.4% |
| 79 | Kansas City, MO | 47.2% | 33.5% | 13.0% | 6.4% |
| 79 | Houston, TX | 52.2% | 31.0% | 10.4% | 6.4% |
| 82 | Grand Rapids, MI | 43.9% | 38.4% | 11.6% | 6.1% |
| 83 | St. Louis, MO | 49.3% | 33.5% | 11.3% | 5.9% |
| 84 | Akron, OH | 56.5% | 25.8% | 11.9% | 5.8% |
| 84 | New Orleans, LA | 51.5% | 33.0% | 9.8% | 5.8% |
| 84 | Des Moines, IA | 49.3% | 32.9% | 12.0% | 5.8% |
| 87 | Little Rock, AR | 56.4% | 28.0% | 10.0% | 5.7% |
| 88 | Springfield, MO | 43.9% | 38.9% | 11.7% | 5.6% |
| 89 | Chicago, IL | 50.8% | 33.8% | 9.9% | 5.5% |
| 90 | Wichita, KS | 54.5% | 29.1% | 11.1% | 5.3% |
| 91 | Pittsburgh, PA | 56.5% | 29.8% | 8.5% | 5.2% |
| 92 | Detroit, MI | 52.7% | 35.0% | 7.2% | 5.1% |
| 93 | Toledo, OH | 64.2% | 23.4% | 7.5% | 5.0% |
| 93 | Omaha, NE | 49.6% | 37.0% | 8.5% | 5.0% |
| 93 | Cleveland, OH | 57.1% | 28.7% | 9.3% | 5.0% |
| 93 | Fayetteville, AR | 48.8% | 29.8% | 16.5% | 5.0% |
| 97 | Cincinnati, OH | 51.8% | 33.9% | 9.7% | 4.6% |
| 98 | Birmingham, AL | 51.3% | 34.7% | 9.6% | 4.4% |
| 99 | Oklahoma City, OK | 51.6% | 31.8% | 12.7% | 4.0% |
| 100 | Huntsville, AL | 48.8% | 34.4% | 12.9% | 3.9% |
5 tips for determining how much of a new mortgage you can afford
Even though average monthly mortgage payments have dipped slightly, affordability remains a major challenge nationwide. Being realistic about what you can afford — both today and in the future — can help ensure that homeownership doesn’t become a financial burden. Here are five tips to help determine what fits comfortably within your budget:
- Boost your credit score before you buy. Your credit score plays a big role in the interest rate you’ll receive. The higher your score, the lower your potential rate — and the lower your monthly mortgage payment. While it’s possible to get approved with less-than-perfect credit, improving your score before applying could save you a significant amount over time.
- Shop around for lenders. Mortgage offers can vary widely from one lender to another. In fact, borrowers could save over $80,000 on average on a 30-year, fixed-rate loan by comparing lenders. “There can be a very real difference in offers among lenders, and you’re likely doing yourself and your family a disservice if you don’t at least take the time to compare rates,” Schulz says. “Even a small fraction of a percentage reduction in interest rates can mean tens of thousands of dollars over the life of a mortgage.”
- Consider making a larger down payment. Saving more up front can be challenging, but it’ll lower your loan amount and reduce your monthly payments. A larger down payment may also help you secure a better interest rate and avoid additional costs like private mortgage insurance.
- Run the numbers yourself. “It can be flattering for a lender to offer you a big mortgage loan,” Schulz says. “However, their saying that you can afford the loan doesn’t make it true.” Using a mortgage affordability calculator can help you get a clearer picture of what fits within your budget.
- Factor in all the costs of homeownership. Your mortgage payment is only part of the equation. “There’s much more to the cost of buying and owning a home than just the mortgage’s principal and interest,” Schulz cautions. Property taxes, homeowners insurance, private mortgage insurance and HOA fees can all increase your monthly costs. Ongoing maintenance and repairs should also be part of your budget. “If you don’t factor these costs in, you can potentially have a totally inaccurate view of what you can actually afford.”
Methodology
LendingTree analysts examined about 82,000 mortgage purchase inquiries made on the LendingTree platform between Jan. 1 and Dec. 31, 2025. For year-over-year comparisons, analysts reviewed approximately 36,000 inquiries from 2024 alongside the 2025 data. The analysis was limited to borrowers seeking 30-year, fixed-rate mortgages with credit scores of at least 620.
When borrowers received multiple offers, researchers selected the offer with the lowest APR for analysis. Monthly mortgage payments reflect principal and interest only and exclude taxes, insurance and other costs that may be associated with the loan. Income figures are self-reported by borrowers, and all loan terms reflect lender quotes rather than final or accepted loans.
Metro rankings reflect the 100 largest metros by 2025 borrower count. Generations are defined by borrower age at inquiry: Gen Zers (18 to 28), millennials (29 to 44), Gen Xers (45 to 60) and baby boomers (61 to 79).
Researchers calculated average new mortgage payments and compared them with borrowers’ reported incomes to determine payment burden. Results are shown as an average share of income and as the share of borrowers spending 30% or more, with additional breakout tiers of less than 20%, 20% to 29.99%, 30% to 39.99% and at least 40%.
View mortgage loan offers from up to 5 lenders in minutes