Homebuyer Down Payments by Generation in the 50 Largest US Metros


Gen Z mortgage shoppers in the nation’s 50 largest metros plan to put down far less than any other generation, according to an analysis of more than 130,000 mortgage purchase inquiries submitted through the LendingTree platform.
However, not all younger shoppers plan to put down less. Millennials join baby boomers, the oldest generation in our analysis, in planning to make the largest down payments of any age group across the nation’s largest metros. Planned down payments also vary widely by metro, with Gen Z shoppers in two locations planning to make six-figure down payments.
For this report, LendingTree researchers analyzed mortgage purchase inquiries submitted through the LendingTree platform between Jan. 1, 2025, and May 31, 2026, for fixed-rate conventional and Federal Housing Administration (FHA) loans across the nation’s 50 largest metros.
Here’s what we found.
LendingTree connects consumers with lenders offering a wide range of loan products, including mortgages. When prospective homebuyers visit our site, they can submit forms — referred to in this analysis as mortgage purchase inquiries — to compare mortgage offers and connect with lenders.
These inquiries aren’t formal loan applications. They’re preliminary forms that collect information about a shopper’s homebuying plans, including how much they hope to borrow, when they expect to buy, how they plan to use the property and where it’ll be located. The forms also ask shoppers how much they expect to contribute as a down payment. This report analyzes those self-reported amounts.
Because these amounts are reported before a loan is finalized, they shouldn’t be interpreted as the down payments borrowers ultimately make. Instead, they reflect shoppers’ expected down payments at the time they submit their inquiries.
This analysis should also not be considered representative of the U.S. housing market as a whole. For example, it excludes homebuyers who don’t finance their purchases with a mortgage.
- Across the nation’s 50 largest metros, Gen Z mortgage shoppers plan to put down a median of $41,250, the lowest of any generation analyzed and 25% below the overall median of $55,000. Millennials and baby boomers tie for the highest median planned down payment at $65,000, while Gen X shoppers plan to put down a median of $56,250.
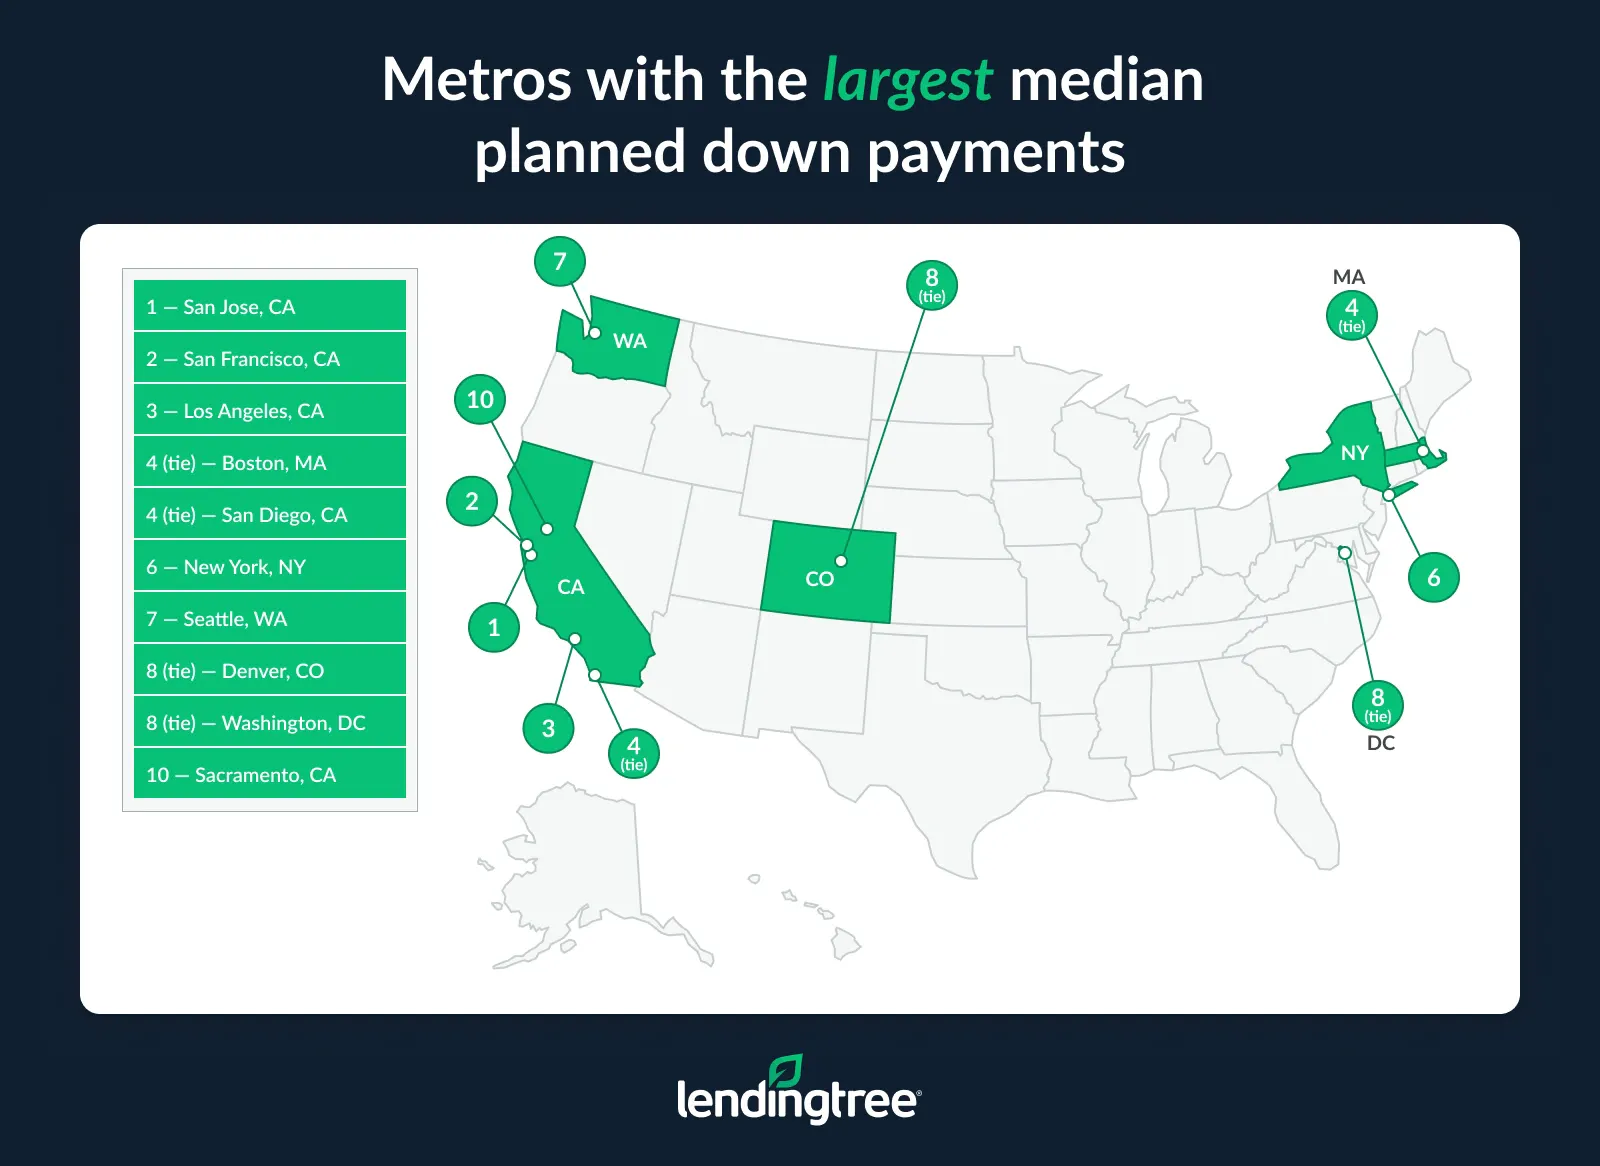
- California accounts for four of the five metros with the highest median planned down payments overall. San Jose leads at $190,000, with every generation reporting a median planned down payment of at least $115,000. San Francisco ($170,000), Los Angeles ($115,000) and San Diego ($101,250) also rank in the top five. Boston is the only metro outside California with a median planned down payment above $100,000, at $101,250.
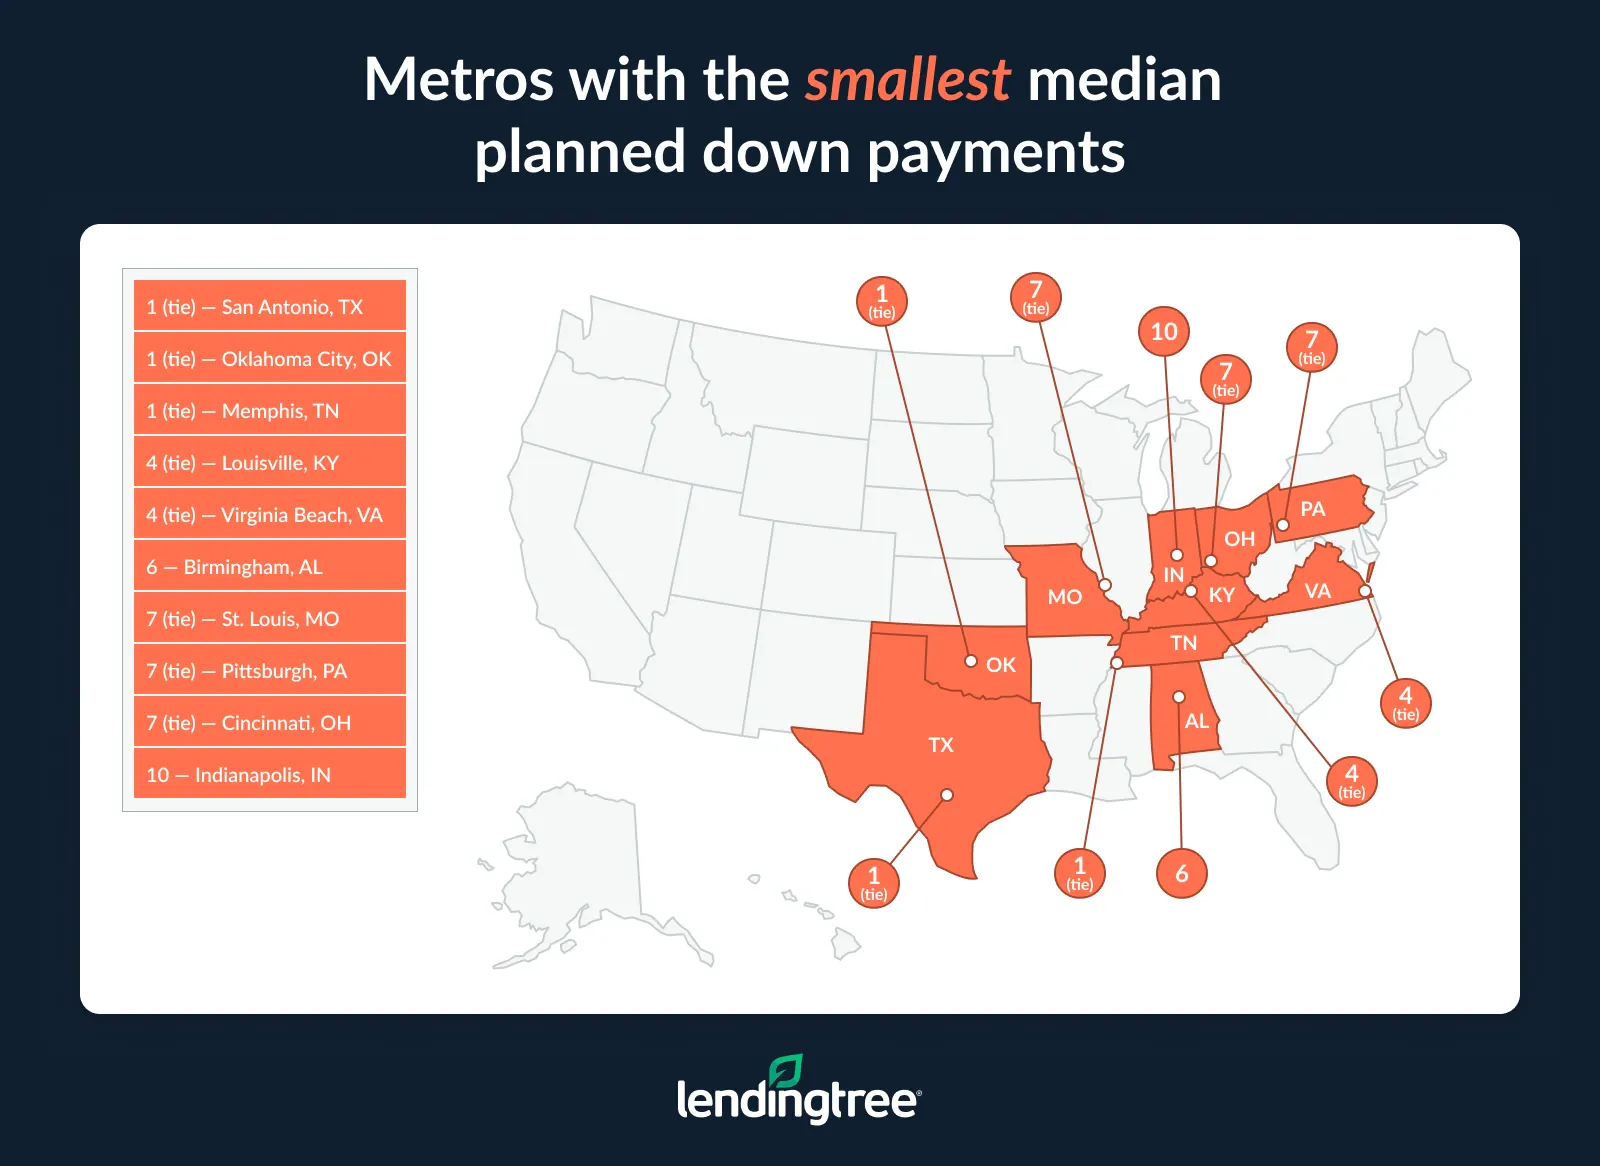
- Mortgage shoppers in San Antonio, Oklahoma City and Memphis, Tenn., report the lowest planned down payments. The median down payment in each metro is $33,750, and no generation in any of the three reports a median down payment of more than $45,000. Seven additional metros, including Louisville, Ky., and Virginia Beach, Va. (both at $36,250), have median planned down payments below $40,000.
- Baby boomers have the highest median planned down payment in 38 of the 50 largest metros, while Gen Z shoppers have the lowest in all 50. Boomers lead outright in 27 metros and tie with at least one generation in 11 more. However, the largest median down payments recorded by any generation belong to millennials: $250,000 in San Jose and $195,000 in San Francisco. That’s a far cry from the $23,750 median planned down payment among Gen Zers in Virginia Beach, Va.
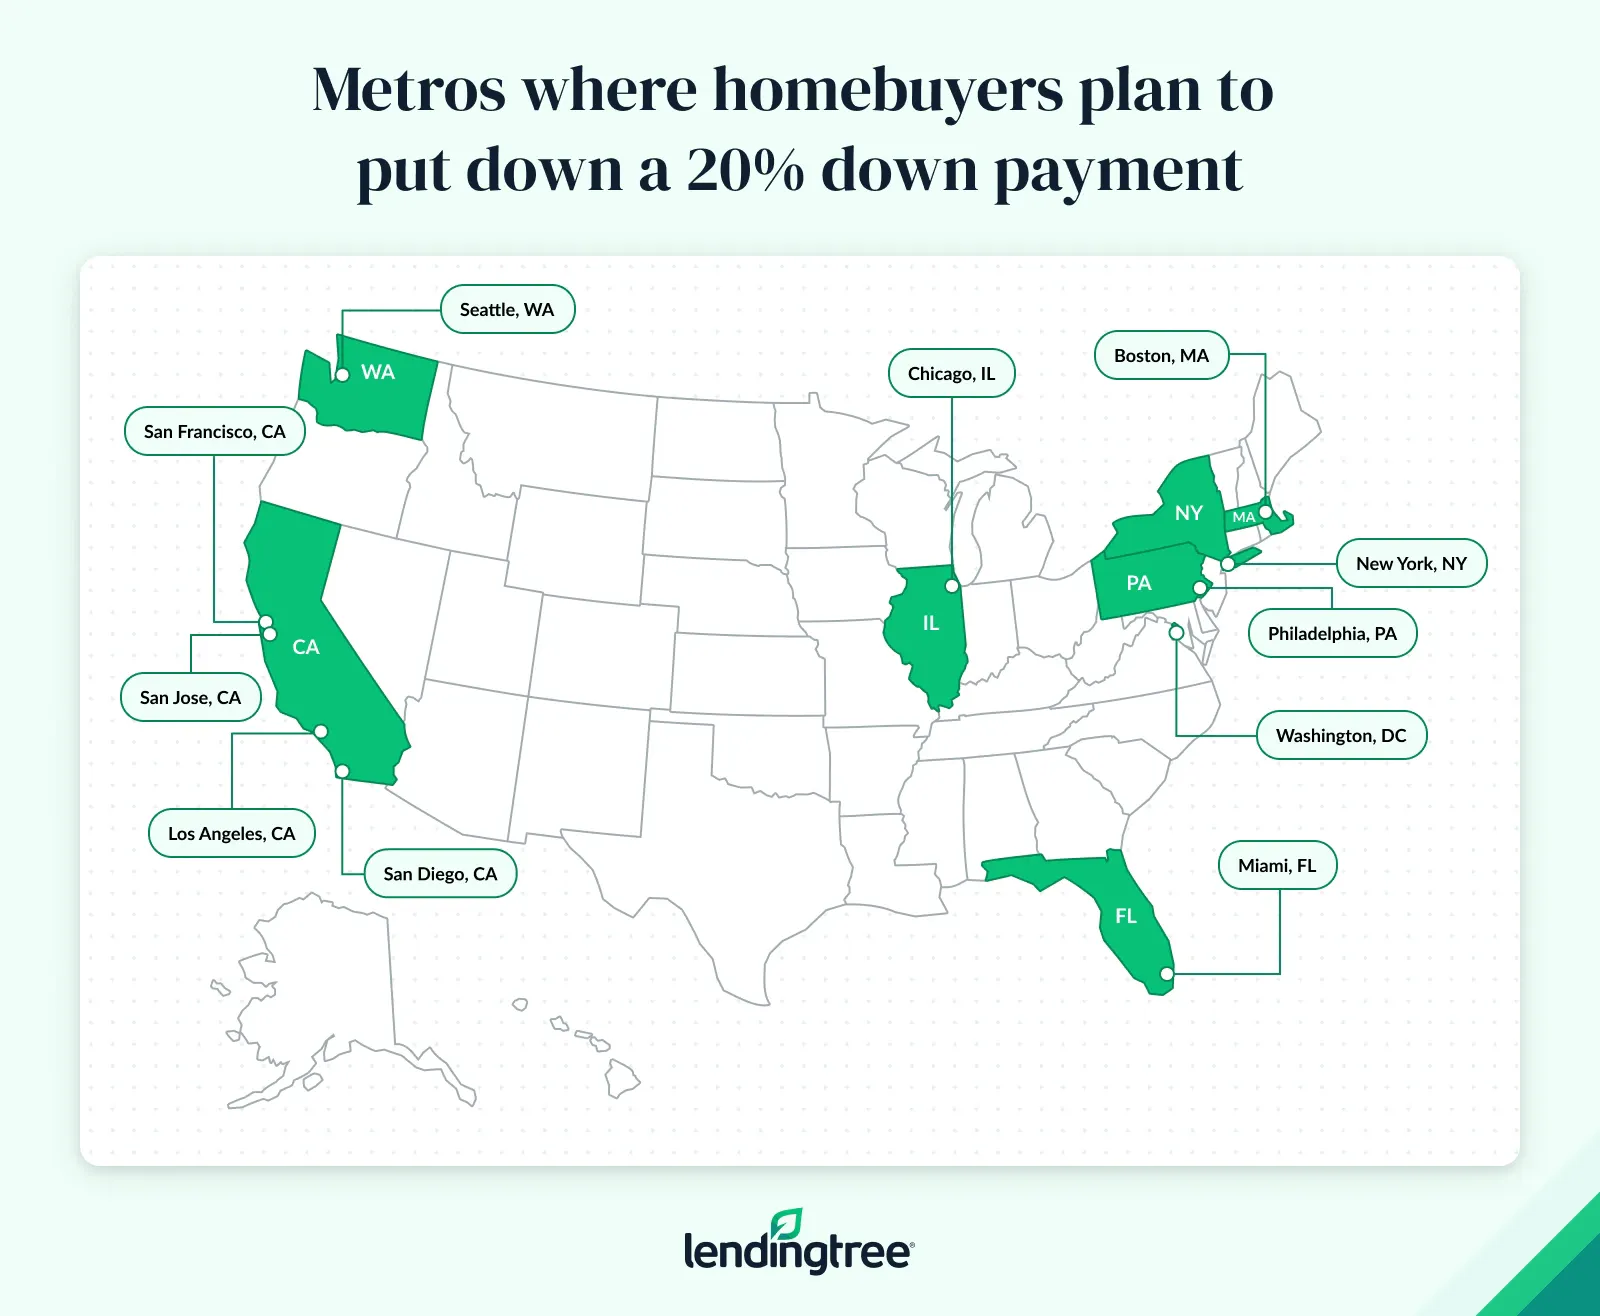
- The nation’s largest metros also tend to have the highest planned down payment percentages. New York, Los Angeles and Chicago — the nation’s three largest metros — are among 11 where the median planned down payment equals 20% of the purchase price. By comparison, eight metros, including San Antonio, Oklahoma City and Memphis, Tenn., have median planned down payments of 10%. The remaining 31 metros have median planned down payments of 15%.
Across the largest metros, Gen Z mortgage shoppers report the lowest median planned down payment
Millennials account for the largest share of mortgage purchase inquiries submitted through the LendingTree platform. Americans ages 29 to 44 made up 44.8% of the inquiries we analyzed across the nation’s 50 largest metros. That’s 20.5 percentage points higher than Gen X shoppers (ages 45 to 60), who accounted for 24.3% of inquiries, more than double Gen Z shoppers (ages 18 to 28), at 19.0%, and nearly four times the share of baby boomers (ages 61 to 79), at 11.8%.
Millennials aren’t just the most active generation on the platform. Along with baby boomers, they also report the largest planned down payments. Both generations have a median planned down payment of $65,000, while Gen X shoppers report a median of $56,250.
By comparison, Gen Z mortgage shoppers report a median planned down payment of $41,250. That’s the lowest of any generation and 25% below the overall median of $55,000.
The gap is consistent with broader financial differences across age groups. On average, Gen Z adults tend to have lower incomes, lower credit scores and less home equity than older generations, making saving for a down payment a Herculean task for many people that age. Even so, the inquiry data shows many Gen Z shoppers are preparing to buy homes despite those challenges.
Median planned down payments, by generation
| Generation | % of mortgage shoppers | Median planned down payment | Median down payment % |
|---|---|---|---|
| Gen Z | 19.0% | $41,250 | 10.0% |
| Millennial | 44.8% | $65,000 | 15.0% |
| Gen X | 24.3% | $56,250 | 20.0% |
| Baby boomer | 11.8% | $65,000 | 20.0% |
| Overall | 100.0% | $55,000 | 15.0% |
California leads the metros with the highest median planned down payments
Looking at individual metros, San Jose, Calif., ranks first with a median planned down payment of $190,000, followed by San Francisco at $170,000. These Northern California neighbors are the only ones in the analysis where every generation reports a median planned down payment above $100,000.
Los Angeles ($115,000) and San Diego ($101,250) rank third and fourth, giving California four of the top five metros. Boston is the only metro outside California with a median planned down payment above $100,000, at $101,250. New York ($95,000) and Seattle ($93,750) follow closely behind.
Mortgage shoppers in San Antonio, Oklahoma City and Memphis, Tenn., report the lowest planned down payments
Many of the nation’s largest metros look dramatically different from Silicon Valley. San Jose’s median planned down payment is more than five times the median in the lowest-ranking metros. In fact, the combined median planned down payments in San Antonio, Oklahoma City and Memphis, Tenn. (all at $33,750), plus Louisville, Ky., and Virginia Beach, Va. (both at $36,250) — the five metros with the lowest medians — total less than San Jose’s median planned down payment alone.
Overall, 10 metros have median planned down payments below $40,000. No generation in any of those metros reports a median planned down payment above $45,000.
Full rankings: Median planned down payments in the 50 largest metros
| Rank | Metro | Overall | Gen Zers | Millennials | Gen Xers | Baby boomers |
|---|---|---|---|---|---|---|
| 1 | San Jose, CA | $190,000 | $115,000 | $250,000 | $175,000 | $115,000 |
| 2 | San Francisco, CA | $170,000 | $105,000 | $195,000 | $125,000 | $175,000 |
| 3 | Los Angeles, CA | $115,000 | $92,500 | $125,000 | $115,000 | $132,500 |
| 4 | Boston, MA | $101,250 | $71,250 | $115,000 | $97,500 | $105,000 |
| 4 | San Diego, CA | $101,250 | $75,000 | $101,250 | $105,000 | $157,500 |
| 6 | New York, NY | $95,000 | $71,250 | $108,750 | $85,000 | $86,250 |
| 7 | Seattle, WA | $93,750 | $62,500 | $112,500 | $90,000 | $80,000 |
| 8 | Denver, CO | $75,000 | $52,500 | $77,500 | $76,250 | $105,000 |
| 8 | Washington, DC | $75,000 | $55,000 | $86,250 | $77,500 | $75,000 |
| 10 | Sacramento, CA | $67,500 | $52,500 | $65,000 | $72,500 | $105,000 |
| 11 | Miami, FL | $65,000 | $45,000 | $67,500 | $65,000 | $67,500 |
| 11 | Portland, OR | $65,000 | $47,500 | $67,500 | $65,000 | $85,000 |
| 11 | Salt Lake City, UT | $65,000 | $52,500 | $75,000 | $71,875 | $66,250 |
| 14 | Providence, RI | $63,750 | $57,500 | $65,000 | $57,500 | $67,500 |
| 15 | Raleigh, NC | $62,500 | $45,000 | $65,000 | $62,500 | $75,000 |
| 16 | Riverside, CA | $57,500 | $47,500 | $57,500 | $57,500 | $82,500 |
| 17 | Austin, TX | $56,250 | $45,000 | $65,000 | $57,500 | $78,750 |
| 17 | Las Vegas, NV | $56,250 | $41,250 | $52,500 | $62,500 | $75,000 |
| 17 | Nashville, TN | $56,250 | $45,000 | $65,000 | $72,500 | $65,000 |
| 20 | Phoenix, AZ | $55,000 | $41,250 | $56,250 | $63,750 | $85,000 |
| 20 | Charlotte, NC | $55,000 | $41,250 | $63,750 | $52,500 | $64,375 |
| 20 | Chicago, IL | $55,000 | $42,500 | $65,000 | $47,500 | $55,000 |
| 20 | Philadelphia, PA | $55,000 | $45,000 | $65,000 | $48,750 | $65,000 |
| 24 | Baltimore, MD | $52,500 | $37,500 | $57,500 | $56,250 | $56,250 |
| 24 | Orlando, FL | $52,500 | $37,500 | $50,625 | $55,000 | $65,000 |
| 26 | Atlanta, GA | $48,750 | $38,000 | $52,500 | $52,500 | $55,000 |
| 26 | Minneapolis, MN | $48,750 | $41,250 | $55,000 | $55,000 | $76,875 |
| 28 | Dallas, TX | $47,500 | $37,500 | $52,500 | $47,500 | $65,000 |
| 29 | Columbus, OH | $45,000 | $33,750 | $48,750 | $45,000 | $49,125 |
| 29 | Fresno, CA | $45,000 | $37,500 | $47,500 | $48,125 | $57,000 |
| 29 | Houston, TX | $45,000 | $32,500 | $45,000 | $45,000 | $55,000 |
| 29 | Jacksonville, FL | $45,000 | $32,500 | $45,000 | $45,000 | $57,000 |
| 29 | Milwaukee, WI | $45,000 | $37,500 | $48,750 | $55,000 | $55,625 |
| 29 | Richmond, VA | $45,000 | $33,750 | $48,750 | $47,500 | $55,000 |
| 29 | Tampa, FL | $45,000 | $37,500 | $47,500 | $46,250 | $47,500 |
| 36 | Detroit, MI | $42,500 | $33,750 | $45,000 | $45,000 | $45,000 |
| 36 | Grand Rapids, MI | $42,500 | $37,500 | $45,000 | $41,250 | $45,000 |
| 38 | Buffalo, NY | $41,250 | $32,500 | $41,250 | $48,750 | $45,000 |
| 38 | Cleveland, OH | $41,250 | $30,000 | $45,000 | $38,000 | $45,000 |
| 38 | Kansas City, MO | $41,250 | $32,500 | $42,500 | $42,500 | $55,000 |
| 41 | Indianapolis, IN | $39,000 | $27,500 | $45,000 | $42,500 | $45,000 |
| 42 | Cincinnati, OH | $38,000 | $32,500 | $45,000 | $38,000 | $45,000 |
| 42 | Pittsburgh, PA | $38,000 | $27,500 | $45,000 | $44,375 | $45,000 |
| 42 | St. Louis, MO | $38,000 | $32,500 | $42,500 | $45,000 | $45,000 |
| 45 | Birmingham, AL | $37,500 | $27,500 | $42,250 | $39,625 | $45,000 |
| 46 | Virginia Beach, VA | $36,250 | $23,750 | $37,500 | $37,500 | $45,000 |
| 46 | Louisville, KY | $36,250 | $27,500 | $45,000 | $37,750 | $45,000 |
| 48 | Memphis, TN | $33,750 | $27,500 | $41,250 | $32,500 | $38,000 |
| 48 | Oklahoma City, OK | $33,750 | $26,000 | $34,000 | $33,750 | $45,000 |
| 48 | San Antonio, TX | $33,750 | $27,500 | $37,500 | $32,500 | $45,000 |
Baby boomers have the highest planned down payment in 38 of the 50 largest metros
Our analysis revealed large differences in down payment plans among generations, even within metros.
For example, the median planned down payment among millennials in San Jose is $250,000, the highest median down payment of any generation in any of the largest metros. However, Gen Z and baby boomer mortgage shoppers plan to put down a relatively small $115,000, a difference of $135,000.
Generations are much closer together in Grand Rapids, Mich., where just $7,500 separates the highest and lowest median planned down payment by generation.
Boomers have the highest median planned down payments in 27 metros and share the top spot with one or more other generations in 11 more. Meanwhile, millennials have the highest in 10 metros and share the top spot in 10 others. That gap may be surprising, given that the two generations have the same median planned down payment nationally.
Gen Xers have the highest median planned down payment in Nashville, Tenn., and Buffalo, N.Y., and share the crown in St. Louis, Mo., and Detroit.
By contrast, Gen Zers have the lowest median planned down payment of any generation in all 50 metros (two of which are ties with another generation). Gen Zers’ $23,750 planned median down payment in Virginia Beach is the lowest of any generation in any of the 50 metros we analyzed. The gap between Gen Z’s median and the highest median is at least $40,000 in nine metros.
Full rankings: Metros with the largest differences in median planned down payments across generations
| Rank | Metro | Highest planned down payment by generation | Generation making highest planned down payment | Lowest planned down payment by generation | Generation making lowest planned down payment | Difference between highest/lowest planned down payment |
|---|---|---|---|---|---|---|
| 1 | San Jose, CA | $250,000 | Millennials | $115,000 | Gen Zers, baby boomers | $135,000 |
| 2 | San Francisco, CA | $195,000 | Millennials | $105,000 | Gen Zers | $90,000 |
| 3 | San Diego, CA | $157,500 | Baby boomers | $75,000 | Gen Zers | $82,500 |
| 4 | Denver, CO | $105,000 | Baby boomers | $52,500 | Gen Zers | $52,500 |
| 4 | Sacramento, CA | $105,000 | Baby boomers | $52,500 | Gen Zers | $52,500 |
| 6 | Seattle, WA | $112,500 | Millennials | $62,500 | Gen Zers | $50,000 |
| 7 | Boston, MA | $115,000 | Millennials | $71,250 | Gen Zers | $43,750 |
| 7 | Phoenix, AZ | $85,000 | Baby boomers | $41,250 | Gen Zers | $43,750 |
| 9 | Los Angeles, CA | $132,500 | Baby boomers | $92,500 | Gen Zers | $40,000 |
| 10 | New York, NY | $108,750 | Millennials | $71,250 | Gen Zers | $37,500 |
| 10 | Portland, OR | $85,000 | Baby boomers | $47,500 | Gen Zers | $37,500 |
| 12 | Minneapolis, MN | $76,875 | Baby boomers | $41,250 | Gen Zers | $35,625 |
| 13 | Riverside, CA | $82,500 | Baby boomers | $47,500 | Gen Zers | $35,000 |
| 14 | Austin, TX | $78,750 | Baby boomers | $45,000 | Gen Zers | $33,750 |
| 14 | Las Vegas, NV | $75,000 | Baby boomers | $41,250 | Gen Zers | $33,750 |
| 16 | Washington, DC | $86,250 | Millennials | $55,000 | Gen Zers | $31,250 |
| 17 | Raleigh, NC | $75,000 | Baby boomers | $45,000 | Gen Zers | $30,000 |
| 18 | Nashville, TN | $72,500 | Gen Xers | $45,000 | Gen Zers | $27,500 |
| 18 | Orlando, FL | $65,000 | Baby boomers | $37,500 | Gen Zers | $27,500 |
| 18 | Dallas, TX | $65,000 | Baby boomers | $37,500 | Gen Zers | $27,500 |
| 21 | Jacksonville, FL | $57,000 | Baby boomers | $32,500 | Gen Zers | $24,500 |
| 22 | Charlotte, NC | $64,375 | Baby boomers | $41,250 | Gen Zers | $23,125 |
| 23 | Miami, FL | $67,500 | Millennials, baby boomers | $45,000 | Gen Zers | $22,500 |
| 23 | Salt Lake City, UT | $75,000 | Millennials | $52,500 | Gen Zers | $22,500 |
| 23 | Chicago, IL | $65,000 | Millennials | $42,500 | Gen Zers | $22,500 |
| 23 | Houston, TX | $55,000 | Baby boomers | $32,500 | Gen Zers | $22,500 |
| 23 | Kansas City, MO | $55,000 | Baby boomers | $32,500 | Gen Zers | $22,500 |
| 28 | Richmond, VA | $55,000 | Baby boomers | $33,750 | Gen Zers | $21,250 |
| 28 | Virginia Beach, VA | $45,000 | Baby boomers | $23,750 | Gen Zers | $21,250 |
| 30 | Philadelphia, PA | $65,000 | Millennials, baby boomers | $45,000 | Gen Zers | $20,000 |
| 30 | Baltimore, MD | $57,500 | Millennials | $37,500 | Gen Zers | $20,000 |
| 32 | Fresno, CA | $57,000 | Baby boomers | $37,500 | Gen Zers | $19,500 |
| 33 | Oklahoma City, OK | $45,000 | Baby boomers | $26,000 | Gen Zers | $19,000 |
| 34 | Milwaukee, WI | $55,625 | Baby boomers | $37,500 | Gen Zers | $18,125 |
| 35 | Indianapolis, IN | $45,000 | Millennials, baby boomers | $27,500 | Gen Zers | $17,500 |
| 35 | Pittsburgh, PA | $45,000 | Millennials, baby boomers | $27,500 | Gen Zers | $17,500 |
| 35 | Birmingham, AL | $45,000 | Baby boomers | $27,500 | Gen Zers | $17,500 |
| 35 | Louisville, KY | $45,000 | Millennials, baby boomers | $27,500 | Gen Zers | $17,500 |
| 35 | San Antonio, TX | $45,000 | Baby boomers | $27,500 | Gen Zers | $17,500 |
| 40 | Atlanta, GA | $55,000 | Baby boomers | $38,000 | Gen Zers | $17,000 |
| 41 | Buffalo, NY | $48,750 | Gen Xers | $32,500 | Gen Zers | $16,250 |
| 42 | Columbus, OH | $49,125 | Baby boomers | $33,750 | Gen Zers | $15,375 |
| 43 | Cleveland, OH | $45,000 | Millennials, baby boomers | $30,000 | Gen Zers | $15,000 |
| 44 | Memphis, TN | $41,250 | Millennials | $27,500 | Gen Zers | $13,750 |
| 45 | Cincinnati, OH | $45,000 | Millennials, baby boomers | $32,500 | Gen Zers | $12,500 |
| 45 | St. Louis, MO | $45,000 | Gen Xers, baby boomers | $32,500 | Gen Zers | $12,500 |
| 47 | Detroit, MI | $45,000 | Millennials, Gen Xers, baby boomers | $33,750 | Gen Zers | $11,250 |
| 48 | Providence, RI | $67,500 | Baby boomers | $57,500 | Gen Zers, Gen Xers | $10,000 |
| 48 | Tampa, FL | $47,500 | Millennials, baby boomers | $37,500 | Gen Zers | $10,000 |
| 50 | Grand Rapids, MI | $45,000 | Millennials, baby boomers | $37,500 | Gen Zers | $7,500 |
The nation’s largest metros tend to have the highest planned down payment percentages
The dollar amount of a down payment is only part of the equation. The down payment’s share of the home’s purchase price also matters because a large percentage can reduce the loan balance, lower the total interest paid over the life of the mortgage and help borrowers avoid private mortgage insurance (PMI).
Median planned down payment percentages vary considerably among the nation’s largest metros. New York, Los Angeles and Chicago — the nation’s three largest metros — are among 11 where the median planned down payment equals 20% of the purchase price. That’s the threshold at which conventional borrowers can generally avoid paying PMI.
At the other end of the spectrum, eight metros, including San Antonio, Oklahoma City and Memphis, have median planned down payment percentages of just 10%. The remaining 31 metros have median planned down payment percentages of 15%.
Full rankings: Median planned down payment percentages in the 50 largest metros
| Rank | Metro | Overall | Gen Zers | Millennials | Gen Xers | Baby boomers |
|---|---|---|---|---|---|---|
| 1 | New York, NY | 20.0% | 15.0% | 20.0% | 20.0% | 20.0% |
| 1 | Los Angeles, CA | 20.0% | 15.0% | 20.0% | 20.0% | 20.0% |
| 1 | Chicago, IL | 20.0% | 15.0% | 20.0% | 20.0% | 20.0% |
| 1 | Washington, DC | 20.0% | 15.0% | 15.0% | 20.0% | 20.0% |
| 1 | Philadelphia, PA | 20.0% | 15.0% | 20.0% | 20.0% | 20.0% |
| 1 | Miami, FL | 20.0% | 10.0% | 15.0% | 20.0% | 20.0% |
| 1 | Boston, MA | 20.0% | 15.0% | 20.0% | 20.0% | 20.0% |
| 1 | San Francisco, CA | 20.0% | 20.0% | 20.0% | 20.0% | 20.0% |
| 1 | Seattle, WA | 20.0% | 10.0% | 20.0% | 20.0% | 20.0% |
| 1 | San Diego, CA | 20.0% | 15.0% | 20.0% | 20.0% | 20.0% |
| 1 | San Jose, CA | 20.0% | 20.0% | 20.0% | 20.0% | 20.0% |
| 12 | Dallas, TX | 15.0% | 10.0% | 15.0% | 15.0% | 20.0% |
| 12 | Houston, TX | 15.0% | 10.0% | 15.0% | 15.0% | 20.0% |
| 12 | Atlanta, GA | 15.0% | 10.0% | 15.0% | 15.0% | 20.0% |
| 12 | Phoenix, AZ | 15.0% | 10.0% | 10.0% | 20.0% | 20.0% |
| 12 | Riverside, CA | 15.0% | 10.0% | 10.0% | 15.0% | 20.0% |
| 12 | Detroit, MI | 15.0% | 15.0% | 15.0% | 20.0% | 20.0% |
| 12 | Minneapolis, MN | 15.0% | 10.0% | 15.0% | 20.0% | 20.0% |
| 12 | Tampa, FL | 15.0% | 10.0% | 15.0% | 15.0% | 20.0% |
| 12 | Denver, CO | 15.0% | 10.0% | 15.0% | 20.0% | 20.0% |
| 12 | Baltimore, MD | 15.0% | 10.0% | 15.0% | 20.0% | 20.0% |
| 12 | St. Louis, MO | 15.0% | 10.0% | 15.0% | 15.0% | 20.0% |
| 12 | Orlando, FL | 15.0% | 10.0% | 15.0% | 20.0% | 20.0% |
| 12 | Charlotte, NC | 15.0% | 10.0% | 15.0% | 15.0% | 20.0% |
| 12 | Portland, OR | 15.0% | 10.0% | 15.0% | 15.0% | 20.0% |
| 12 | Pittsburgh, PA | 15.0% | 10.0% | 15.0% | 20.0% | 20.0% |
| 12 | Austin, TX | 15.0% | 10.0% | 15.0% | 20.0% | 20.0% |
| 12 | Sacramento, CA | 15.0% | 10.0% | 15.0% | 20.0% | 20.0% |
| 12 | Las Vegas, NV | 15.0% | 10.0% | 10.0% | 15.0% | 20.0% |
| 12 | Cincinnati, OH | 15.0% | 10.0% | 15.0% | 15.0% | 20.0% |
| 12 | Columbus, OH | 15.0% | 10.0% | 15.0% | 15.0% | 20.0% |
| 12 | Cleveland, OH | 15.0% | 10.0% | 15.0% | 15.0% | 20.0% |
| 12 | Indianapolis, IN | 15.0% | 10.0% | 15.0% | 15.0% | 20.0% |
| 12 | Nashville, TN | 15.0% | 10.0% | 15.0% | 20.0% | 20.0% |
| 12 | Providence, RI | 15.0% | 15.0% | 15.0% | 15.0% | 20.0% |
| 12 | Jacksonville, FL | 15.0% | 10.0% | 12.5% | 15.0% | 20.0% |
| 12 | Milwaukee, WI | 15.0% | 10.0% | 15.0% | 20.0% | 20.0% |
| 12 | Raleigh, NC | 15.0% | 15.0% | 15.0% | 20.0% | 20.0% |
| 12 | Richmond, VA | 15.0% | 10.0% | 15.0% | 20.0% | 20.0% |
| 12 | Salt Lake City, UT | 15.0% | 15.0% | 15.0% | 20.0% | 20.0% |
| 12 | Grand Rapids, MI | 15.0% | 15.0% | 15.0% | 10.0% | 20.0% |
| 12 | Buffalo, NY | 15.0% | 10.0% | 15.0% | 20.0% | 20.0% |
| 43 | San Antonio, TX | 10.0% | 10.0% | 10.0% | 10.0% | 20.0% |
| 43 | Kansas City, MO | 10.0% | 10.0% | 10.0% | 15.0% | 20.0% |
| 43 | Virginia Beach, VA | 10.0% | 10.0% | 10.0% | 10.0% | 20.0% |
| 43 | Oklahoma City, OK | 10.0% | 10.0% | 10.0% | 10.0% | 20.0% |
| 43 | Louisville, KY | 10.0% | 10.0% | 15.0% | 14.9% | 20.0% |
| 43 | Memphis, TN | 10.0% | 10.0% | 10.0% | 10.0% | 15.0% |
| 43 | Birmingham, AL | 10.0% | 10.0% | 10.0% | 15.0% | 20.0% |
| 43 | Fresno, CA | 10.0% | 10.0% | 10.0% | 15.0% | 20.0% |
What mortgage shoppers should do before choosing a down payment
Whether you plan to put down 10%, 20% or something in between, the right down payment is the one that aligns with your budget, homebuying timeline and long-term financial goals.
Before you start house hunting, consider these steps:
- Compare loan options early. A conventional 30-year, fixed-rate mortgage isn’t the only path to homeownership. FHA, Veterans Affairs (VA) and U.S. Department of Agriculture (USDA) loans, among other programs, may allow qualified borrowers to buy with a smaller down payment.
- Don’t deplete your savings to increase your down payment. A larger down payment can help you reduce your monthly payment and help you avoid PMI, but you’ll also need funds for closing costs, moving expenses, repairs and unexpected expenses.
- See whether you qualify for down payment assistance. It’s OK to seek help. State and local programs may offer grants, forgivable loans or low-interest second mortgages that reduce the amount of cash you need up front.
- Compare offers with multiple lenders. Interest rates, fees and down payment requirements can vary significantly. Comparing mortgage offers can help you find one that better fits your budget, and the savings over the life of the loan can be substantial. With sites like LendingTree, it’s never been easier to compare offers, so be sure to do your homework.
- Focus on the total monthly housing cost, not just the down payment. Your mortgage payment may include principal, interest, property taxes, homeowners insurance, PMI and homeowners association fees. Make sure the total fits comfortably within your budget before committing.
Methodology
LendingTree researchers analyzed more than 130,000 mortgage purchase inquiries submitted through the LendingTree platform between Jan. 1, 2025, and May 31, 2026, for fixed-rate conventional and Federal Housing Administration (FHA) loans.
Researchers calculated median down payments for each of the nation’s 50 largest metros and each of four generations, using one record per mortgage shopper. Median down-payment percentages were calculated by dividing the down payment by the estimated home value, with estimated home values calculated as the requested loan amount plus the down payment.
The generations included in this analysis are:
- Generation Z (born after 1996; ages 18 to 28 in 2025)
- Millennials (1981 to 1996; ages 29 to 44 in 2025)
- Generation X (1965 to 1980; ages 45 to 60 in 2025)
- Baby boomers (1946 to 1964; ages 61 to 79 in 2025)
View mortgage loan offers from up to 5 lenders in minutes