Nearly 1 in 4 Gen Z Adults Moved to Another State in 2024


Nearly 11 million Gen Z adults in the U.S. — about 1 in 4 — moved to another state or the District of Columbia in 2024.
LendingTree’s analysis of U.S. Census Bureau data found that 23.9% of Gen Z adults moved across state lines in 2024 — the most recent year for which data were available. That’s a far higher share than for any other age group. South Carolina led the nation with a net gain of 22,843 Gen Zers in 2024, while California had the largest net loss.
Here’s more of what we found.
Gen Z generally includes those born from 1997 to 2012, meaning some Gen Zers were as young as 12 in 2024. However, our report focuses only on the interstate migration of Gen Z adults in the U.S. It doesn’t include data on Gen Zers who hadn’t yet turned 18 in 2024.
- Nearly 1 in 4 Gen Z adults moved across state lines in 2024. An estimated 10.7 million of 44.6 million Gen Z adults in the U.S. — or 23.9% — moved to another state or the District of Columbia in 2024. That’s a far higher share than for any other age group, with millennials the closest at 14.0%, followed by Gen Xers (7.2%) and baby boomers (5.2%). Of Gen Zers who moved, 38.1% were in college in 2024.
- South Carolina had the largest net gain in Gen Z adults. We estimate that 60,223 Gen Z adults moved into the Palmetto State and 37,380 moved out, leaving a net gain of 22,843. Missouri (14,063) led a group of six other states that had net gains of at least 10,000 Gen Z adults.
- California had the largest net loss of Gen Z adults. The Golden State had a net loss of 58,109 Gen Z adults in 2024. New Jersey (37,556) and Illinois (20,031) were a distant second and third. The most popular destination for Gen Z Californians was Texas. We estimate that 19,287 Gen Z adults moved from California to Texas.
- Net interstate migration made up 12.3% of the District of Columbia’s Gen Z adult population in 2024 — the nation’s largest net gain by percentage. D.C. had a net gain of 13,905 Gen Z adult residents. That 12.3% share was more than double the percentage in any state. After the nation’s capital, North Dakota (5.4%) and Vermont (3.8%) ranked second and third.
Nearly 1 in 4 Gen Z adults moved across state lines in 2024
Your teens and 20s are traditionally a period of great change, and that’s clearly true for today’s Gen Zers, the oldest of whom was 27 in 2024 — the year this report covers. Our analysis found that for many Gen Zers, that change included moving across state lines.
There were 44.6 million Gen Z adults in the U.S. in 2024. An estimated 10.7 million of them moved to another state or the District of Columbia that year. That’s slightly more than the 10.4 million millennials ages 28 to 43 who did the same. However, as a share of each age group, the difference is stark: 23.9% of Gen Z adults moved across state lines in 2024, compared with 14.0% of millennials, 7.2% of Gen Xers ages 44 to 59 and 5.2% of baby boomers ages 60 to 78.
Percentage of Americans who moved across state lines, by generation
| Overall | Gen Zers | Millennials | Gen Xers | Baby boomers | |
|---|---|---|---|---|---|
| Population | 207,058,964 | 44,644,605 | 74,392,734 | 65,252,766 | 67,413,464 |
| Interstate movers | 18,608,210 | 10,673,613 | 10,417,775 | 4,700,461 | 3,489,974 |
| Percentage | 9.0% | 23.9% | 14.0% | 7.2% | 5.2% |
One major driver of this movement was higher education. Of the Gen Zers who moved across state lines in 2024, nearly 4 in 10 (38.1%) attended college that year.
South Carolina had the largest net gain in Gen Z adults
Interstate migration patterns varied widely by state. Thirty-one states and the District of Columbia had more Gen Zers move in than out. South Carolina led the way. An estimated 60,223 Gen Z adults moved into the Palmetto State, while 37,380 moved out, for a net gain of 22,843.
Five other states and the District of Columbia had net gains of at least 10,000 Gen Z adults, led by Missouri (14,063).
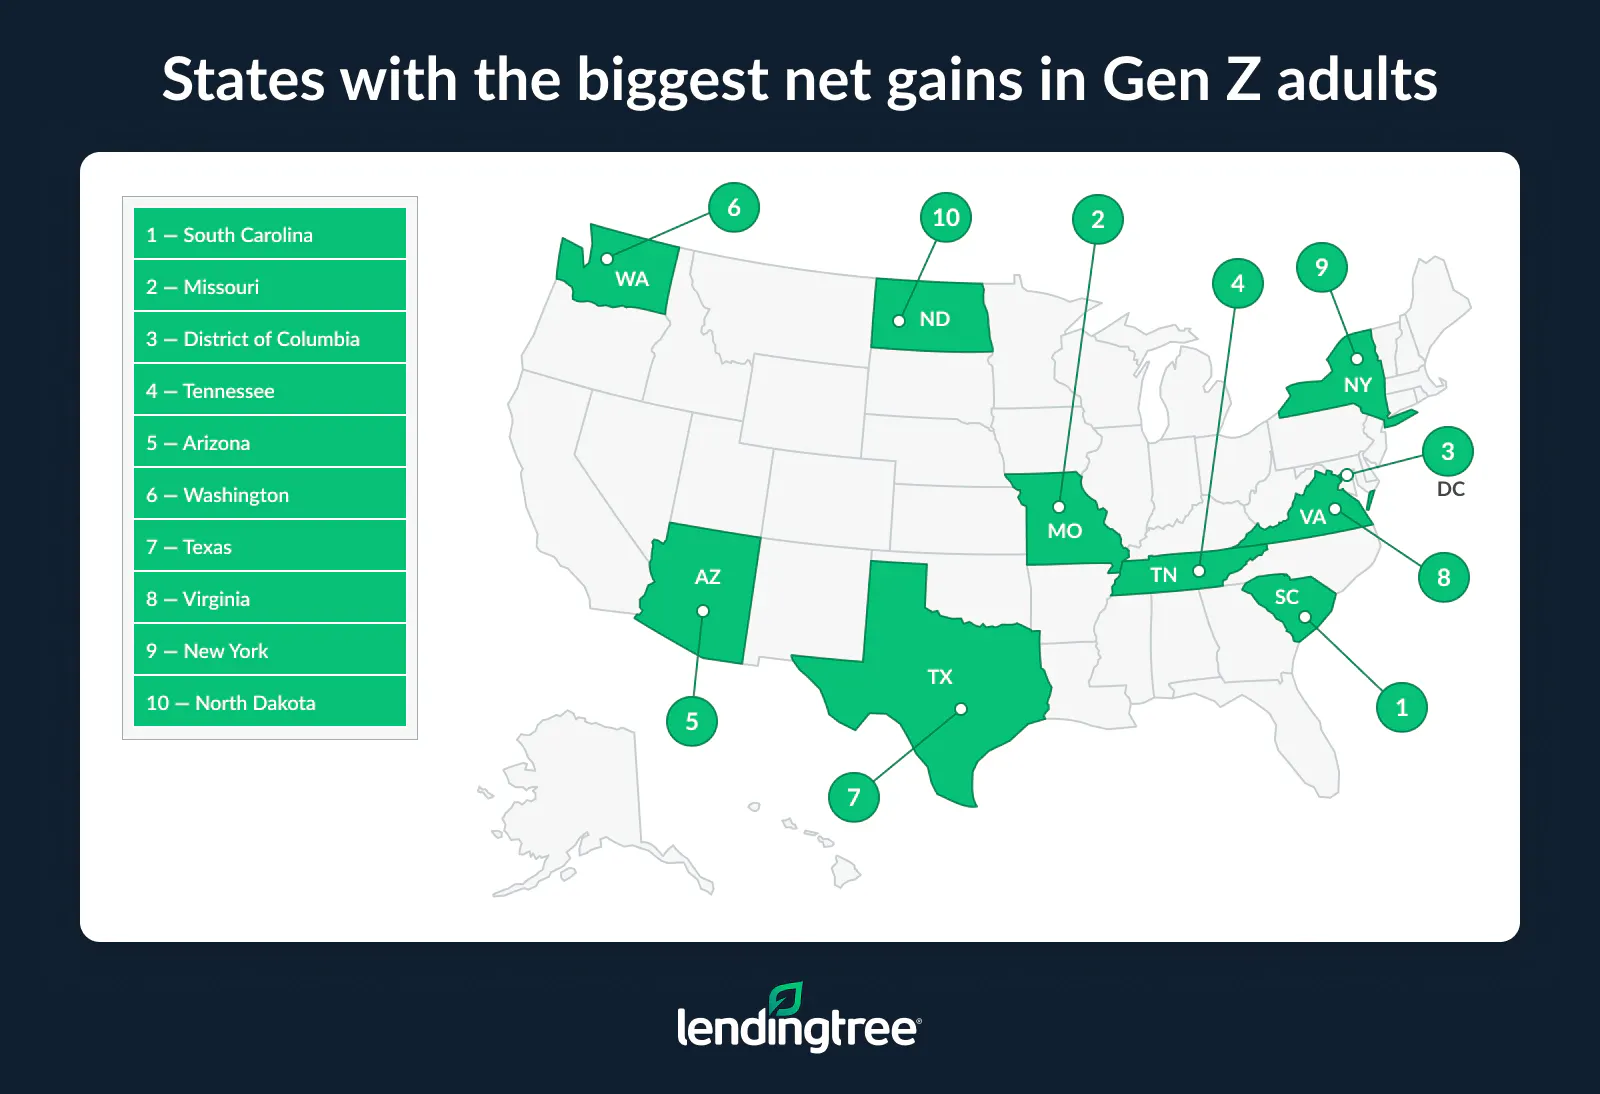
The states with the largest net gains were scattered across the country, ranging from South Carolina to Washington and from North Dakota to Texas. The Lone Star State had the largest net gain among the nation’s most populous states at 10,720, though New York wasn’t far behind at 8,061. The picture was far different in California, the nation’s most populous state.
California had the largest net loss of Gen Z adults
The Golden State had a net loss of 58,109 Gen Z adults in 2024. An estimated 128,718 Gen Zers moved into California, second only to Texas nationally. However, 186,827 Gen Zers moved out, by far the most from any state.
Four other states had net losses of at least 10,000 Gen Z adults, led by New Jersey (37,556) and Illinois (20,031).
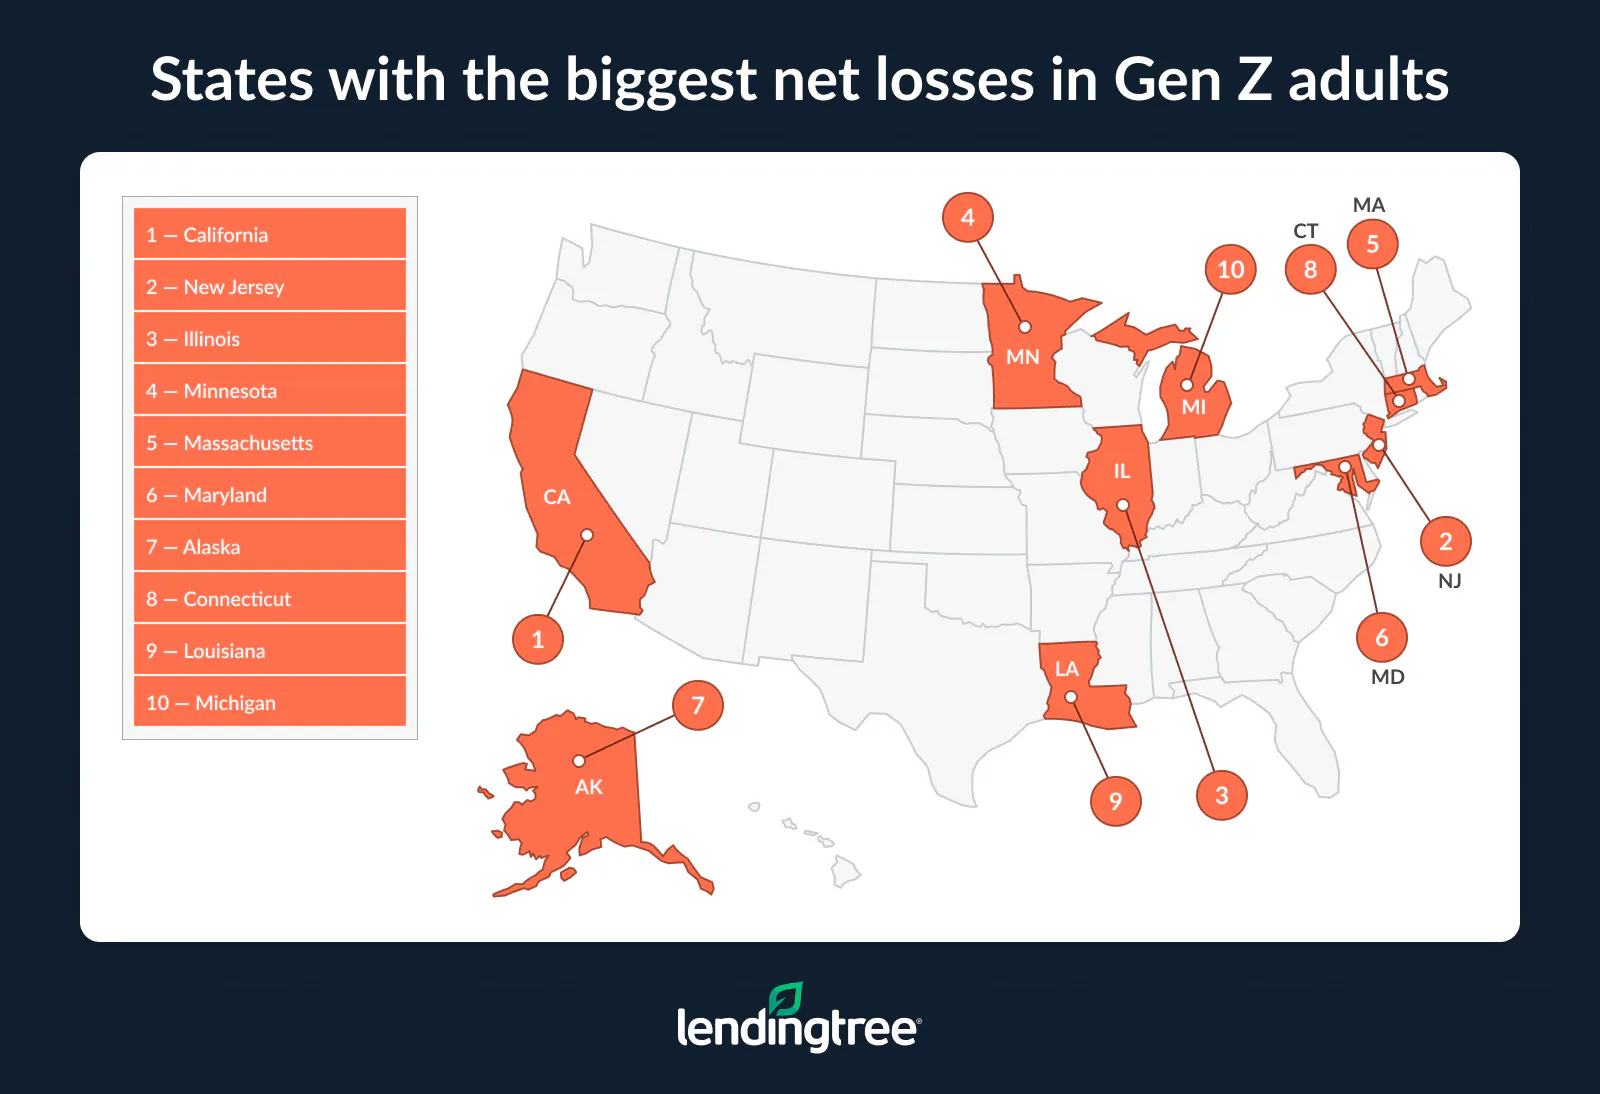
States with the largest net gains/losses in Gen Z adults
| Rank | State | Gen Z moved in | Gen Z moved out | Net gain/loss |
|---|---|---|---|---|
| 1 | South Carolina | 60,223 | 37,380 | 22,843 |
| 2 | Missouri | 52,312 | 38,249 | 14,063 |
| 3 | District of Columbia | 29,198 | 15,293 | 13,905 |
| 4 | Tennessee | 56,701 | 43,164 | 13,537 |
| 5 | Arizona | 63,968 | 51,375 | 12,593 |
| 6 | Washington | 68,344 | 56,563 | 11,781 |
| 7 | Texas | 157,869 | 147,149 | 10,720 |
| 8 | Virginia | 85,477 | 75,803 | 9,674 |
| 9 | New York | 125,429 | 117,368 | 8,061 |
| 10 | North Dakota | 14,149 | 7,467 | 6,682 |
| 11 | Ohio | 63,770 | 58,007 | 5,763 |
| 12 | Rhode Island | 15,771 | 10,096 | 5,675 |
| 13 | West Virginia | 15,435 | 9,769 | 5,666 |
| 14 | Oklahoma | 30,797 | 25,847 | 4,950 |
| 15 | Nevada | 26,546 | 21,634 | 4,912 |
| 16 | Kentucky | 25,859 | 21,221 | 4,638 |
| 17 | North Carolina | 81,749 | 77,269 | 4,480 |
| 18 | Hawaii | 18,448 | 14,710 | 3,738 |
| 19 | Alabama | 34,345 | 31,023 | 3,322 |
| 20 | Arkansas | 20,565 | 17,254 | 3,311 |
| 21 | Idaho | 23,968 | 20,805 | 3,163 |
| 22 | Vermont | 10,507 | 7,391 | 3,116 |
| 23 | New Mexico | 16,184 | 13,202 | 2,982 |
| 24 | Nebraska | 19,167 | 16,455 | 2,712 |
| 25 | Wisconsin | 44,672 | 42,099 | 2,573 |
| 26 | Pennsylvania | 84,499 | 81,971 | 2,528 |
| 27 | Utah | 37,091 | 34,785 | 2,306 |
| 28 | Iowa | 25,167 | 23,809 | 1,358 |
| 29 | Oregon | 32,917 | 31,576 | 1,341 |
| 30 | Wyoming | 7,727 | 6,528 | 1,199 |
| 31 | Mississippi | 17,789 | 16,865 | 924 |
| 32 | Montana | 13,984 | 13,676 | 308 |
| 33 | New Hampshire | 14,481 | 14,915 | -434 |
| 34 | Georgia | 63,339 | 63,827 | -488 |
| 35 | Florida | 116,345 | 118,030 | -1,685 |
| 36 | South Dakota | 8,187 | 10,579 | -2,392 |
| 37 | Maine | 9,438 | 12,012 | -2,574 |
| 38 | Colorado | 61,576 | 65,007 | -3,431 |
| 39 | Delaware | 7,364 | 11,402 | -4,038 |
| 40 | Indiana | 45,526 | 49,873 | -4,347 |
| 41 | Kansas | 27,889 | 32,751 | -4,862 |
| 42 | Michigan | 42,392 | 47,667 | -5,275 |
| 43 | Louisiana | 19,387 | 24,726 | -5,339 |
| 44 | Connecticut | 27,203 | 33,264 | -6,061 |
| 45 | Alaska | 7,615 | 13,684 | -6,069 |
| 46 | Maryland | 48,673 | 56,941 | -8,268 |
| 47 | Massachusetts | 61,079 | 71,117 | -10,038 |
| 48 | Minnesota | 33,195 | 47,022 | -13,827 |
| 49 | Illinois | 83,930 | 103,961 | -20,031 |
| 50 | New Jersey | 36,422 | 73,978 | -37,556 |
| 51 | California | 128,718 | 186,827 | -58,109 |
We also examined where Gen Zers moved. Some of the largest flows were between the two most populous states: California and Texas. We estimate that 19,287 Gen Z adults moved from California to Texas, while 13,362 moved from Texas to California. That’s a net gain for Texas of 5,925 Gen Z adults — and an equivalent net loss for California.
There was also substantial movement between neighboring states, such as New York and New Jersey, North Carolina and South Carolina, and Florida and Georgia. The table below shows the most common states Gen Z adults moved to and from in each state.
Most popular states for Gen Z adults to move to and from in 2024, by state
| State | State most commonly moved to | Gen Z adults who moved there | State most commonly moved from | Gen Z adults who moved from there |
|---|---|---|---|---|
| Alabama | Tennessee | 3,616 | Georgia | 3,904 |
| Alaska | Utah | 1,975 | Washington | 937 |
| Arizona | California | 7,537 | California | 11,833 |
| Arkansas | Texas | 2,830 | Texas | 5,456 |
| California | Texas | 19,287 | Texas | 13,362 |
| Colorado | Texas | 9,276 | Texas | 8,568 |
| Connecticut | New York | 8,664 | New York | 5,014 |
| Delaware | Pennsylvania | 3,303 | Pennsylvania | 1,846 |
| District of Columbia | Maryland | 3,763 | Virginia | 3,416 |
| Florida | Georgia | 10,690 | Georgia | 10,740 |
| Georgia | Florida | 10,740 | Florida | 10,690 |
| Hawaii | California | 2,833 | California | 3,231 |
| Idaho | Washington | 3,902 | California | 3,743 |
| Illinois | Indiana | 9,182 | Michigan | 6,081 |
| Indiana | Ohio | 5,486 | Illinois | 9,182 |
| Iowa | Illinois | 2,774 | Illinois | 6,770 |
| Kansas | Missouri | 7,732 | Missouri | 6,882 |
| Kentucky | Ohio | 2,916 | Ohio | 4,538 |
| Louisiana | Texas | 5,511 | Texas | 5,720 |
| Maine | Massachusetts | 3,293 | Massachusetts | 2,680 |
| Maryland | Virginia | 8,464 | Virginia | 6,805 |
| Massachusetts | New York | 10,453 | New York | 8,712 |
| Michigan | Ohio | 6,937 | Illinois | 6,434 |
| Minnesota | Wisconsin | 10,869 | Wisconsin | 9,972 |
| Mississippi | Texas | 2,591 | Louisiana | 3,284 |
| Missouri | Kansas | 6,882 | Illinois | 8,003 |
| Montana | Washington | 2,950 | Washington | 2,512 |
| Nebraska | Texas | 2,052 | Iowa | 2,603 |
| Nevada | California | 4,686 | California | 11,394 |
| New Hampshire | Massachusetts | 5,426 | Massachusetts | 5,189 |
| New Jersey | Pennsylvania | 16,167 | New York | 12,946 |
| New Mexico | Texas | 2,447 | Texas | 5,143 |
| New York | New Jersey | 12,946 | New Jersey | 14,140 |
| North Carolina | South Carolina | 9,374 | Florida | 8,070 |
| North Dakota | Minnesota | 1,500 | Minnesota | 5,694 |
| Ohio | Indiana | 5,379 | Michigan | 6,937 |
| Oklahoma | Texas | 6,194 | Texas | 8,281 |
| Oregon | Washington | 7,129 | California | 8,916 |
| Pennsylvania | New York | 11,814 | New Jersey | 16,167 |
| Rhode Island | Massachusetts | 5,477 | Massachusetts | 4,815 |
| South Carolina | North Carolina | 7,251 | North Carolina | 9,374 |
| South Dakota | Nebraska | 1,357 | Minnesota | 2,104 |
| Tennessee | Kentucky | 4,465 | California | 6,379 |
| Texas | California | 13,362 | California | 19,287 |
| Utah | Arizona | 4,010 | Arizona | 4,976 |
| Vermont | New York | 1,611 | Massachusetts | 2,311 |
| Virginia | North Carolina | 8,039 | Maryland | 8,464 |
| Washington | California | 6,728 | California | 13,135 |
| West Virginia | Ohio | 1,270 | Pennsylvania | 3,485 |
| Wisconsin | Minnesota | 9,972 | Minnesota | 10,869 |
| Wyoming | Montana | 992 | Colorado | 2,840 |
The District of Columbia had the largest net gain by percentage of Gen Z adults
The nation’s capital had a net gain of 13,905 Gen Z adults in 2024 due to interstate migration. That’s the third-largest gain in the nation that year, trailing only South Carolina (22,843) and Missouri (14,063). However, when net migration is measured as a share of the Gen Z adult population, the District of Columbia stands well above the rest of the nation.
Net interstate migration represented 12.3% of D.C.’s Gen Z adult population in 2024, more than double the percentage in any state. North Dakota (5.4%) and Vermont (3.8%) ranked a distant second and third. South Carolina (3.3%) ranked fifth and Missouri eighth (1.7%).
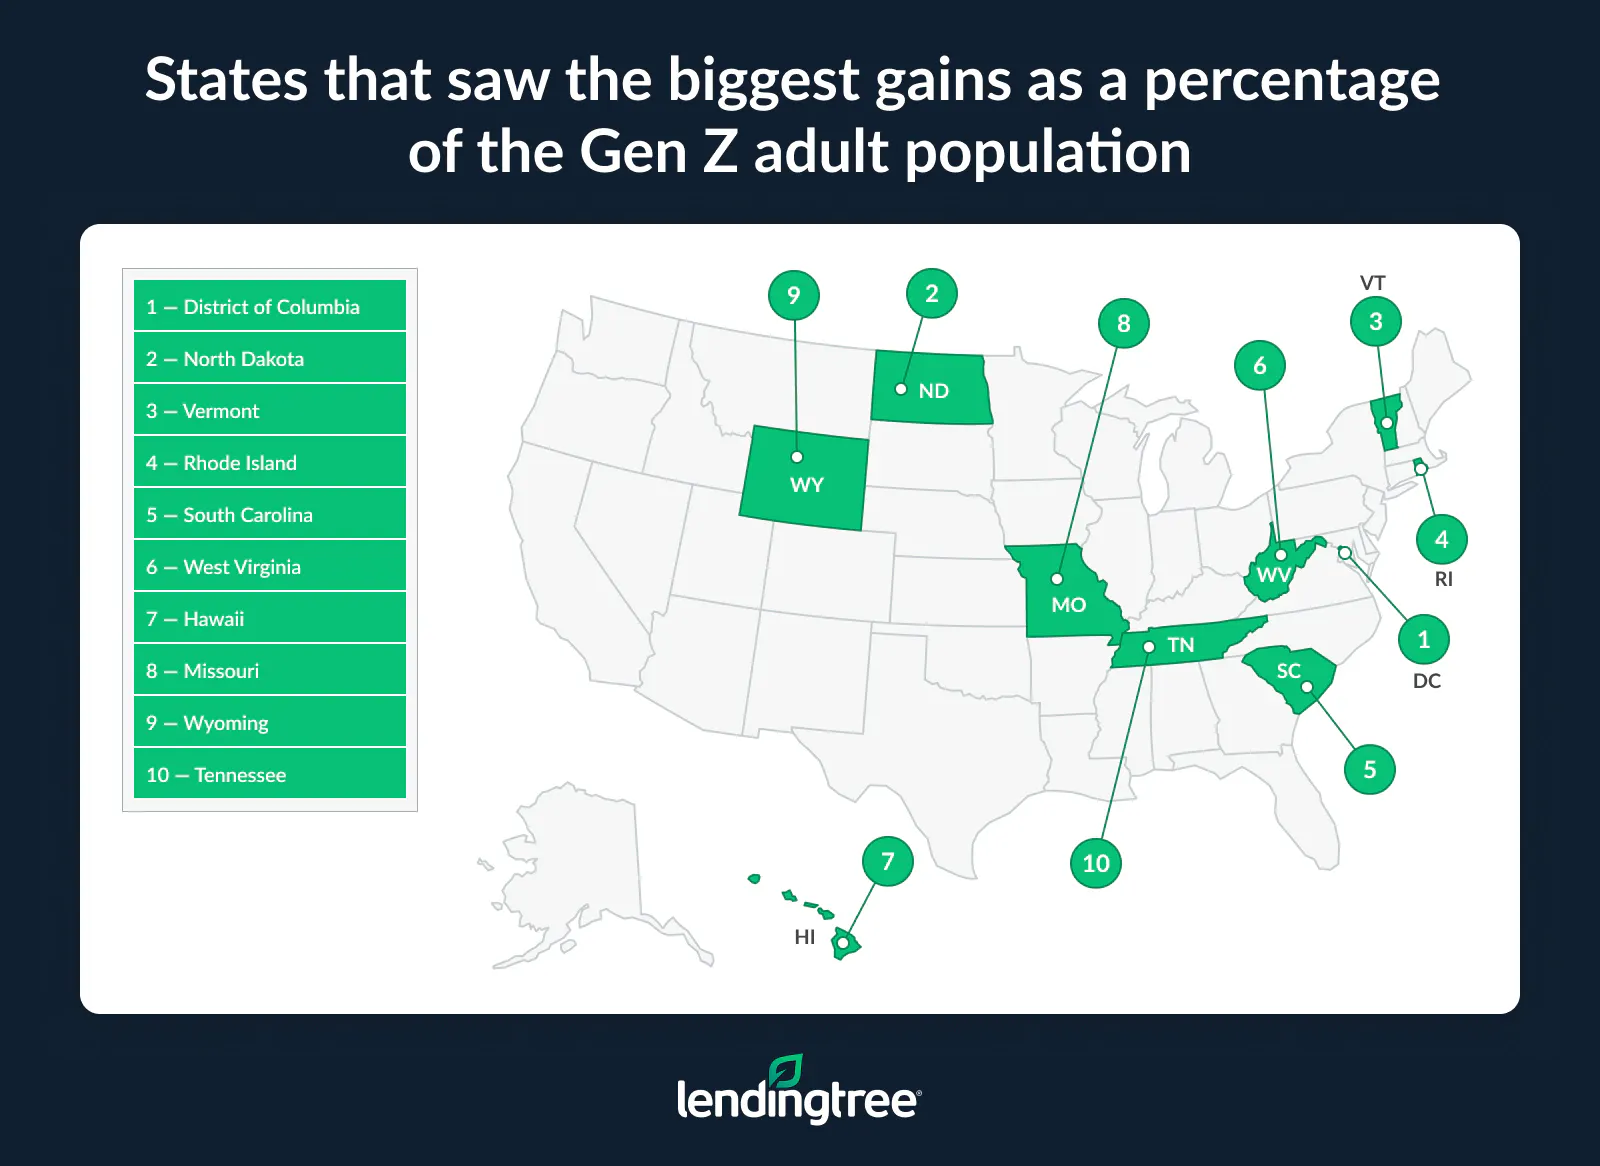
By contrast, interstate migration drove a net loss in Alaska’s Gen Z adult population, a loss that represented 6.3% of the Gen Z population, the largest share in the nation. New Jersey (down 3.3%) and Delaware (down 3.2%) had the next-largest losses by percentage. Nationally, 19 states saw their Gen Z adult populations decline due to interstate migration.
Net interstate migration as a share of Gen Z adult population, by state
| Rank | State | Gen Zers | Net interstate migration of Gen Zers | Net interstate migration as a share of current Gen Z residents |
|---|---|---|---|---|
| 1 | District of Columbia | 113,487 | 13,905 | 12.3% |
| 2 | North Dakota | 122,686 | 6,682 | 5.4% |
| 3 | Vermont | 81,395 | 3,116 | 3.8% |
| 4 | Rhode Island | 153,907 | 5,675 | 3.7% |
| 5 | South Carolina | 698,040 | 22,843 | 3.3% |
| 6 | West Virginia | 214,358 | 5,666 | 2.6% |
| 7 | Hawaii | 166,151 | 3,738 | 2.2% |
| 8 | Missouri | 827,420 | 14,063 | 1.7% |
| 9 | Wyoming | 74,133 | 1,199 | 1.6% |
| 10 | Tennessee | 942,848 | 13,537 | 1.4% |
| 11 | Nevada | 396,694 | 4,912 | 1.2% |
| 11 | Arizona | 1,049,128 | 12,593 | 1.2% |
| 11 | Washington | 1,012,954 | 11,781 | 1.2% |
| 14 | Idaho | 275,522 | 3,163 | 1.1% |
| 14 | New Mexico | 282,918 | 2,982 | 1.1% |
| 16 | Nebraska | 273,575 | 2,712 | 1.0% |
| 17 | Oklahoma | 568,919 | 4,950 | 0.9% |
| 18 | Virginia | 1,149,326 | 9,674 | 0.8% |
| 18 | Arkansas | 404,617 | 3,311 | 0.8% |
| 20 | Kentucky | 598,243 | 4,638 | 0.8% |
| 21 | Alabama | 677,843 | 3,322 | 0.5% |
| 22 | Utah | 593,089 | 2,306 | 0.4% |
| 22 | Ohio | 1,509,973 | 5,763 | 0.4% |
| 24 | Wisconsin | 781,368 | 2,573 | 0.3% |
| 24 | New York | 2,577,006 | 8,061 | 0.3% |
| 24 | Iowa | 439,361 | 1,358 | 0.3% |
| 24 | North Carolina | 1,492,820 | 4,480 | 0.3% |
| 24 | Oregon | 529,949 | 1,341 | 0.3% |
| 29 | Texas | 4,386,398 | 10,720 | 0.2% |
| 29 | Mississippi | 395,177 | 924 | 0.2% |
| 29 | Montana | 147,227 | 308 | 0.2% |
| 29 | Pennsylvania | 1,659,607 | 2,528 | 0.2% |
| 33 | Georgia | 1,513,165 | -488 | 0.0% |
| 34 | Florida | 2,740,443 | -1,685 | -0.1% |
| 35 | New Hampshire | 174,278 | -434 | -0.2% |
| 36 | Michigan | 1,343,879 | -5,275 | -0.4% |
| 36 | Colorado | 810,032 | -3,431 | -0.4% |
| 38 | Indiana | 935,376 | -4,347 | -0.5% |
| 39 | Louisiana | 589,964 | -5,339 | -0.9% |
| 40 | Massachusetts | 1,001,011 | -10,038 | -1.0% |
| 41 | Maryland | 757,481 | -8,268 | -1.1% |
| 41 | California | 5,225,833 | -58,109 | -1.1% |
| 43 | Kansas | 414,575 | -4,862 | -1.2% |
| 43 | Illinois | 1,684,369 | -20,031 | -1.2% |
| 45 | Connecticut | 471,255 | -6,061 | -1.3% |
| 46 | Maine | 158,000 | -2,574 | -1.6% |
| 47 | Minnesota | 738,487 | -13,827 | -1.9% |
| 48 | South Dakota | 116,722 | -2,392 | -2.0% |
| 49 | Delaware | 125,616 | -4,038 | -3.2% |
| 50 | New Jersey | 1,151,703 | -37,556 | -3.3% |
| 51 | Alaska | 96,277 | -6,069 | -6.3% |
What to consider before moving across state lines
Moving to a new state can be exciting. It can also be expensive in ways that aren’t obvious when you’re scrolling through apartment listings.
Rent matters, of course, but it’s only one part of the picture. Transportation costs might change dramatically. Insurance could cost more. Taxes may work differently than you expect. A destination that looks affordable at first glance may not feel that way once all the bills start arriving.
Before you pack, take some time to look beyond the moving truck:
- Figure out what everyday life will cost. Compare rent, but don’t stop there. Think about the expenses that’ll shape your monthly budget in the new location. Will you need a car when you don’t have one today? Will your commute be longer? How much will you spend on groceries or utilities? One major change can be enough to erase the savings from cheaper housing.
- Expect the move itself to cost more than you think. There are the obvious expenses, such as movers or a rental truck, and then there are all the little ones. None of them may be overwhelming on their own, but they can add up quickly. Give yourself some wiggle room if you can, especially if there will be a wait before your first paycheck.
- Take a look at the tax picture. Taxes vary from state to state, and moving during the year may mean filing returns in more than one state. Things can get complicated for remote workers and students, too. You don’t have to become a tax expert before moving, but you should know enough to recognize when you may need professional help.
- Check your insurance before you go. Your renters, health or auto coverage may change after a move. Get new quotes when possible and make sure your health plan will work as needed in your new state.
- Be careful with your credit. Moving can bring apartment applications, new utility accounts and a pile of expenses all at once. Check your credit reports before you begin. More importantly, try not to put the entire move on a credit card just because it’s convenient. High-interest debt can turn a temporary expense into a longer-term problem.
- Leave yourself a way out. Nobody moves expecting things to go badly, but jobs fall through. Apartments don’t always live up to their listings. Sometimes a new city just isn’t the right fit. Keeping some emergency savings untouched can give you options if you need to change housing, look for work longer than expected or even move back.
You can’t plan for everything, and you don’t need every detail nailed down before you go. Just take the time to understand what’s likely to change. A little homework now can save you a lot of stress later.
Methodology
LendingTree researchers analyzed the U.S. Census Bureau’s 2024 American Community Survey (ACS) one-year public use microdata to estimate where Gen Z adults moved.
The analysis defined adult Gen Zers as people ages 18 to 27 in 2024.
To measure interstate migration, researchers identified respondents who lived elsewhere one year earlier, compared their previous state of residence with their current state and excluded moves that began and ended in the same state. Interstate inflow represents residents arriving from another state or the District of Columbia; outflow represents residents leaving for another state or the District of Columbia; and net interstate migration equals inflow minus outflow.
Researchers then used a separate unrestricted population table to calculate net interstate migration as a share of each state’s current population ages 18 to 27.
College enrollment estimates are based on respondents’ enrollment status at the time of the 2024 ACS survey among Gen Z adults whose state of residence differed from where they lived one year earlier.
View mortgage loan offers from up to 5 lenders in minutes